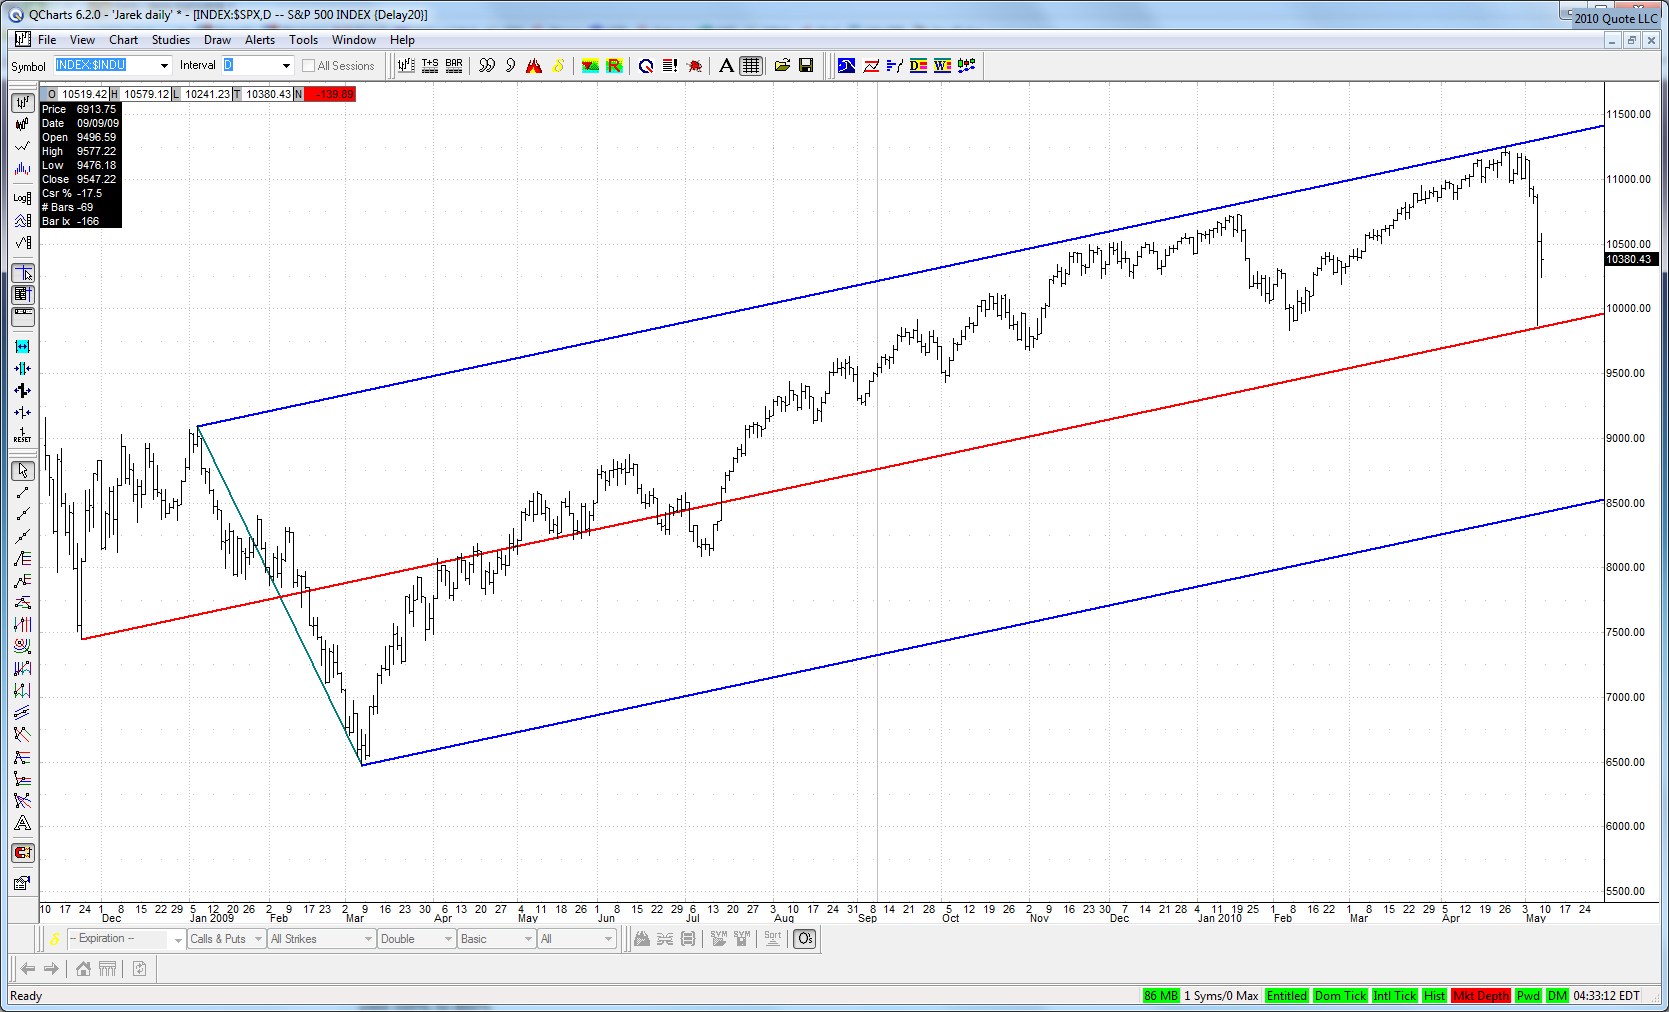
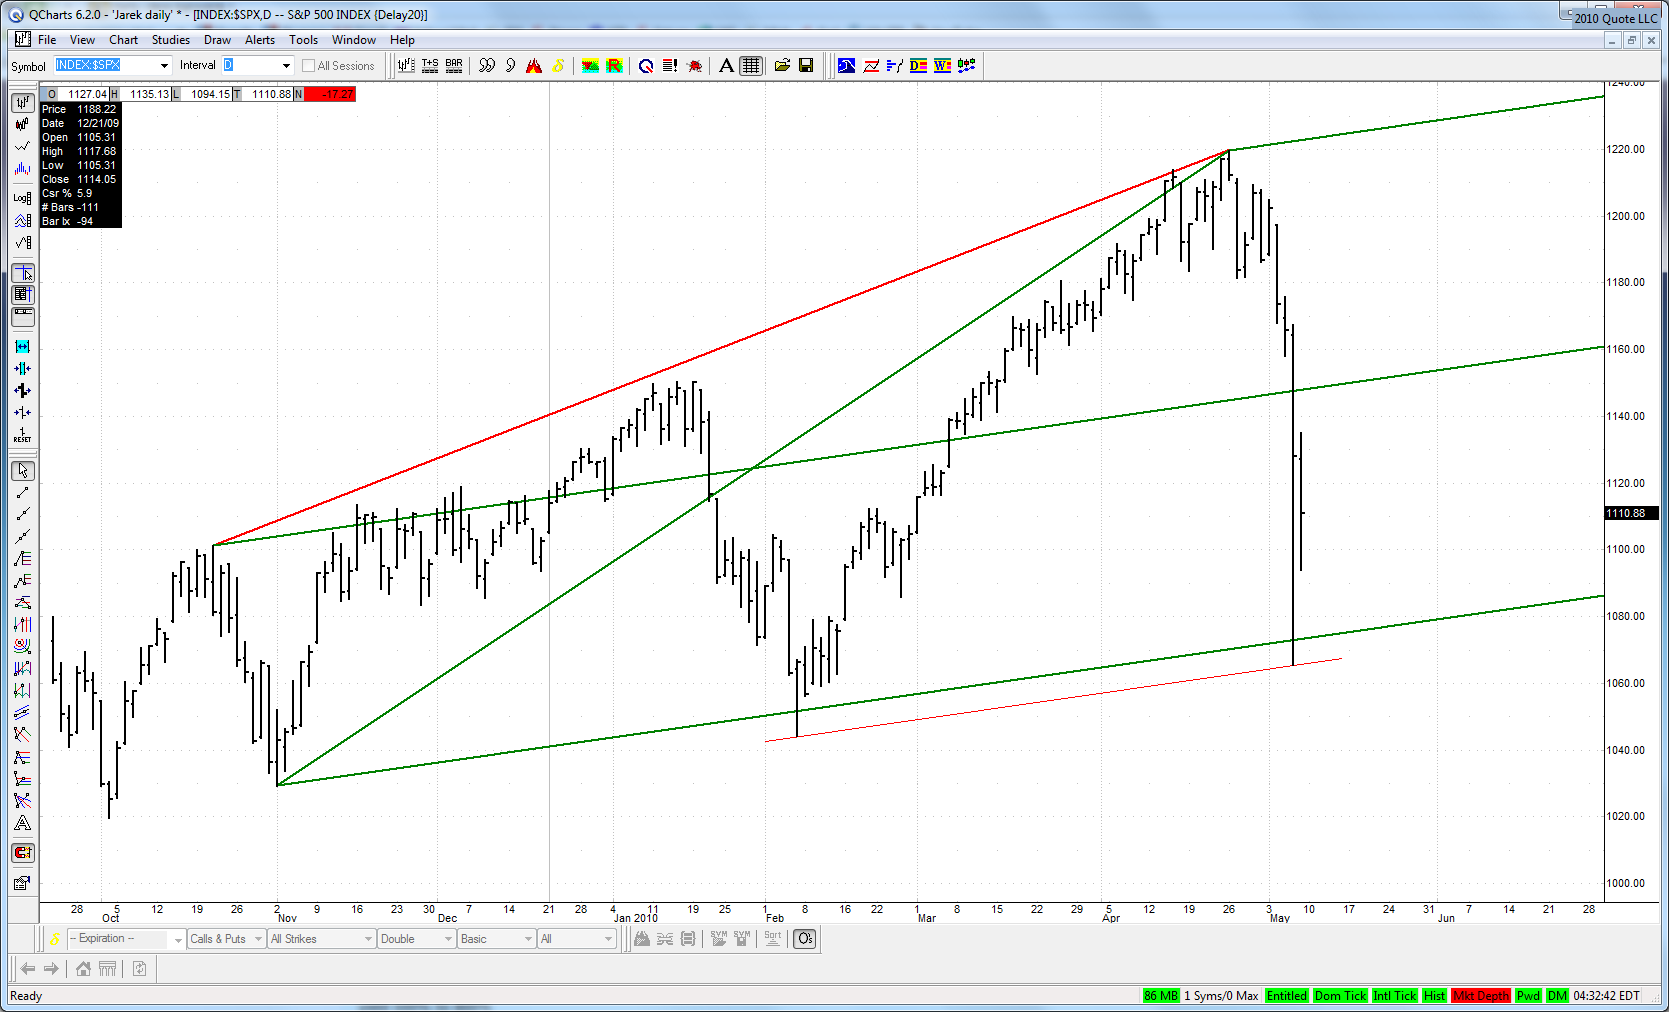
Here are two interesting long term charts of main indexes:
Isn't it amazing that what seemed to be a disorganized collapse reversed dramatically exactly where it should according to geometry??
JI
jimkane
Rep: 3,058
Posts: 33,089
Did I put something together and show it to you guys, or what? The methodology, I mean.
JI
jimkane
Rep: 3,058
Posts: 33,089
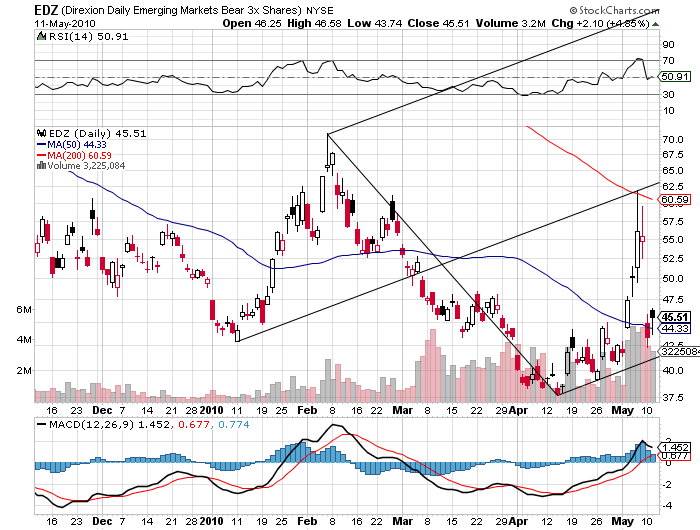
Now, there's a nice little breakdown. 42.50, down 9.75. It's starting... :-)
JI
jimkane
Rep: 3,058
Posts: 33,089
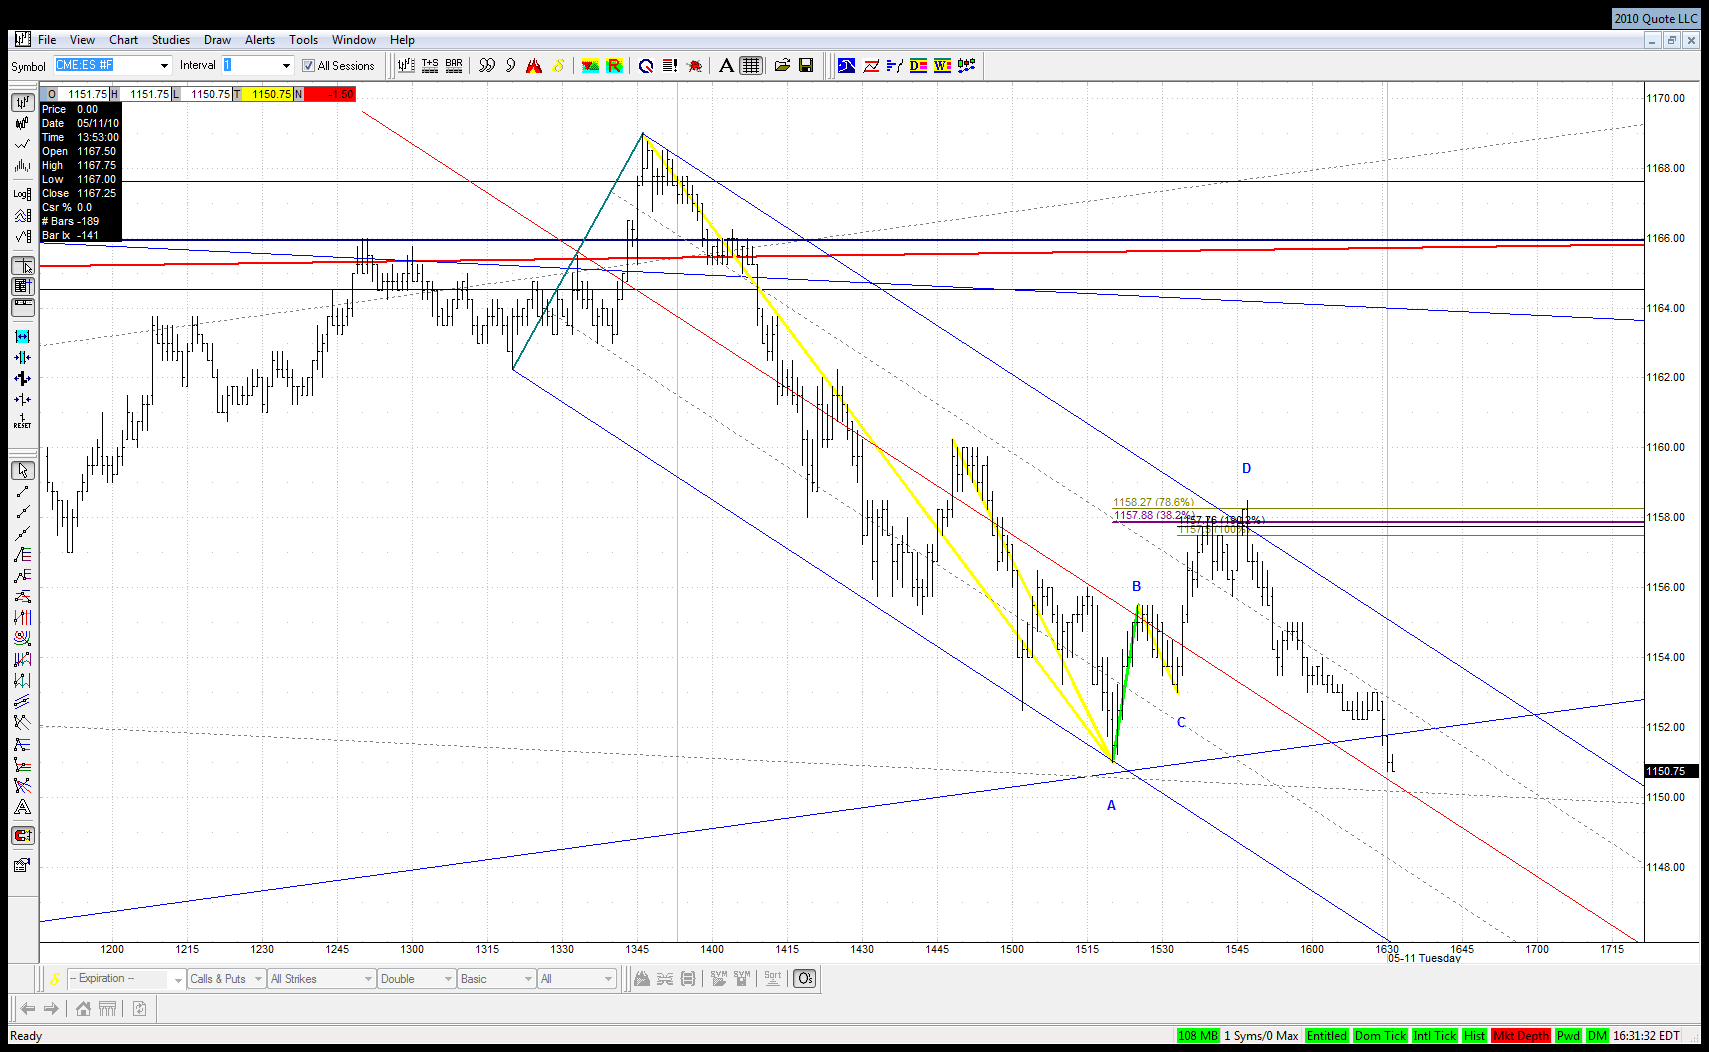
And the bounce in a little ABCD, and then down off that. I need to stop sleeping and try to trade 24/7...
RO
roofer
Rep: 3,689
Posts: 3,574
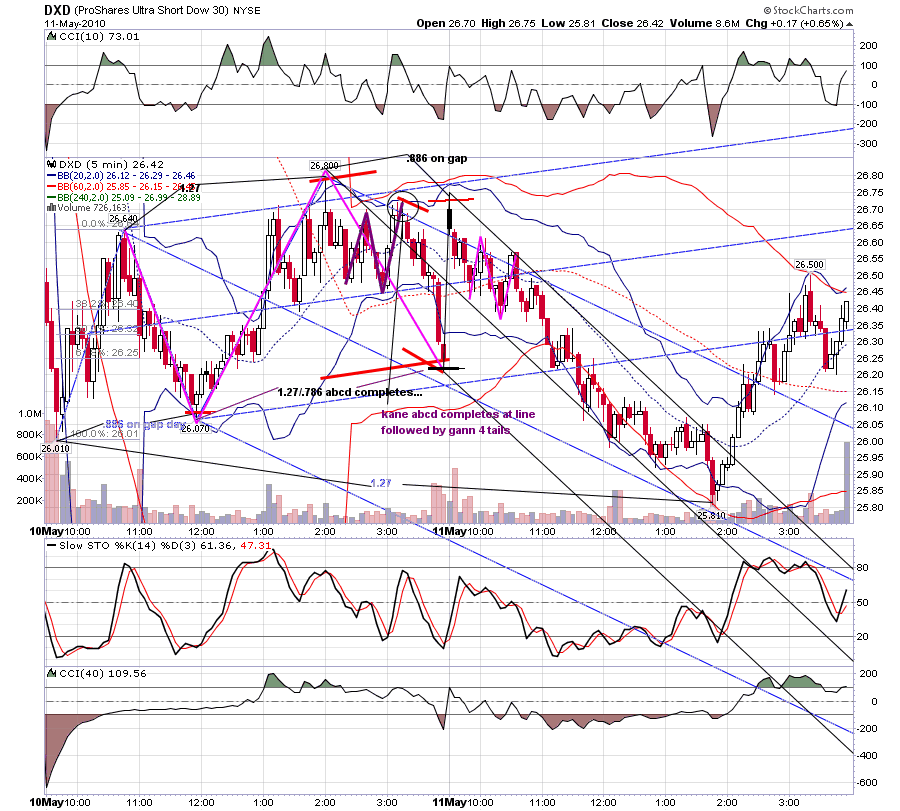
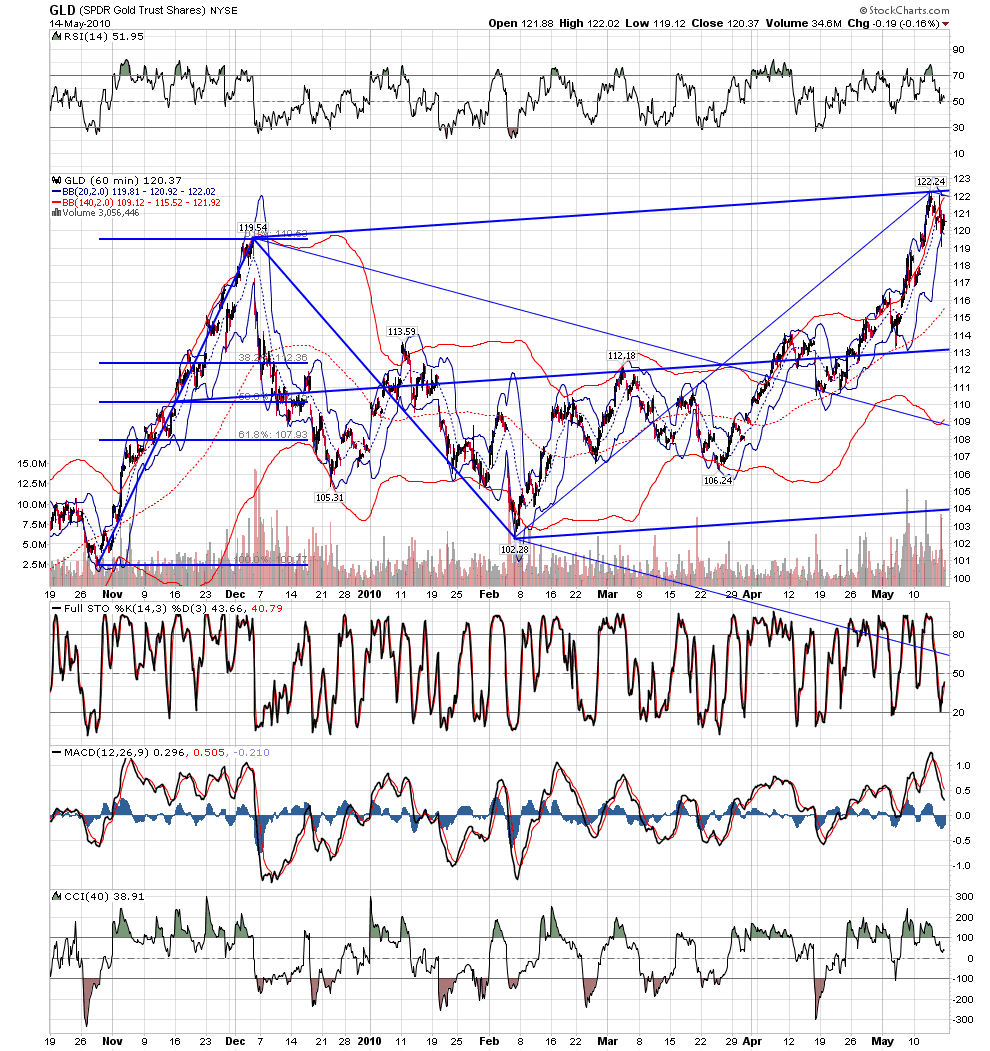
in chaos there is order.....there was good posting yesterday... i was just playing the computers game these last two days... again the #1 way i know that the odds of a trade i am in have collapsed is if a kane abcd sets up againt it... that is what happened in my gold trade, i posted that as well as my stop... i was stopped out soon after with some change in my pocket...