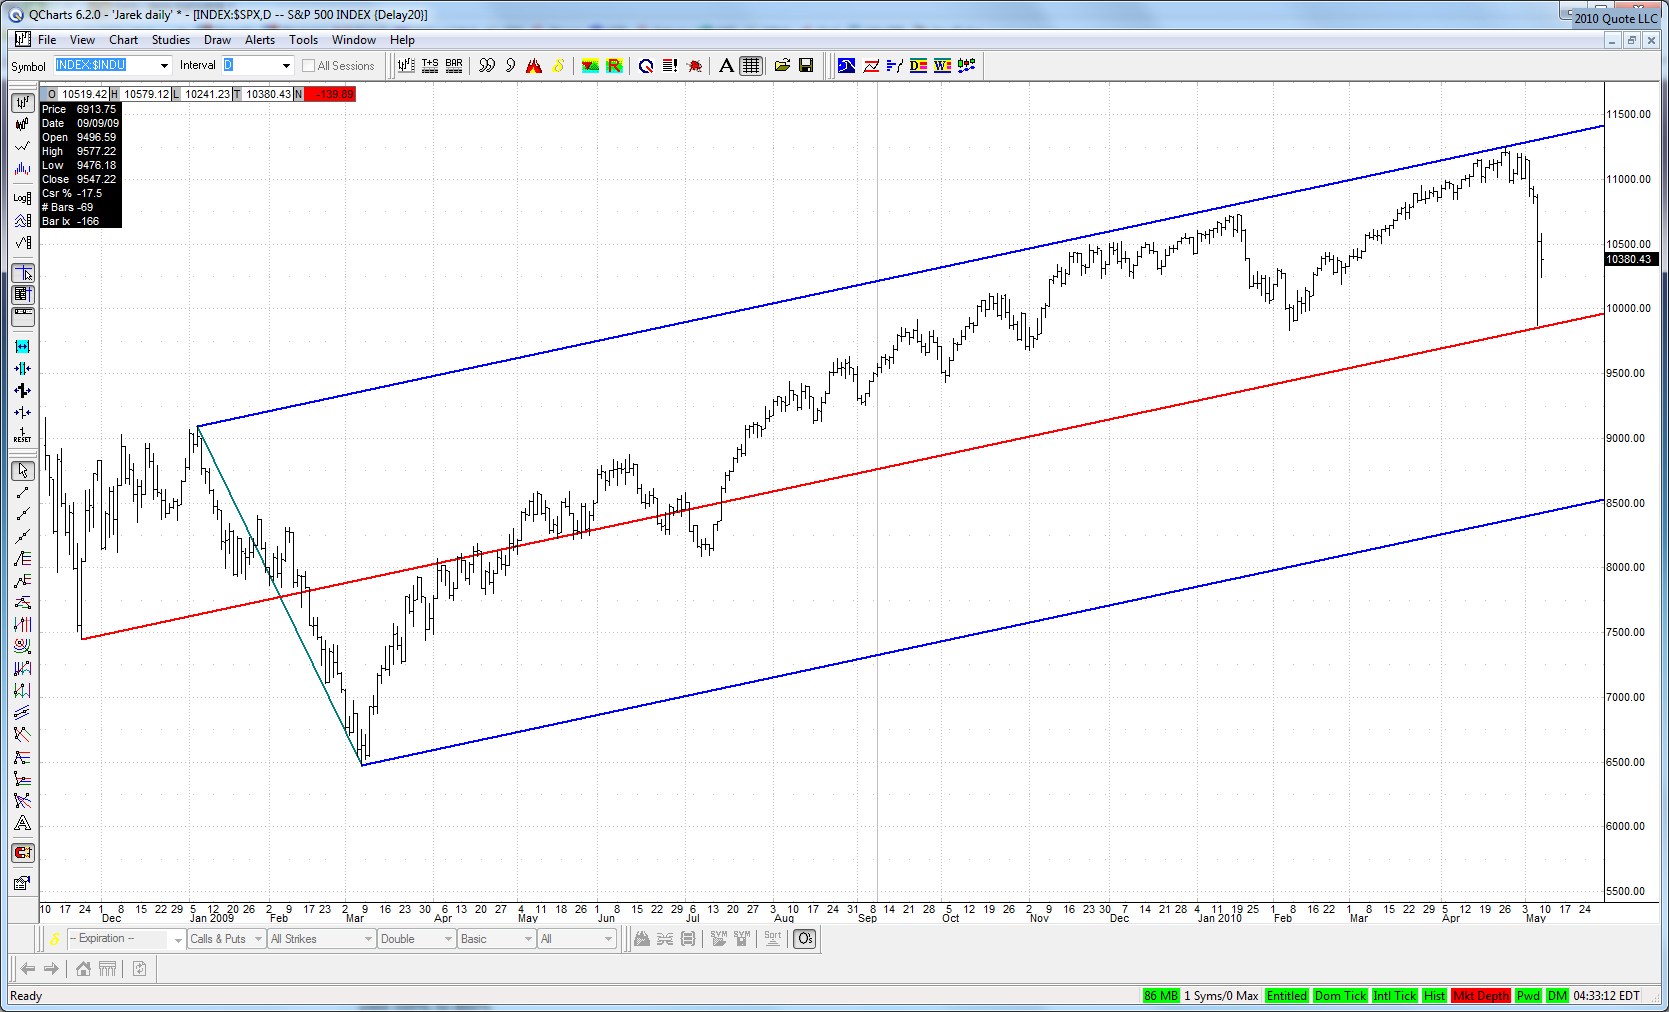
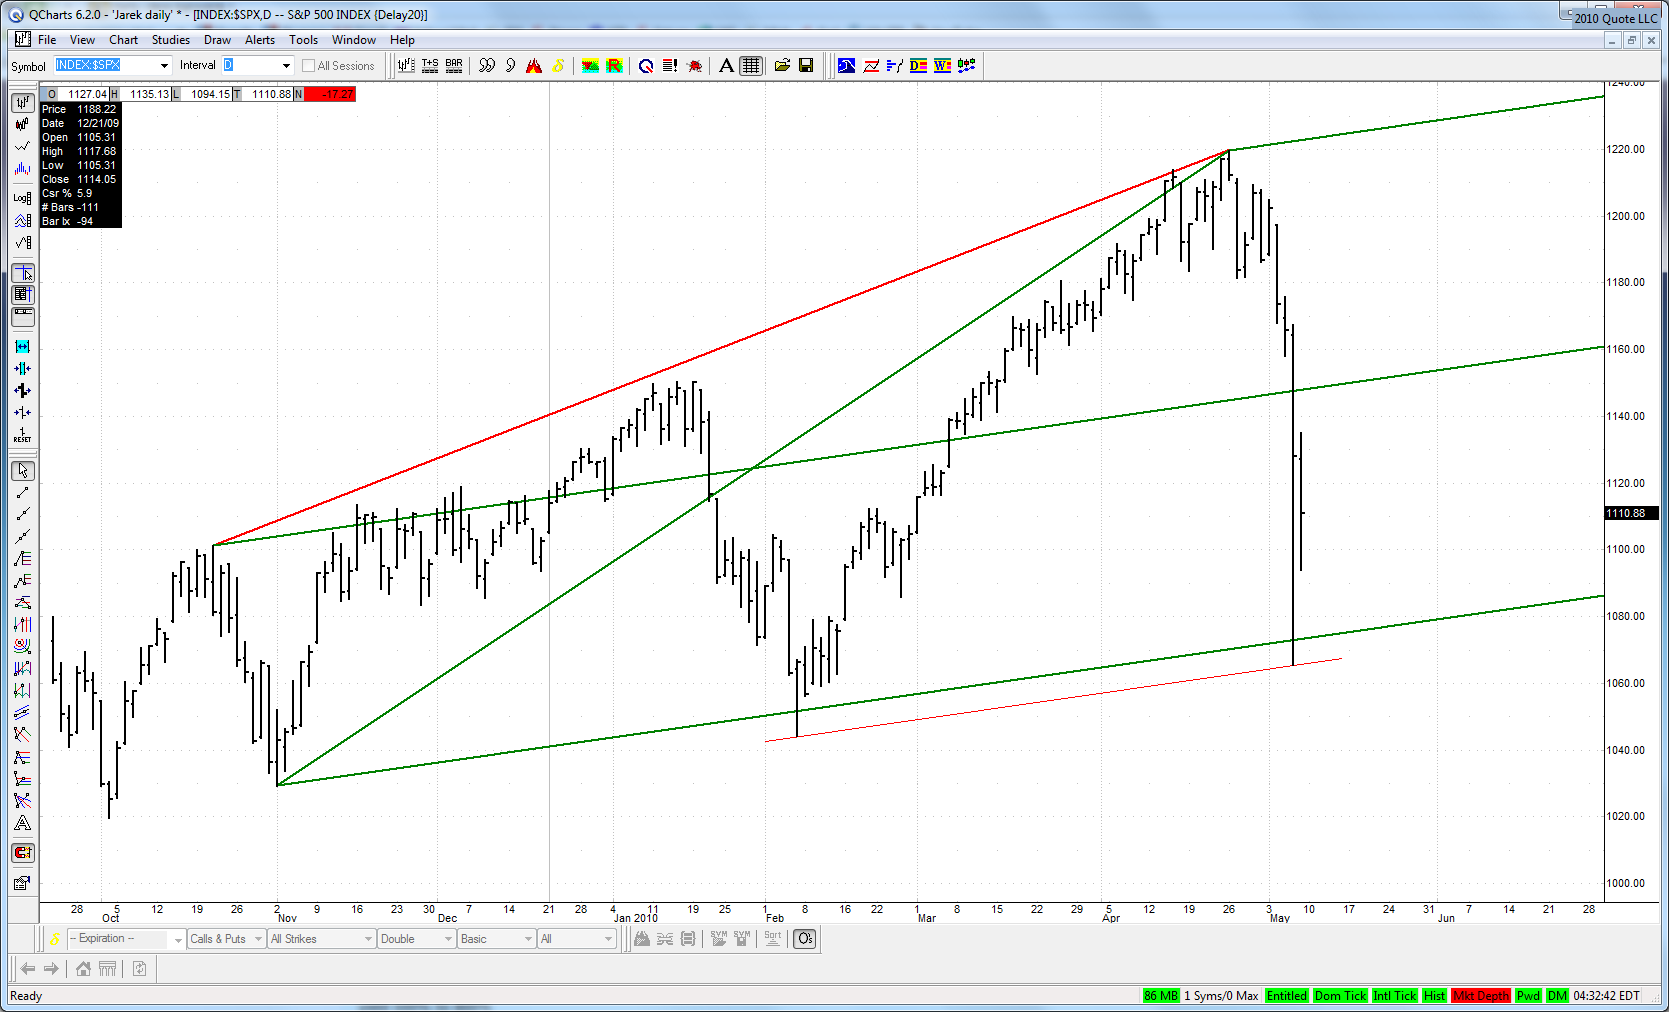
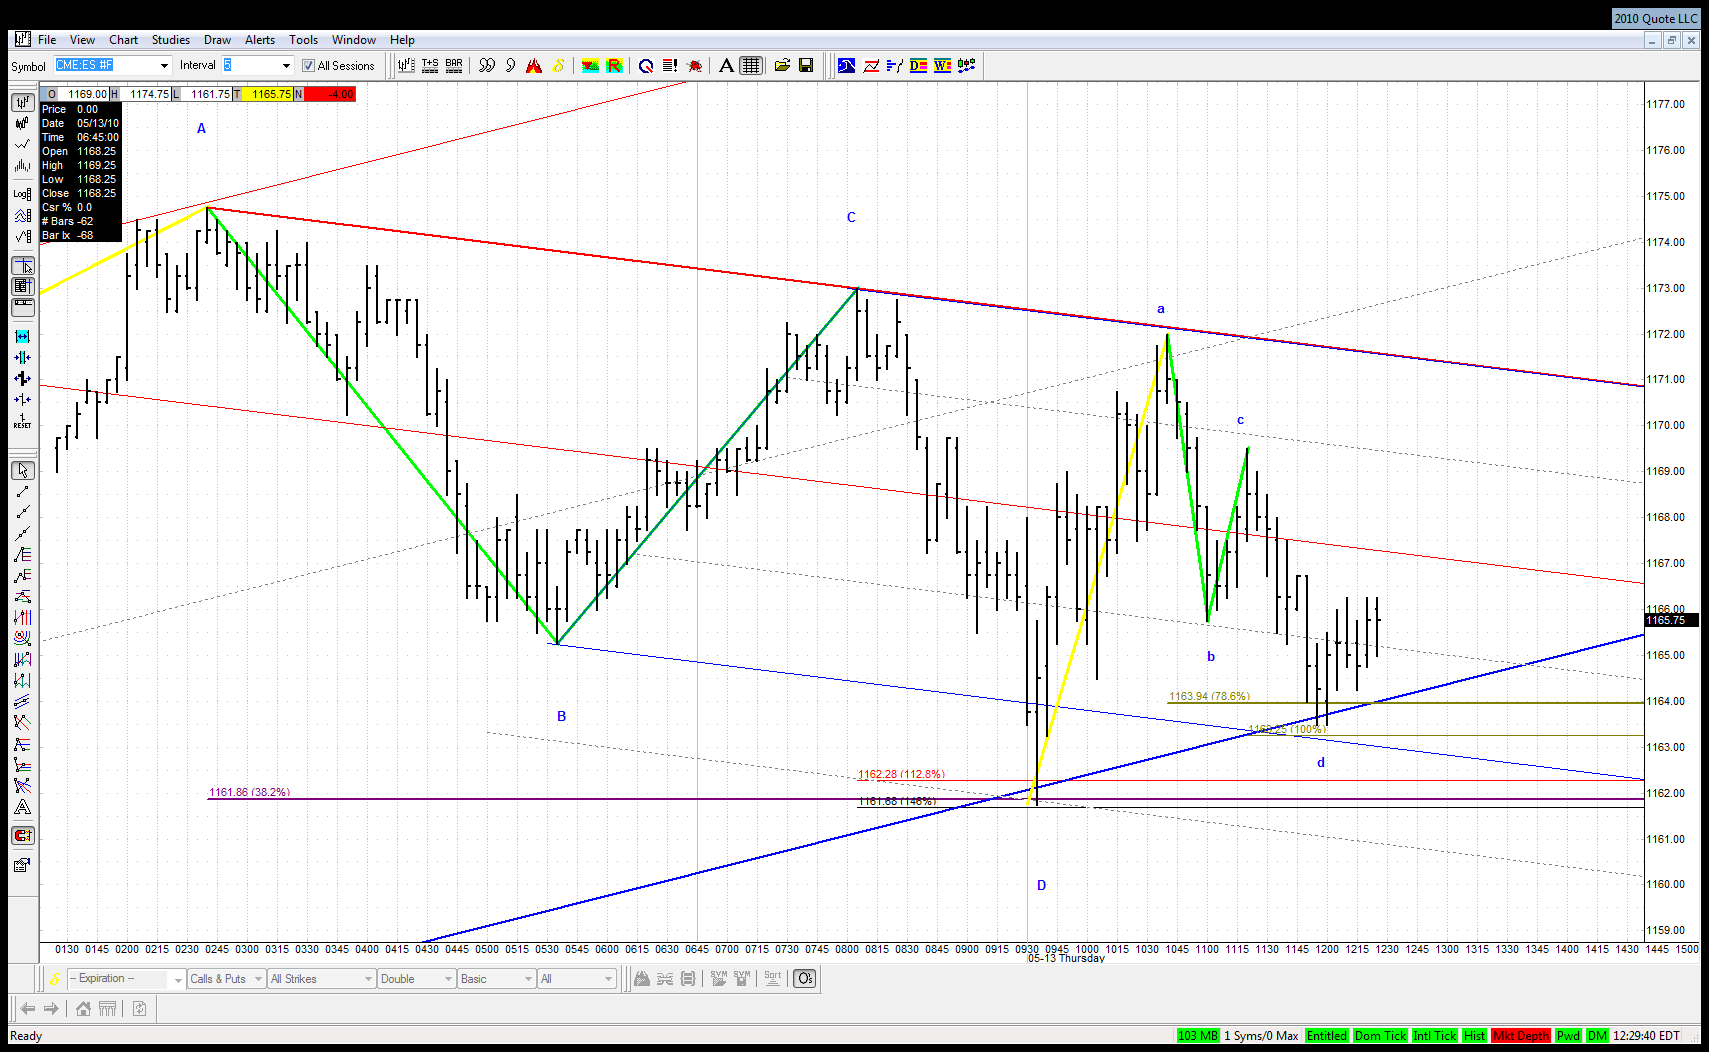
Here is this .382 ABCD and initial reaction off it:
Click image for original size
JA
jarek
Rep: 94
Posts: 3,474
0
I noticed that Al posted it already earlier today - nice charts Al!
AL
albert
Rep: 99
Posts: 3,094
0
You are welcome. And I thank you for all of your wonderful charts. Your charts & comments are really great.
Al Kamego
AL
albert
Rep: 99
Posts: 3,094
0
Jarek,
Thanks to you too.
Al Kamego
JI
jimkane
Rep: 3,058
Posts: 33,089
1
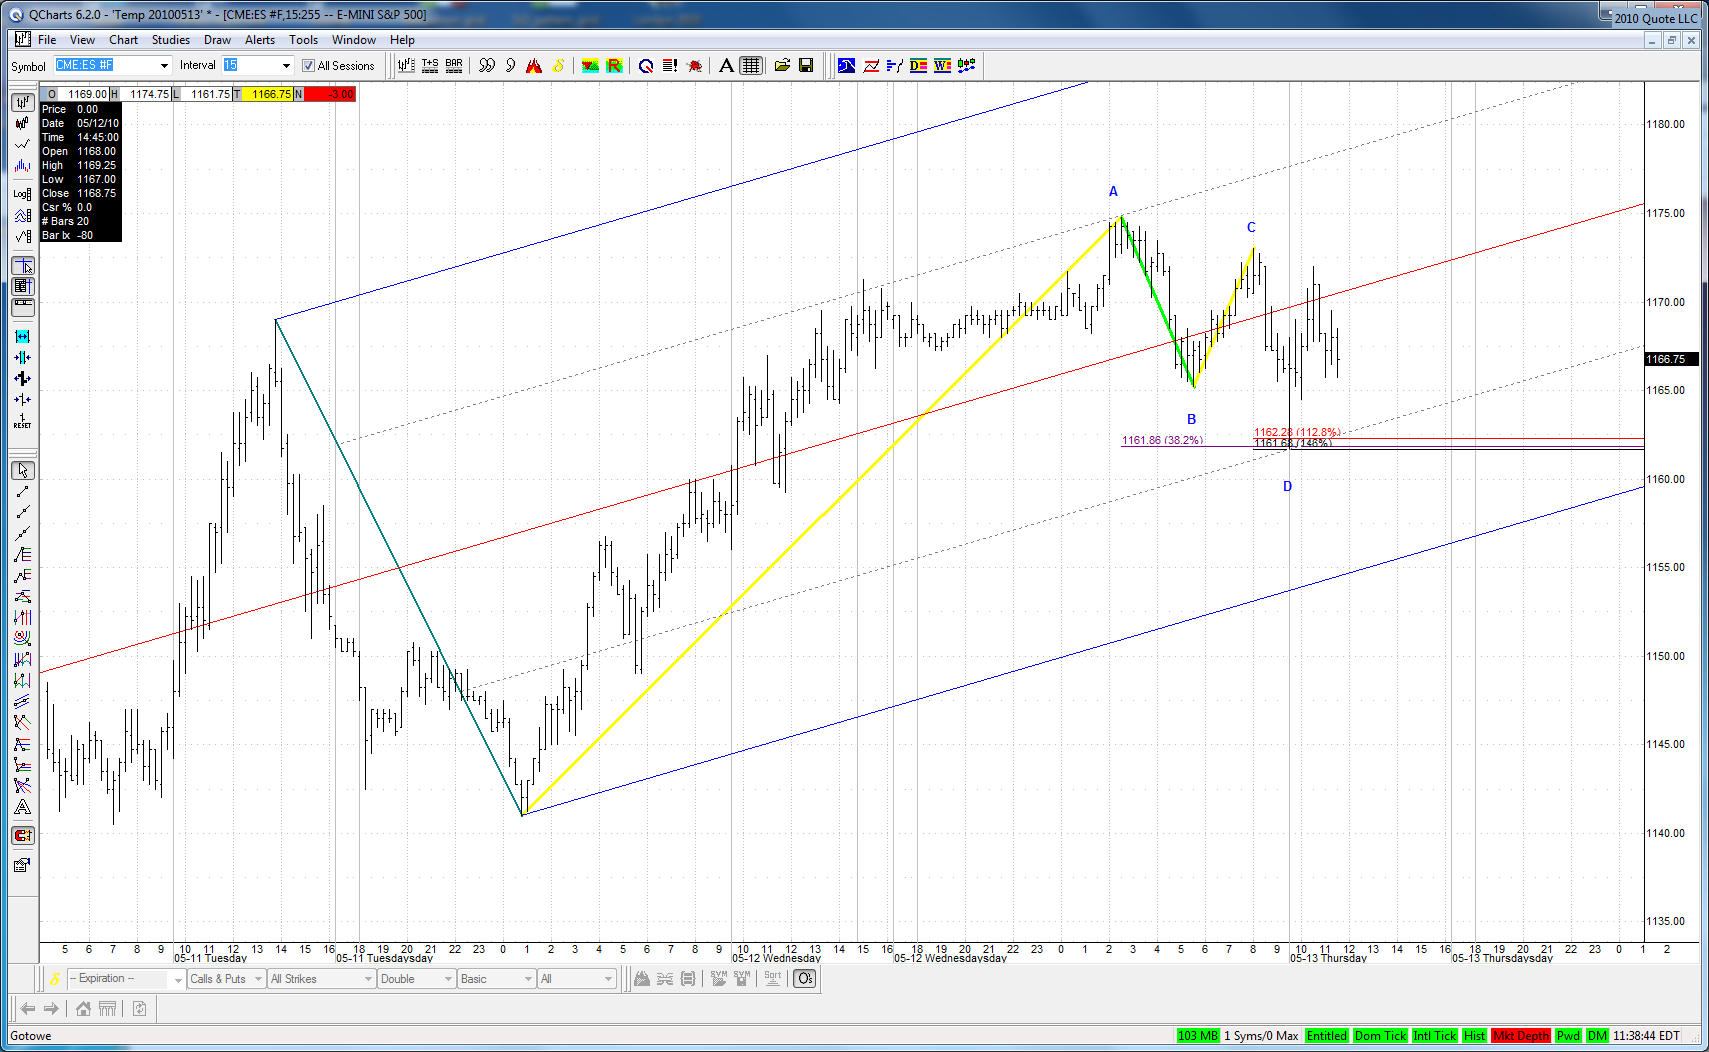
Notice the TL over A and C and where it rolled over, with the 3D visible on say a 3-min.
JI
jimkane
Rep: 3,058
Posts: 33,089
0
Right back to the ABCD key line, and sitting on it. If that gives way, watch out.
JI
jimkane
Rep: 3,058
Posts: 33,089
0
Oh, yeah, and it came back in an ABCD. I think it will give way. If so, these are big clues that this may be done going up.
JA
jarek
Rep: 94
Posts: 3,474
1
(Edited )
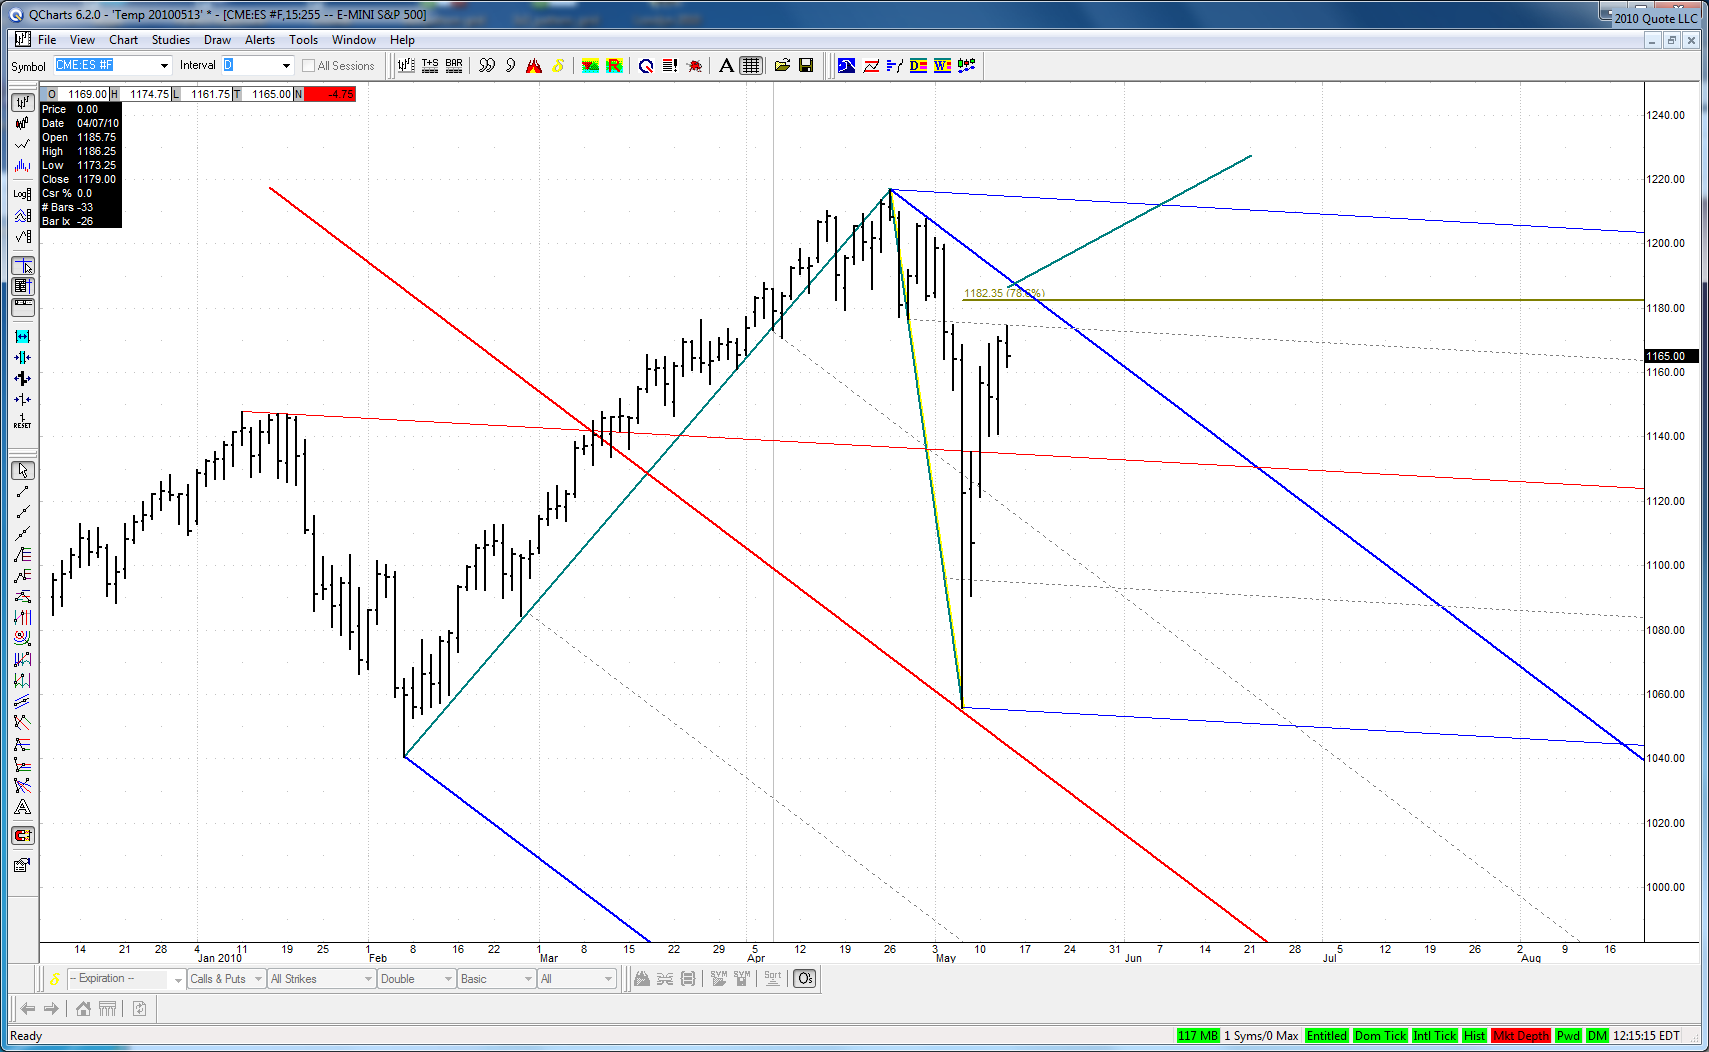
If this is a big W2 from the top than there is still some room left for the upside:
Click image for original size
Although today's high lies exactly on the divisional line of a nice natural set with multipivot ML.
JA
jarek
Rep: 94
Posts: 3,474
1
(Edited )
The potential W2 of the move off our .382 ABCD was more than perfect and also took shape of an ABCD:
Click image for original size
So if the setups fails we will have 2 failed ABCD at the same time adding significance to the event.
JI
jimkane
Rep: 3,058
Posts: 33,089
1
Those are the charts I am talking about, and the concepts. Look at that chop crap action off the 'W2' ABCD off the bigger ABCD, right at the key line. This should be rocketing up. And maybe it will. But the response is muted, and shouldn't be. That's why I suspect it may fail. If it does, I think it is extremely technically significant.