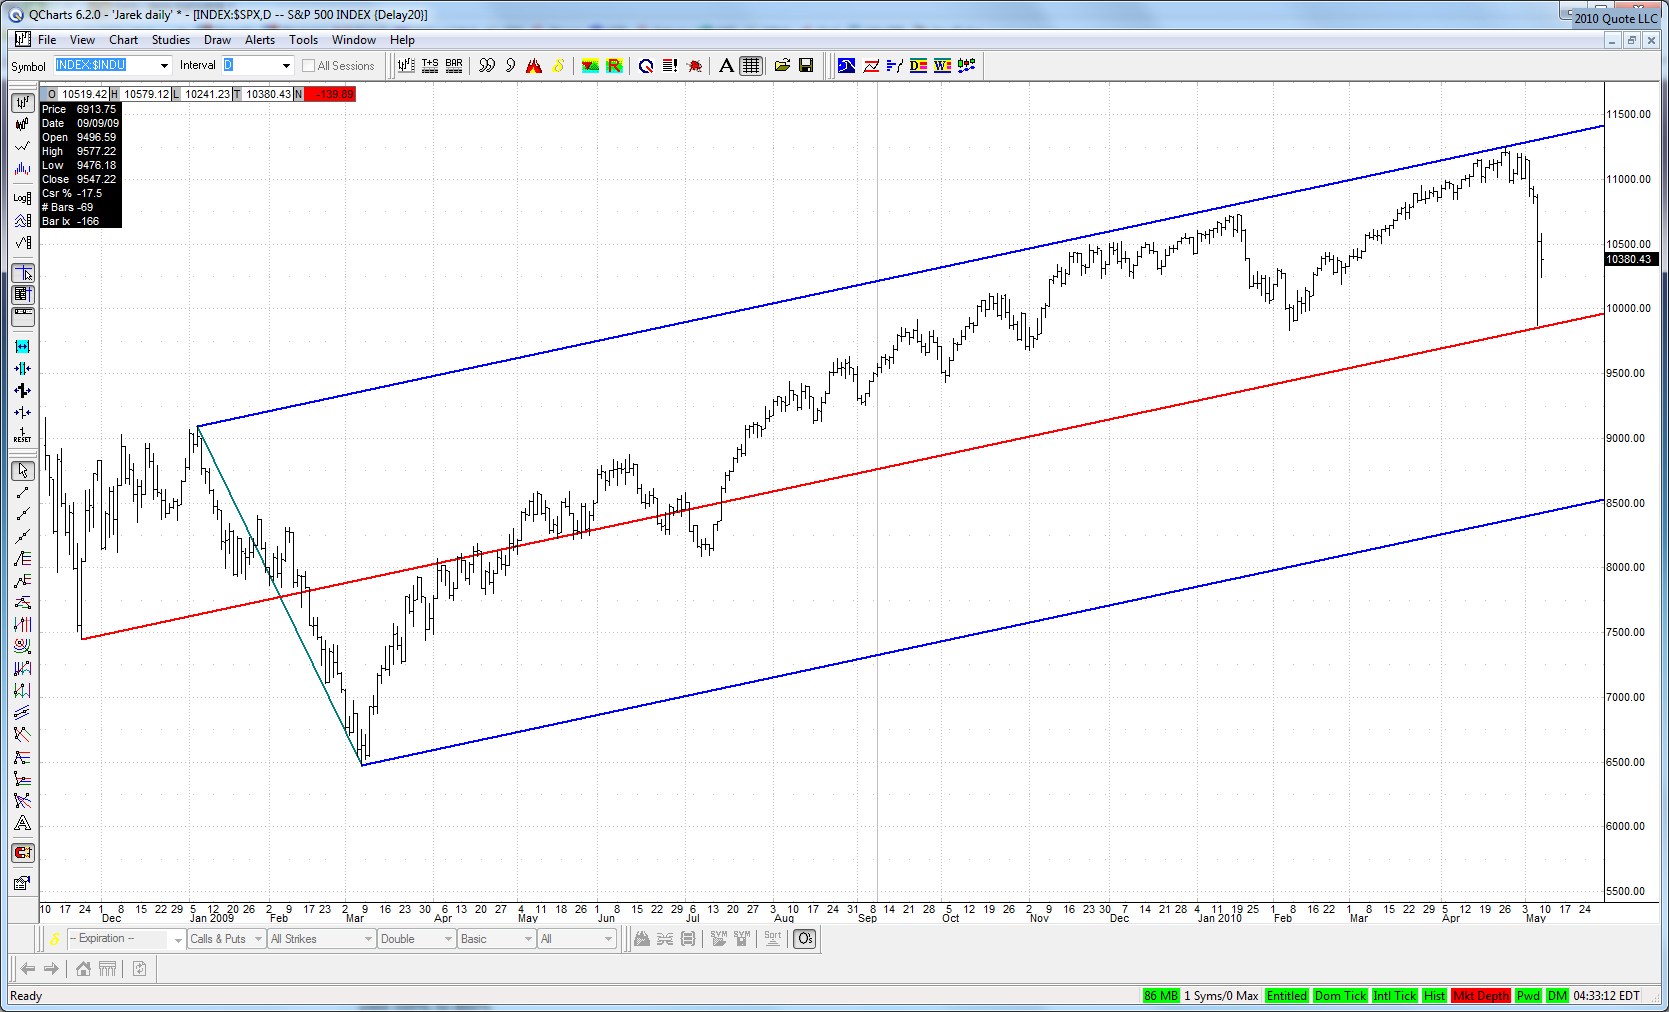
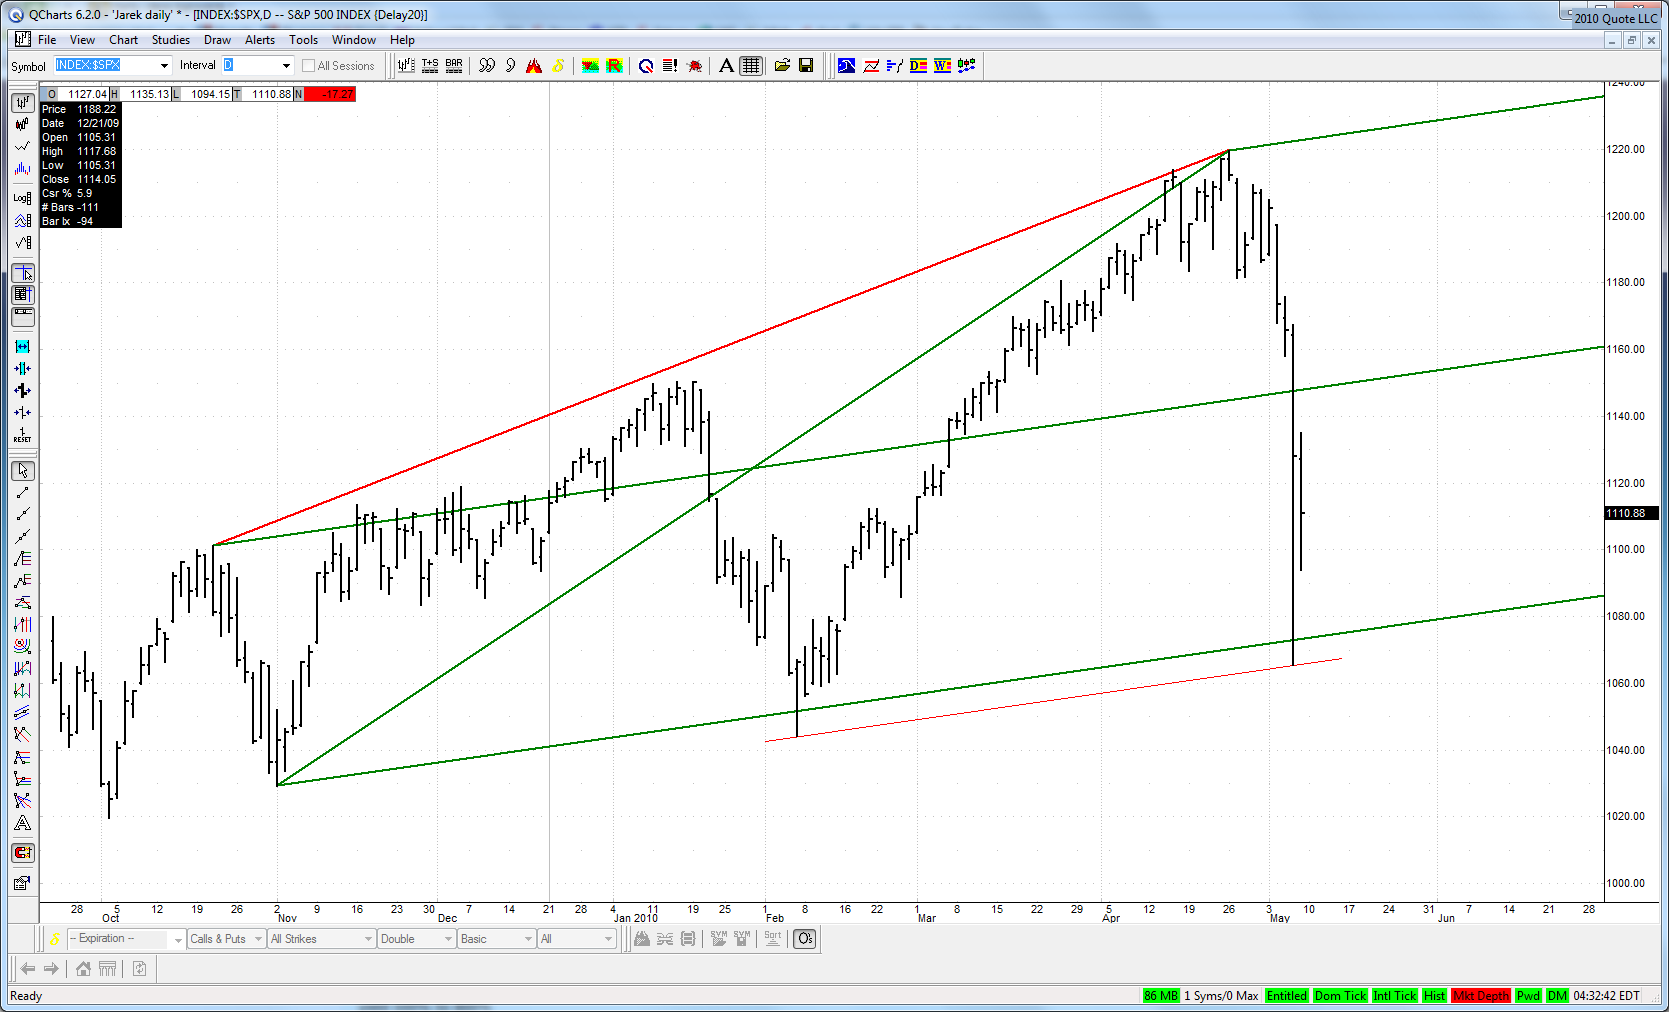
And right up off it it goes. Amazing. But they are getting weaker and weaker, in my opinion. They must run this up here and not lose that SL. There's nothing but air below. I'm ready for it.
JI
jimkane
Rep: 3,058
Posts: 33,089
1
Look at how this stopped right at the TL over the 4PT, and how it is coiling like crazy right here. Look for an upside explosion very soon.
JI
jimkane
Rep: 3,058
Posts: 33,089
0
Yeah, that one. Now, follow through or stop run?
JI
jimkane
Rep: 3,058
Posts: 33,089
0
And the answer is: ding, ding, ding follow through.
JI
jimkane
Rep: 3,058
Posts: 33,089
1
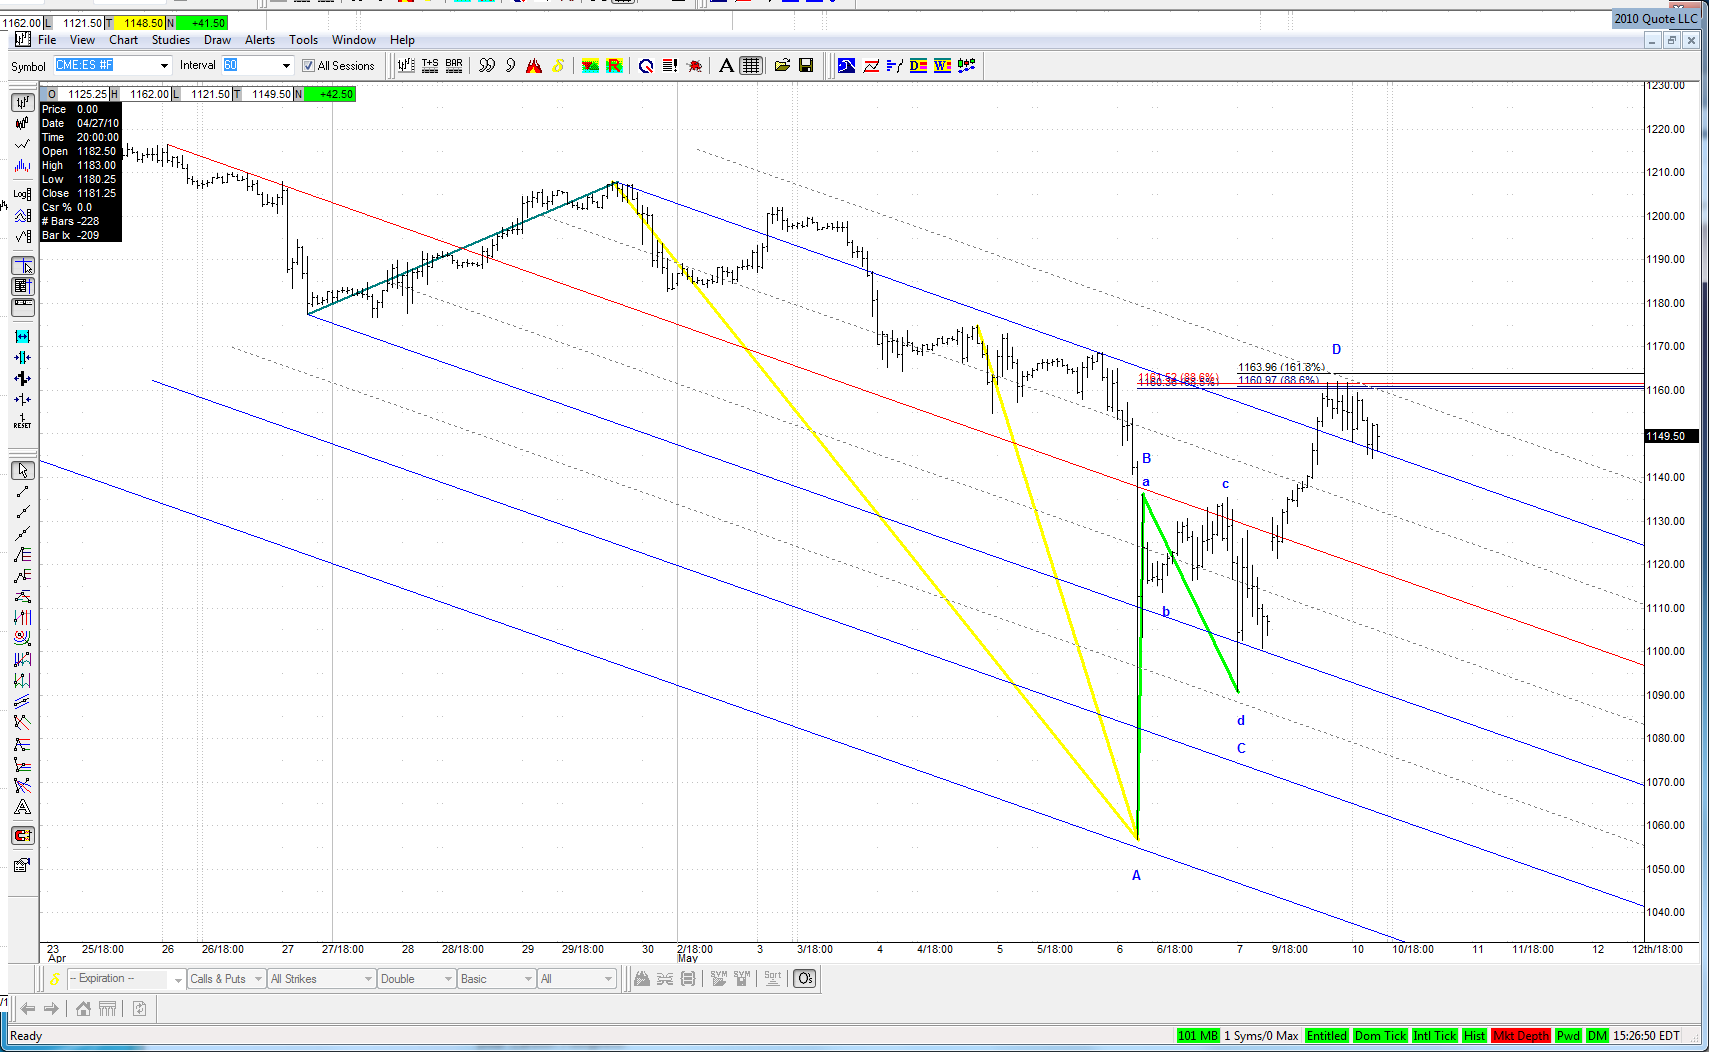
But, watch the TD ABCD here, and then the B=D, and the EXP. It may have just been a big stop run.
JI
jimkane
Rep: 3,058
Posts: 33,089
0
Okay, here it goes. TD line hit. The big ABCD looks ready to exert its influence. If so, up it goes.
JI
jimkane
Rep: 3,058
Posts: 33,089
0
Wow, dropped like a rock off that TD upper // to the tick!
ER
EricD
Rep: 63
Posts: 692
0
Jim you are on fire with the anaylsis....this is not your typical posting....it must be very hard to do both but is sure is helpful.
JI
jimkane
Rep: 3,058
Posts: 33,089
0
As long as the posts are short.
JA
jarek
Rep: 94
Posts: 3,474
0
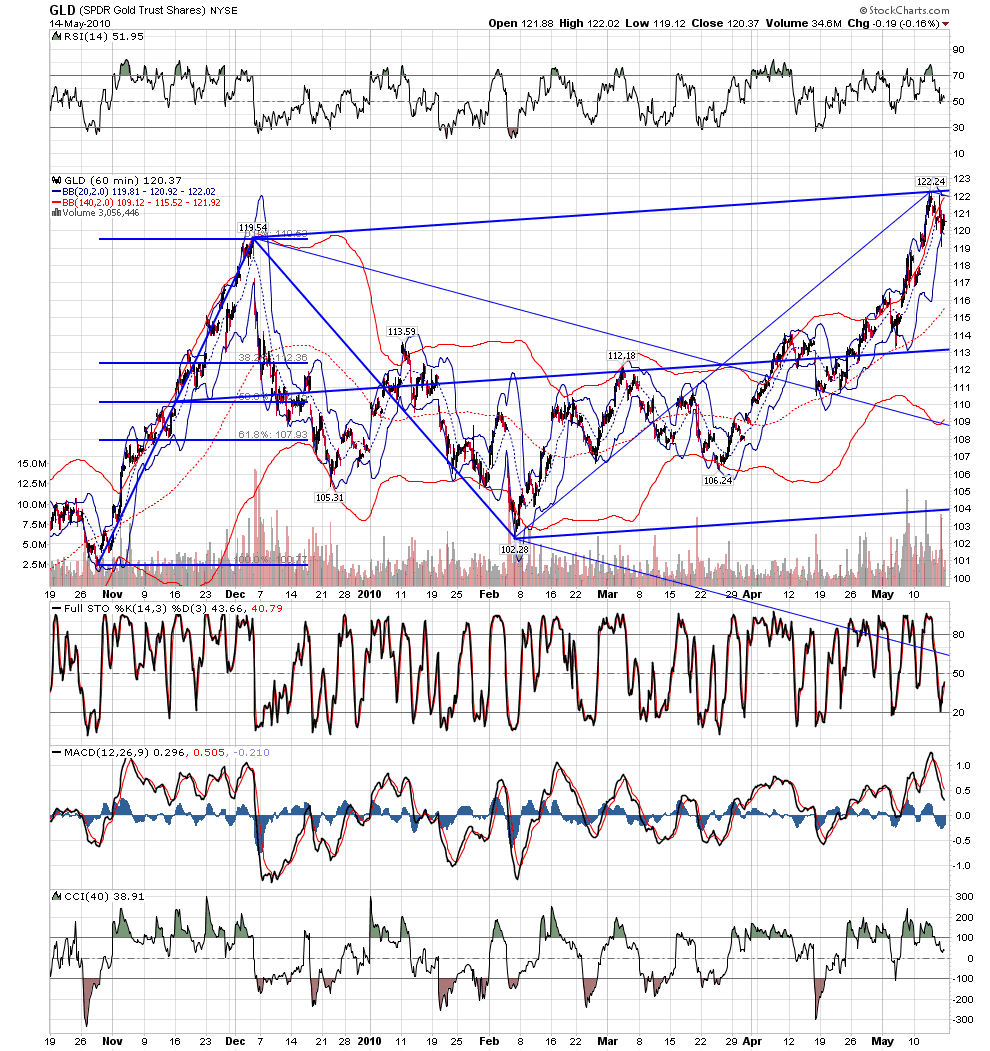
Jim - would you count this one a valid bearish ABCD?