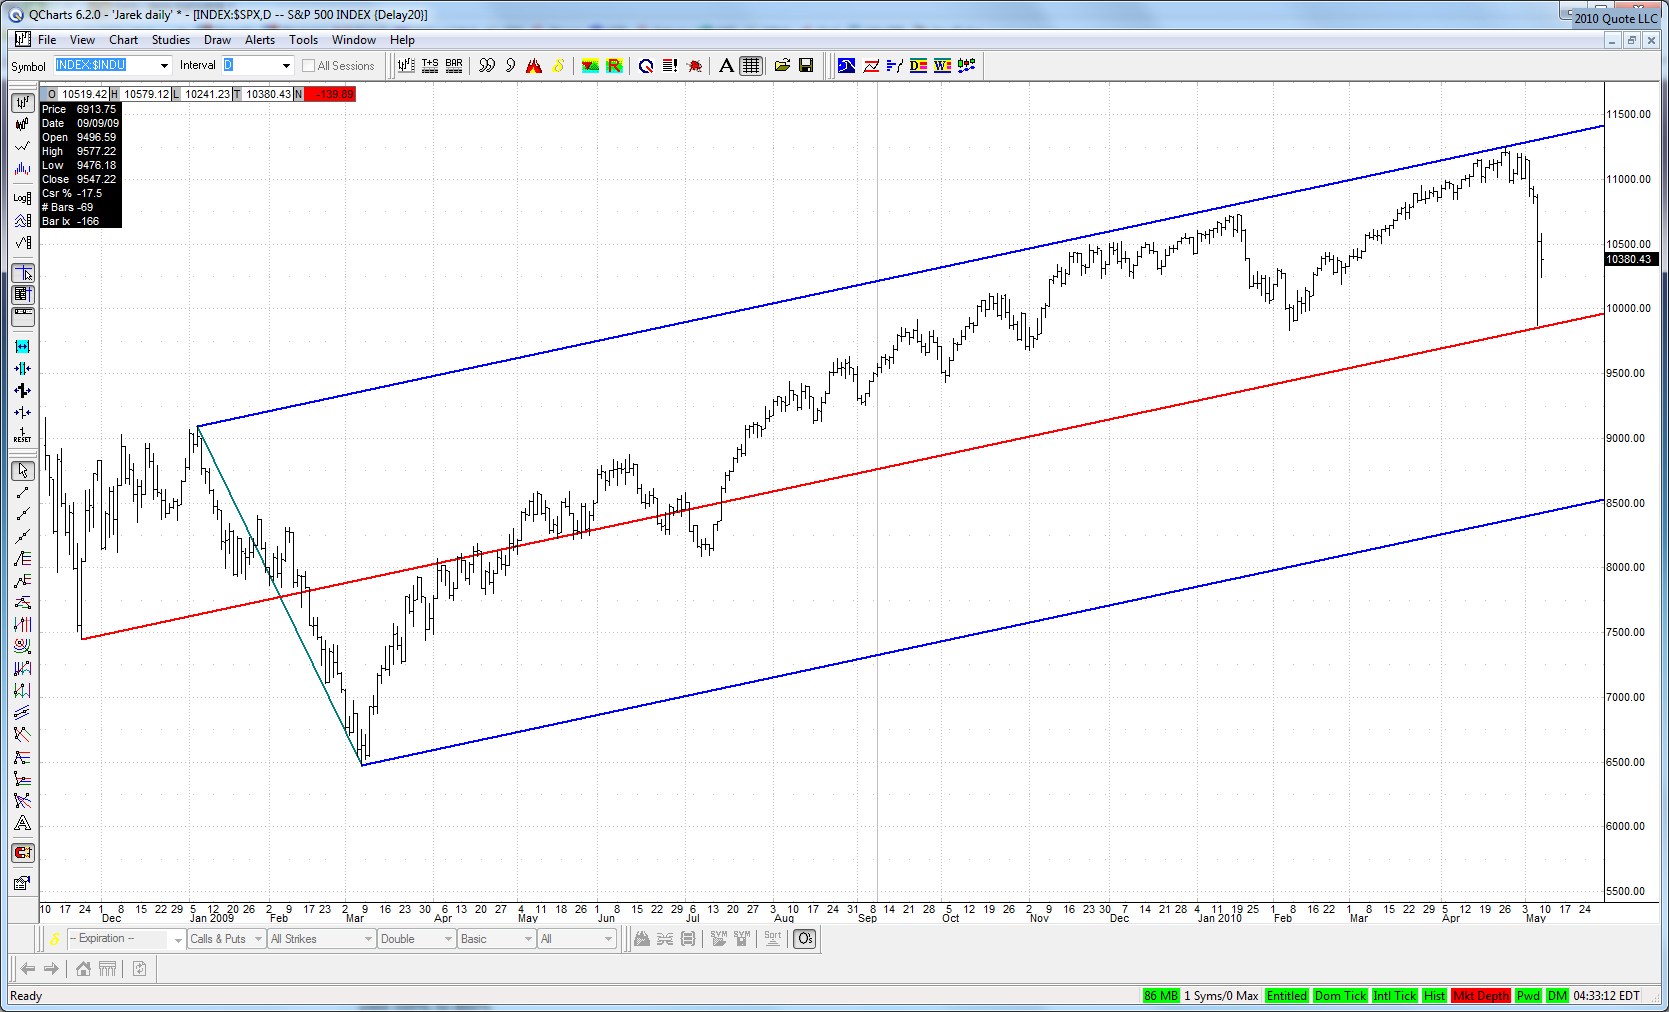
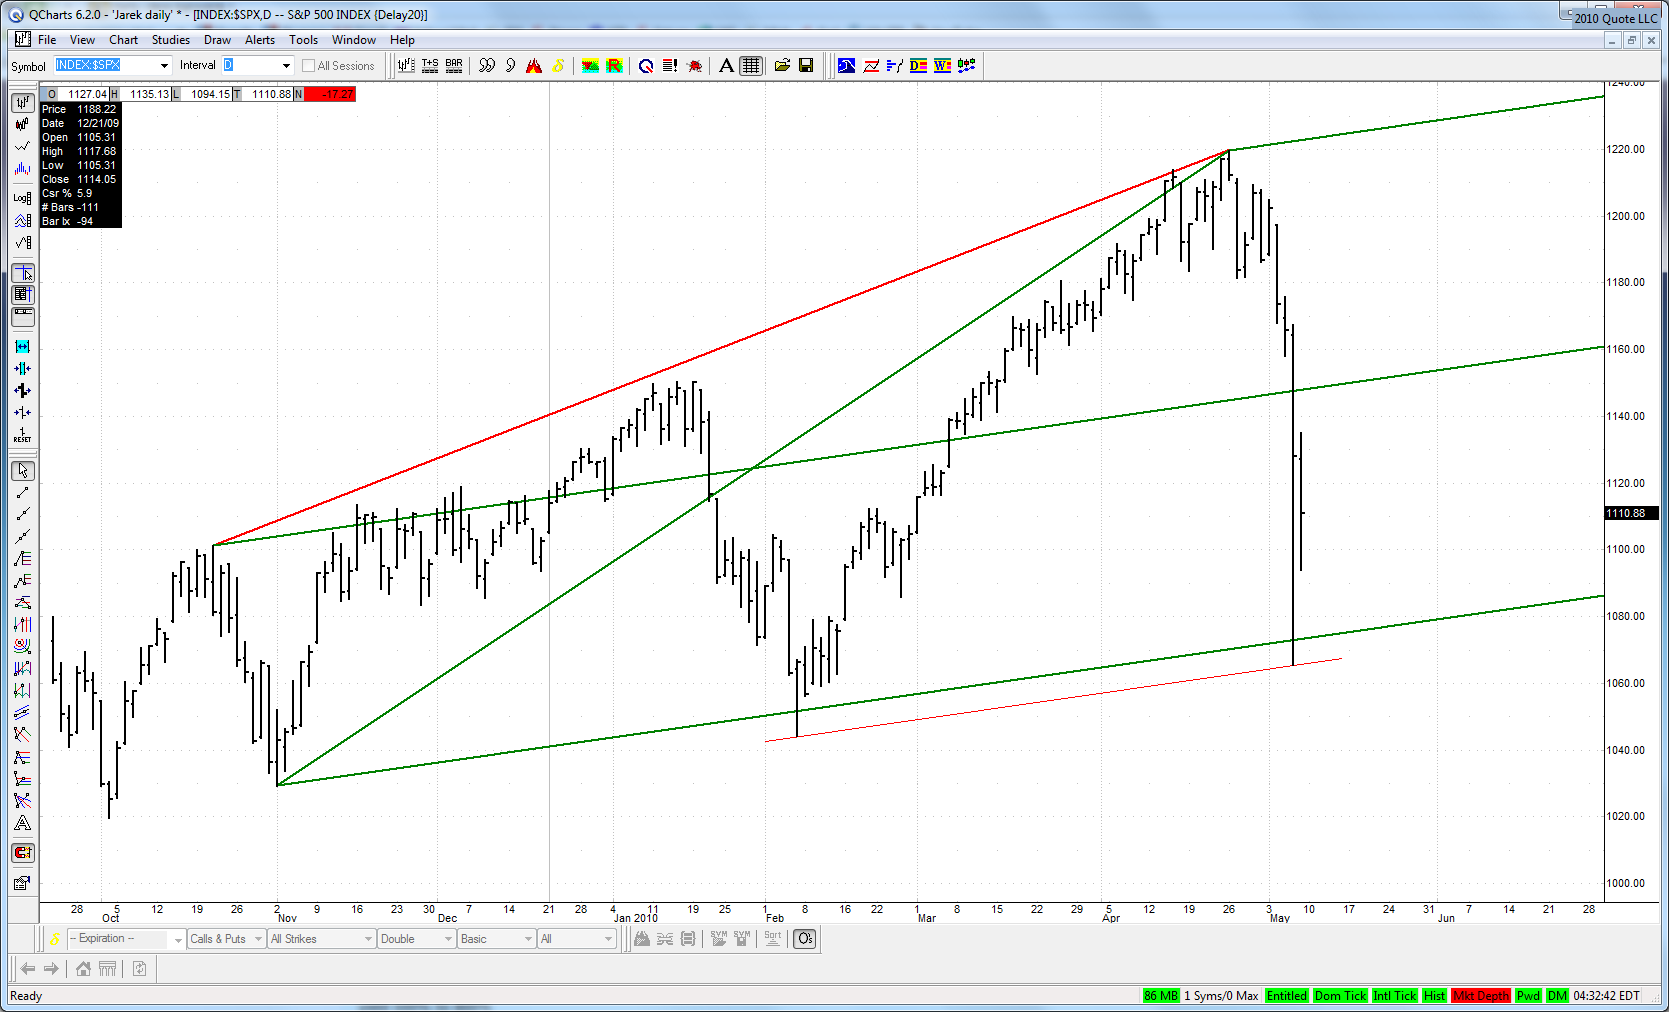
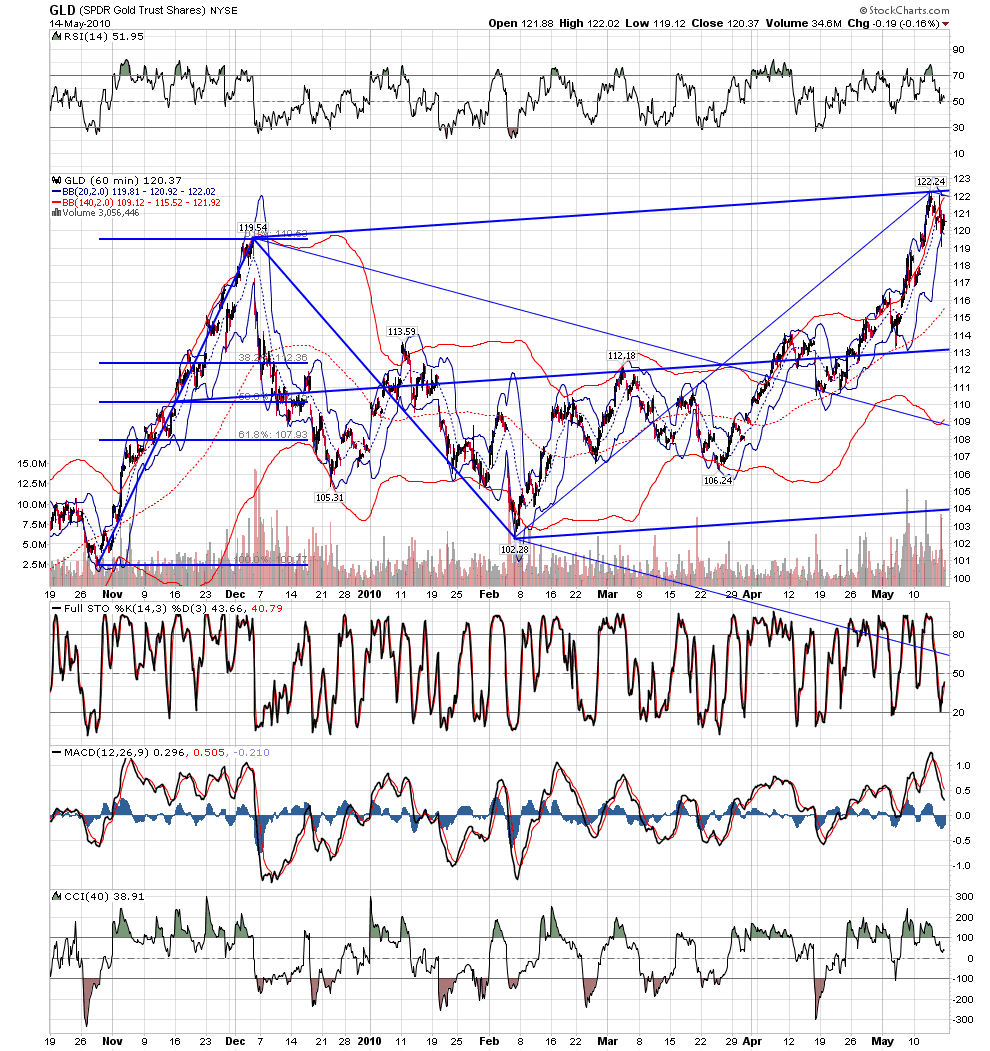
Hey, anyone notice gold, a few ticks from taking out that all-time high? Who has been saying since that last high that it was but one more proportional dip in a series of such dips on the way to yet another new high? As it was written, so shall it be... :-)
JI
jimkane
Rep: 3,058
Posts: 33,089
1
(Edited )
Does everyone see the ABCD here at a key line and .236/.300, with a 3D into the area? If that plays out it should launch on the open.
JI
jimkane
Rep: 3,058
Posts: 33,089
0
They're off!
JI
jimkane
Rep: 3,058
Posts: 33,089
0
Careful at 48.50 and that smaller ABCD.
JI
jimkane
Rep: 3,058
Posts: 33,089
1
Main areas 51 and 54ish.
JI
jimkane
Rep: 3,058
Posts: 33,089
0
It shouldn't be stalling here...
JI
jimkane
Rep: 3,058
Posts: 33,089
0
Okay, it threw a small ABCD, and now it's got that 51. Now we see.
JI
jimkane
Rep: 3,058
Posts: 33,089
1
(Edited )
The key area is 53-55ish. If it got over that, it would be impressive. What it may do is come back off that in a 'W2', then up and over the 62 area, to 80. Personally, I'd prefer that area sends it to new lows, perhaps in a bigger ABCD, but we'll see what it does.