MyPivots
Forum
Daily Notes
Calculators
Pivot Point
Fibonacci
Market Profile
Gann Square of Nine
Day Trader Millionaire
Mortgage
All Investment Calculators
Glossary
More
Economic Events
Software
Articles
Help
Search...
Sign In
MyPivots
Search
Forum
Daily Notes
Calculators
Pivot Point
Fibonacci
Market Profile
Gann Square of Nine
Day Trader Millionaire
Mortgage
All Investment Calculators
Glossary
More
Economic Events
Software
Articles
Help
Sign In
All Forums
Private Forums
Kane Trading Group
Trading discussion, week of 5/10/10 - 5/14/10
JA
jarek
Rep: 94
Posts: 3,474
0
16 years ago
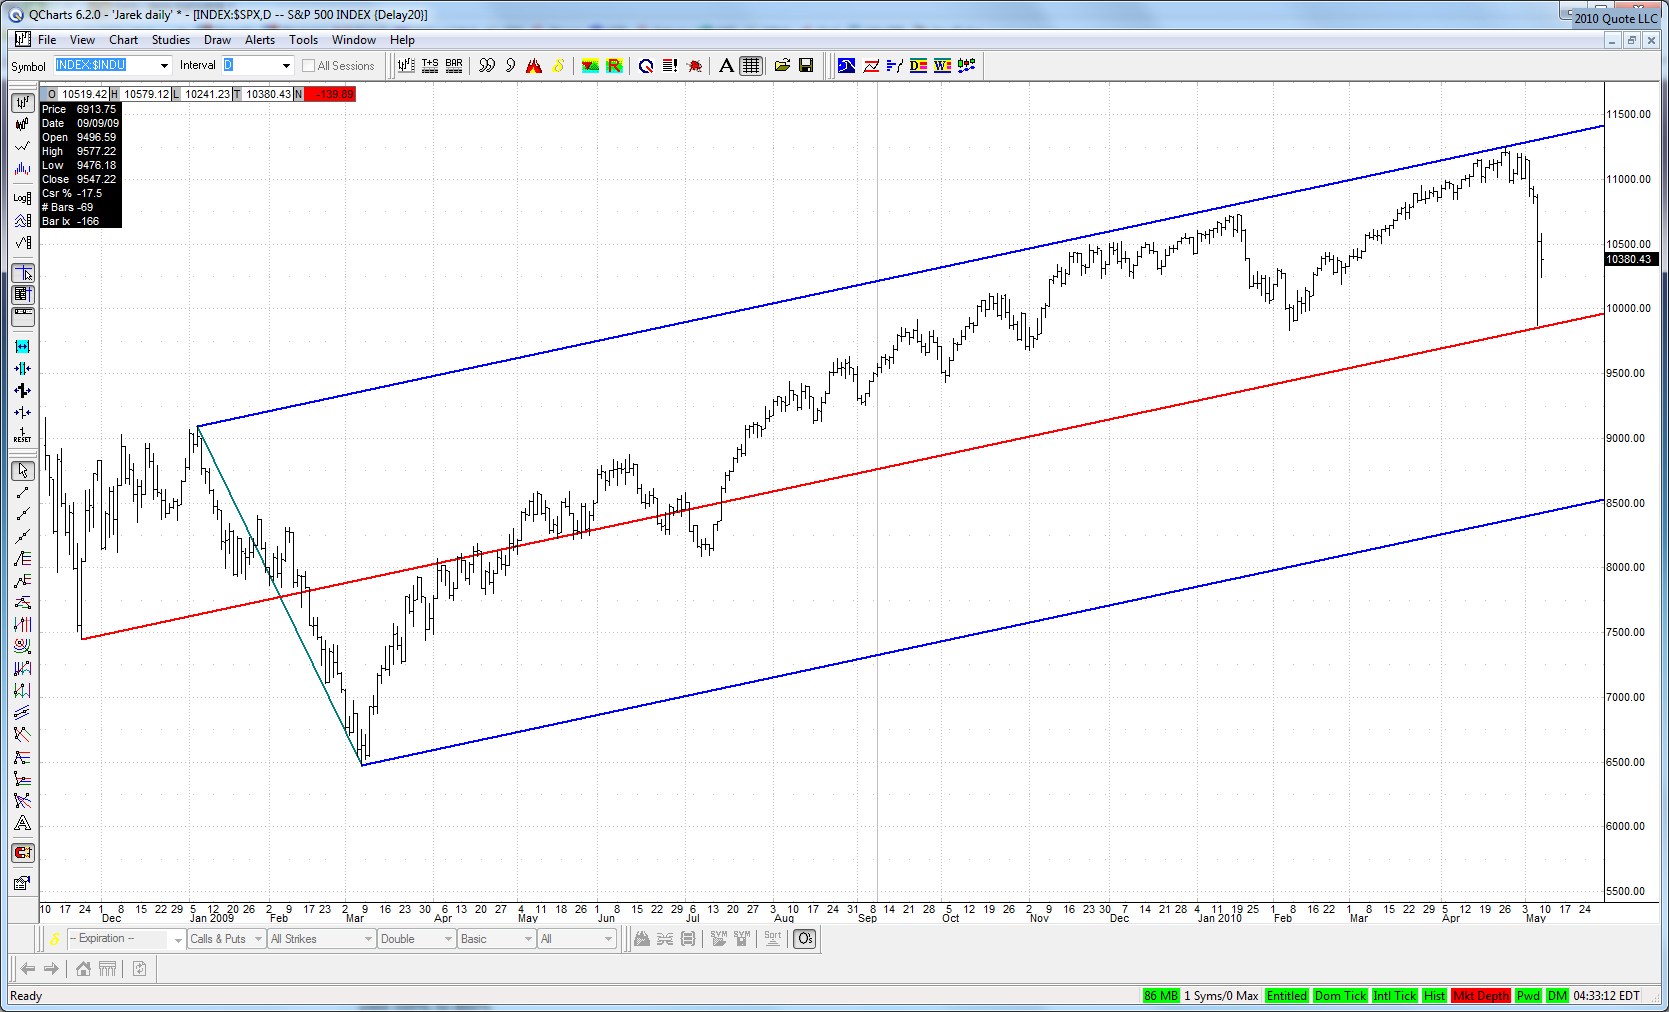
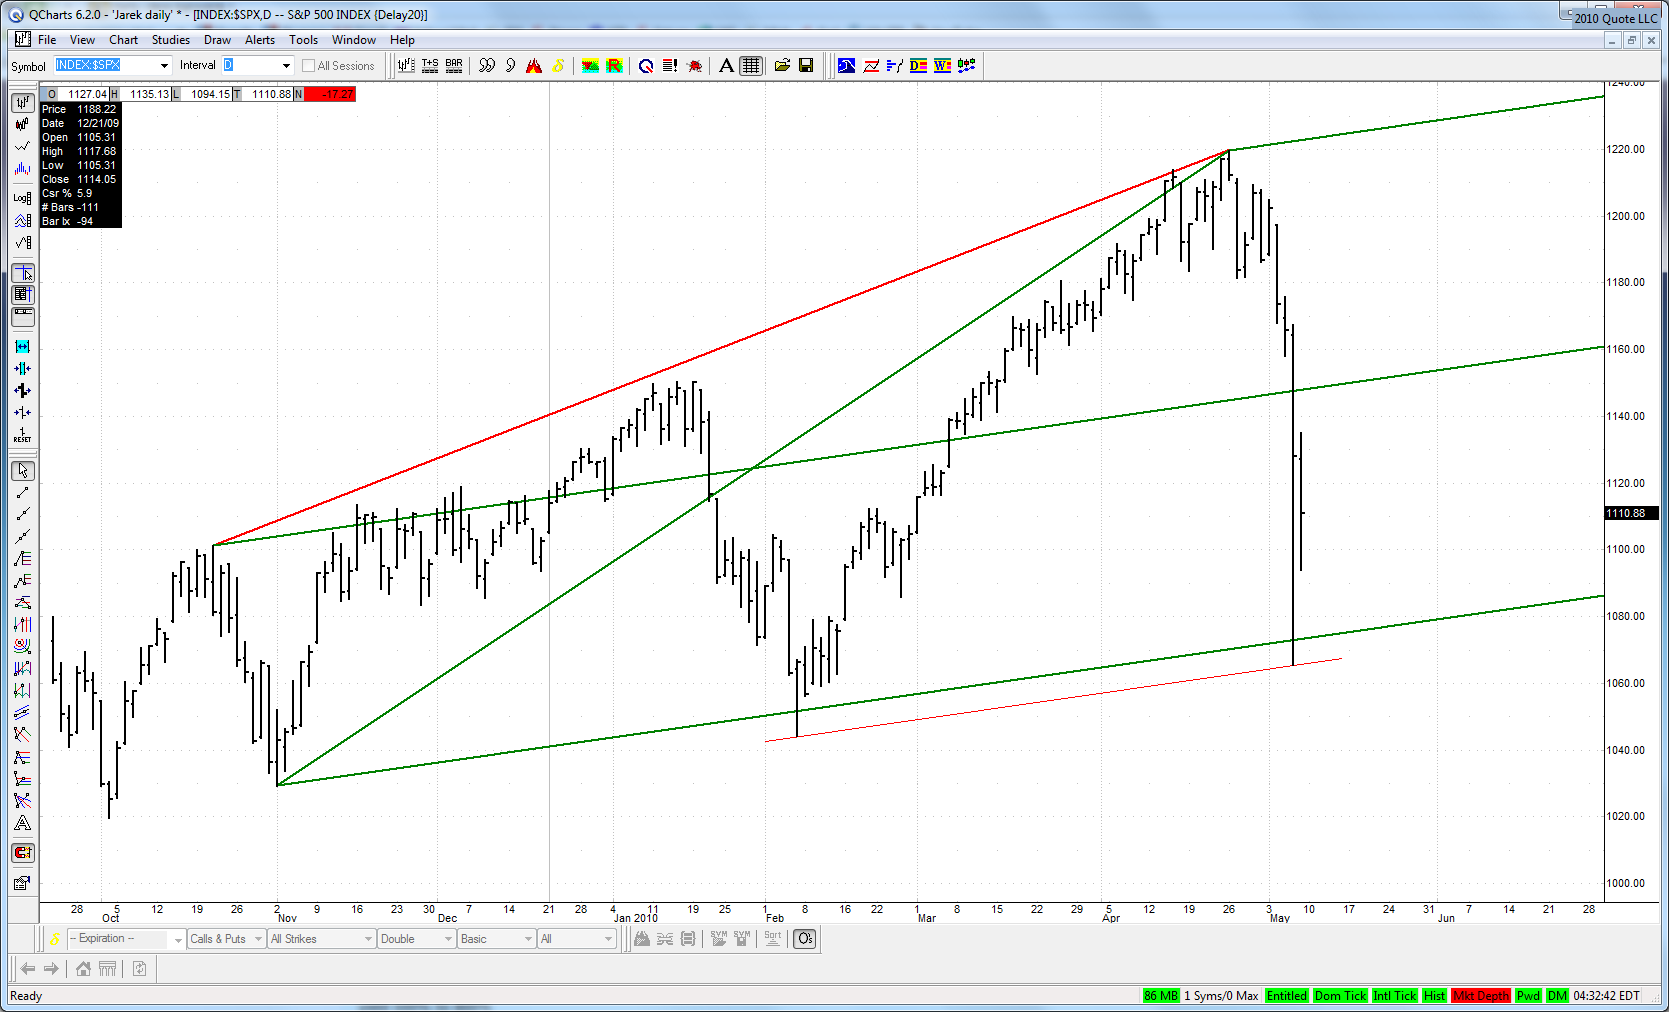
Here are two interesting long term charts of main indexes:
Click image for original size
Click image for original size
Isn't it amazing that what seemed to be a disorganized collapse reversed dramatically exactly where it should according to geometry??
Page(s):
1
2
3
4
5
6
7
8
JI
jimkane
Rep: 3,058
Posts: 33,089
0
16 years ago
Boink! :-)
JI
jimkane
Rep: 3,058
Posts: 33,089
0
16 years ago
Upper // and SL here.
ER
EricD
Rep: 63
Posts: 692
0
16 years ago
alot of air above.....
JI
jimkane
Rep: 3,058
Posts: 33,089
0
16 years ago
Yep, could push to 80 or 90 easy.
ER
EricD
Rep: 63
Posts: 692
0
16 years ago
yes i have some small fibs and lines at 69.75-77.75 basis 30 min.
JA
jarek
Rep: 94
Posts: 3,474
0
16 years ago
(Edited
16 years ago
)
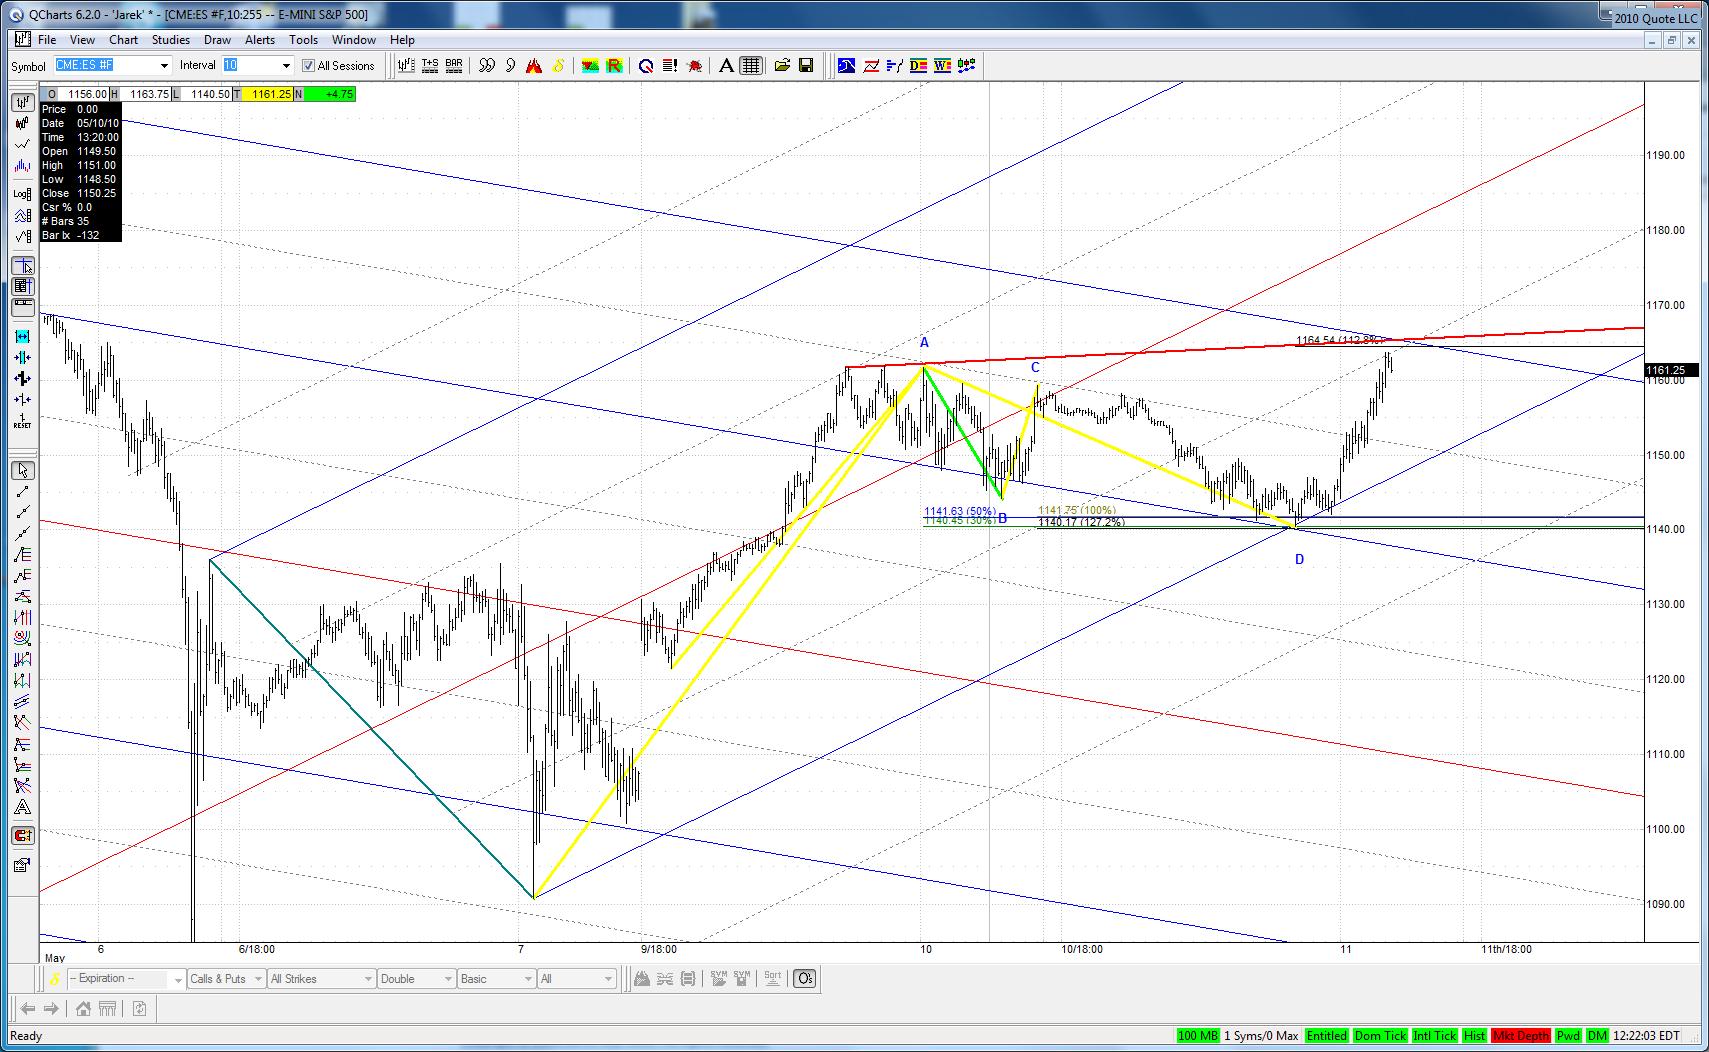
I have few lines just above HOD:
Click image for original size
ER
EricD
Rep: 63
Posts: 692
0
16 years ago
sorry ...69.75-71.75.......
JI
jimkane
Rep: 3,058
Posts: 33,089
0
16 years ago
Nice chart, jarek. That's surely something to watch, and it fits with the stop run from 62.
JI
jimkane
Rep: 3,058
Posts: 33,089
0
16 years ago
The audit the Fed amendment, once again, failed overwhelmingly. No surprise.
JA
jarek
Rep: 94
Posts: 3,474
0
16 years ago
Jim - wasn't this move off ABCD too long for a first move without a correction?
Page(s):
10
11
12
13
14
15
16
17
18
19
20
21
22
23
24
25
26
27
28
29
RO
roofer
Rep: 3,689
Posts: 3,574
1
16 years ago
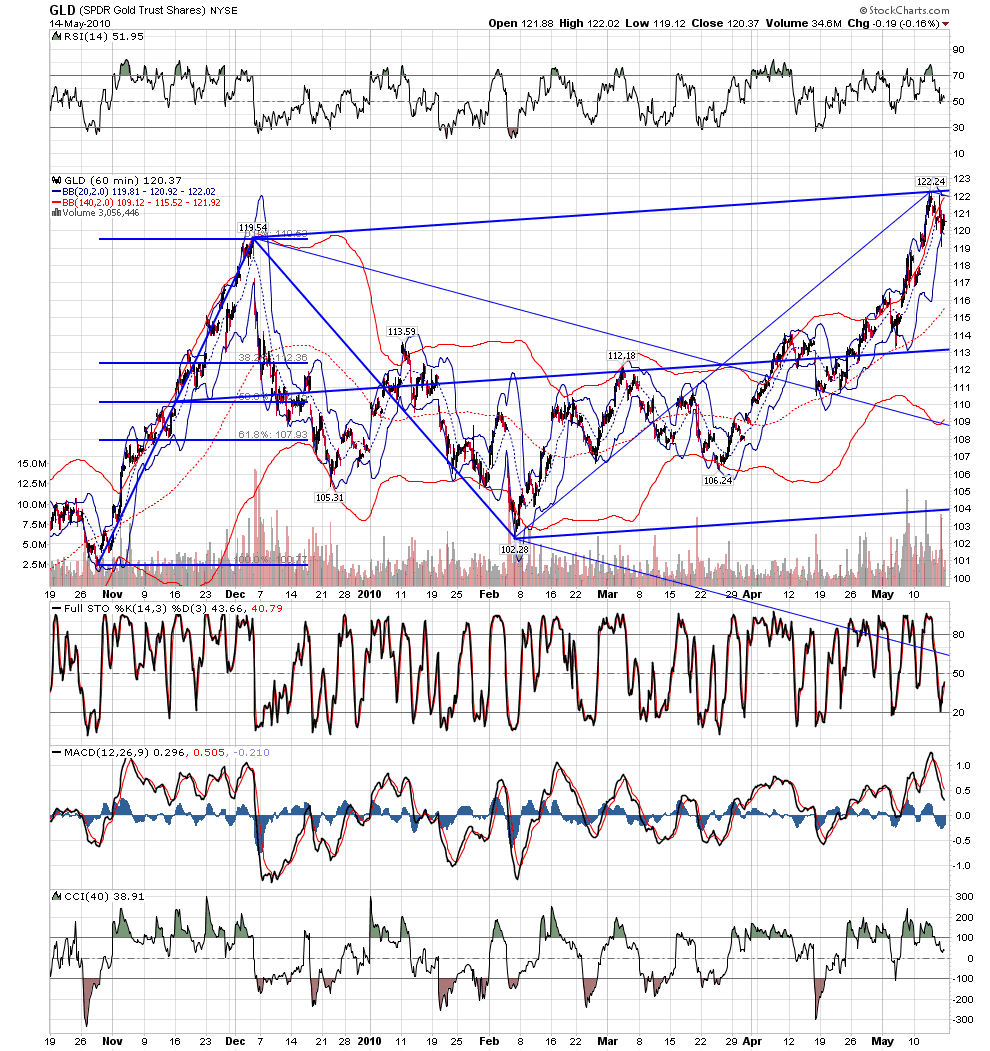
geometry...
Click image for original size
fyi, i took a portion of trade off at line from set... but i kept a portion on with wide stop equal to profit....we shall see...