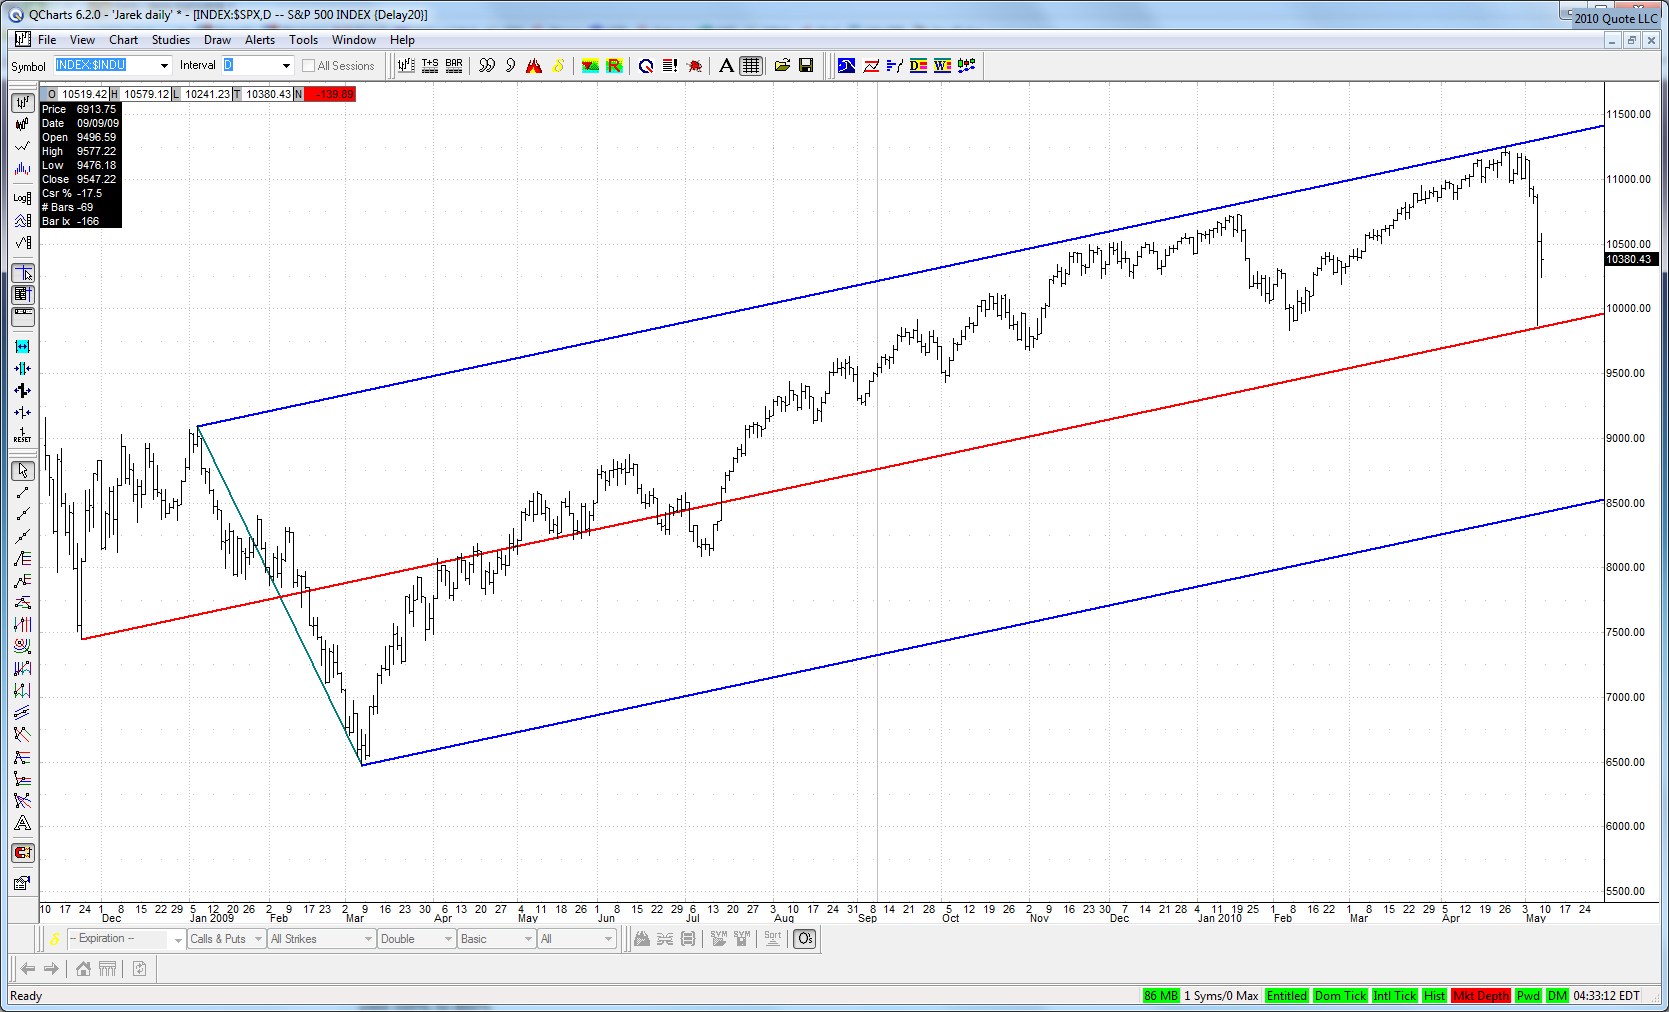
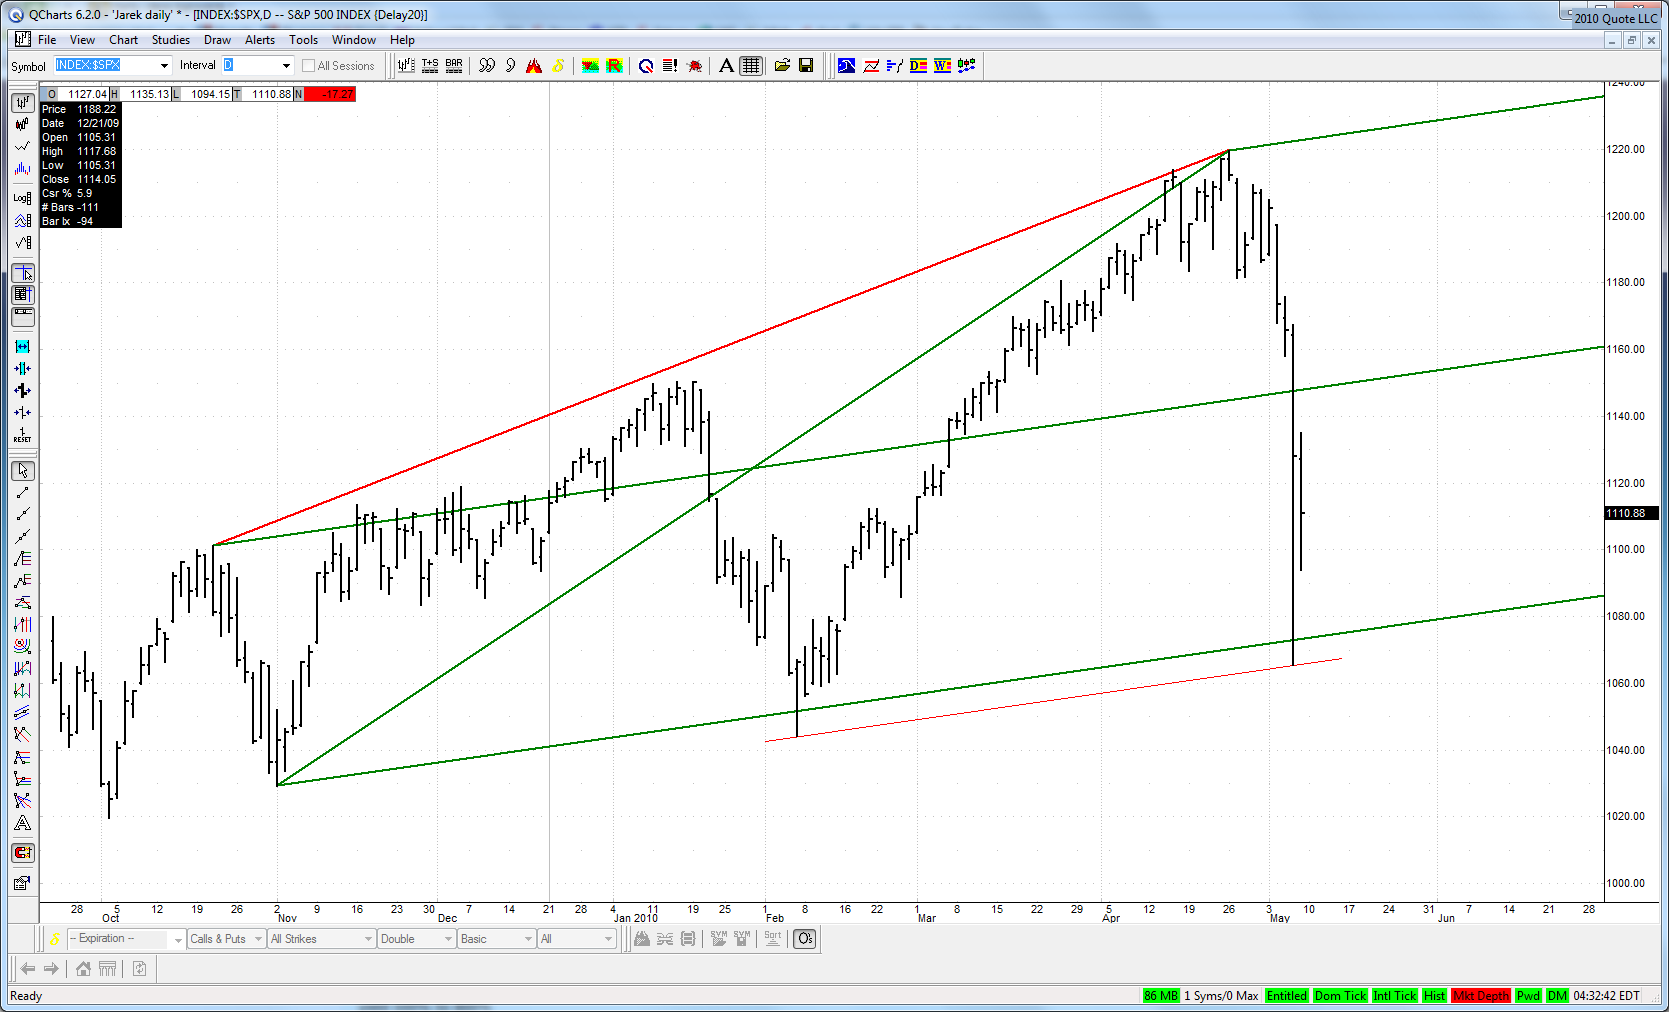
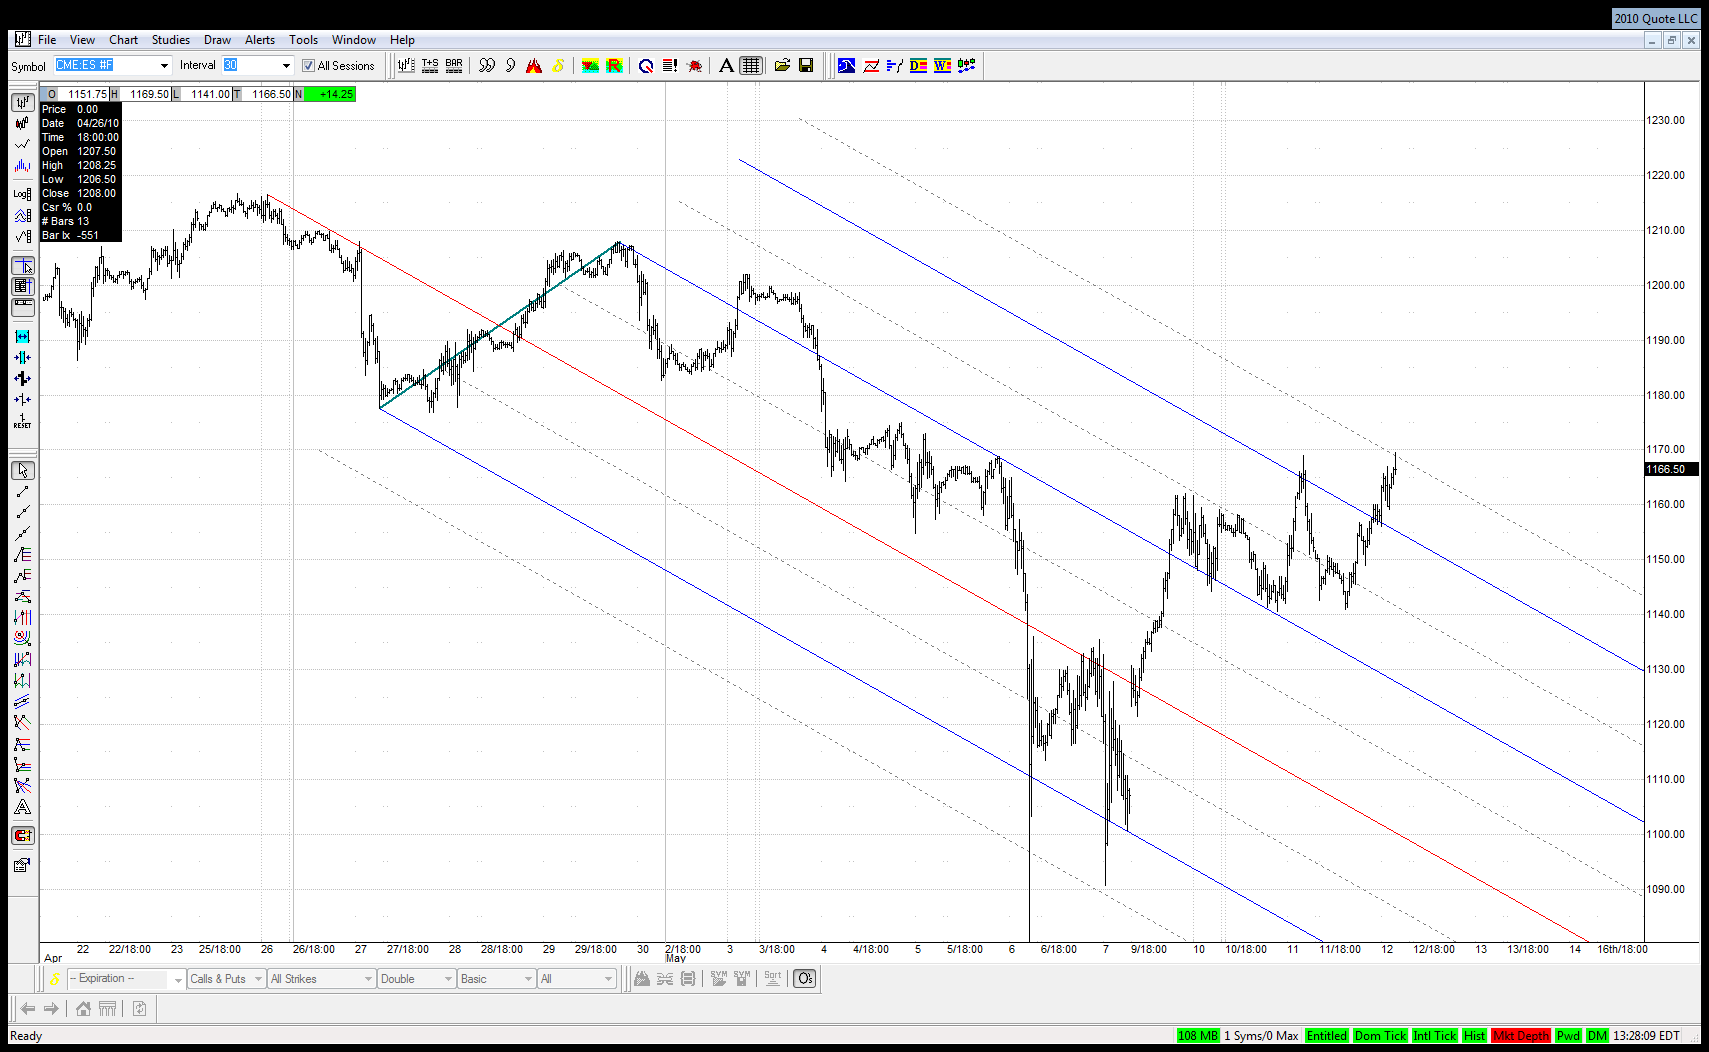
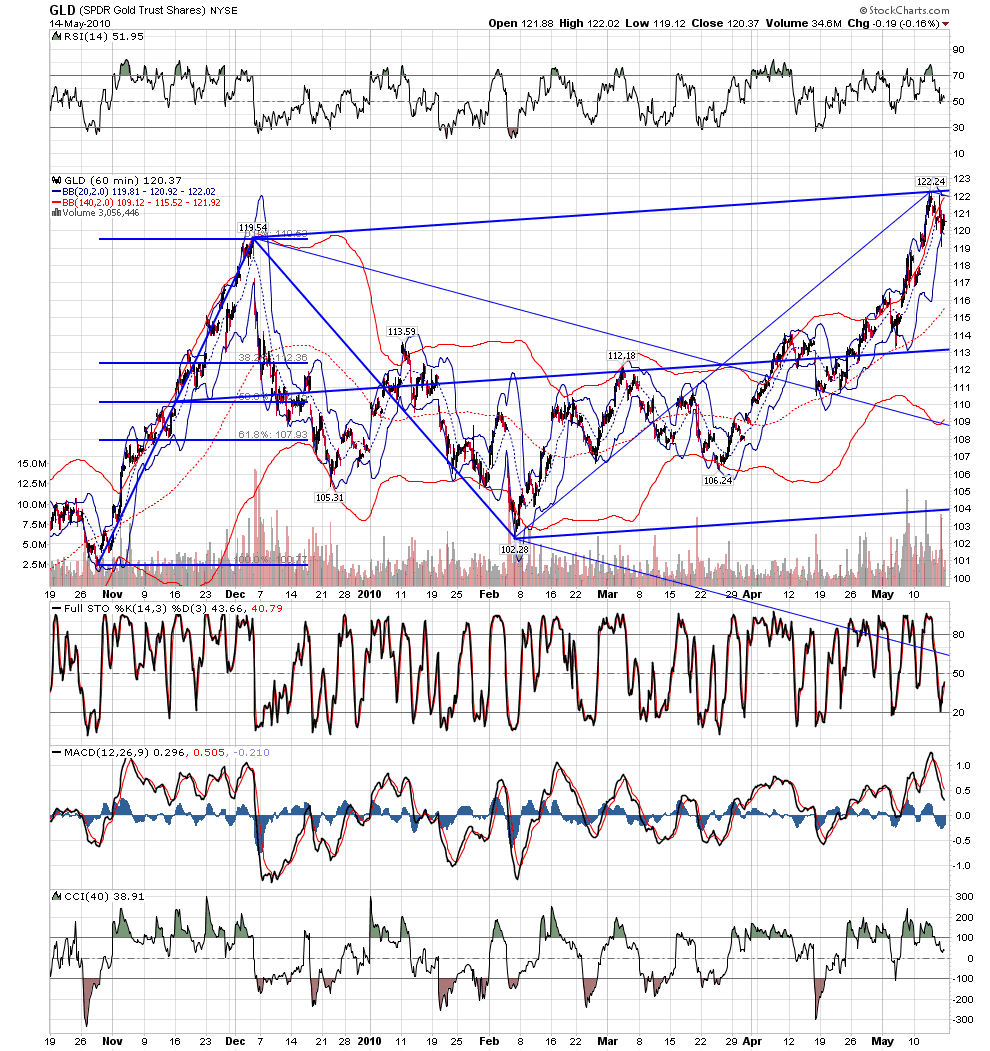
It also hit this downsloping \\ dead on before retreating. Looks like the frequencies of this set are important:
Click image for original size
JI
jimkane
Rep: 3,058
Posts: 33,089
1
Areas I have below are from 60 to 63, in layers. Do the work, they are clear. If it can even check back that much with such a strong bid in the market. I sure wish they'd crush it to dust here...
JI
jimkane
Rep: 3,058
Posts: 33,089
1
If this reaction off the 64.50 uppermost area I have follows through, that's an immense show of strength. Wow.
JI
jimkane
Rep: 3,058
Posts: 33,089
1
I didn't even mention that area at first because I didn't think falling shy of even a .786 ABCD would be enough for this.
JA
jarek
Rep: 94
Posts: 3,474
0
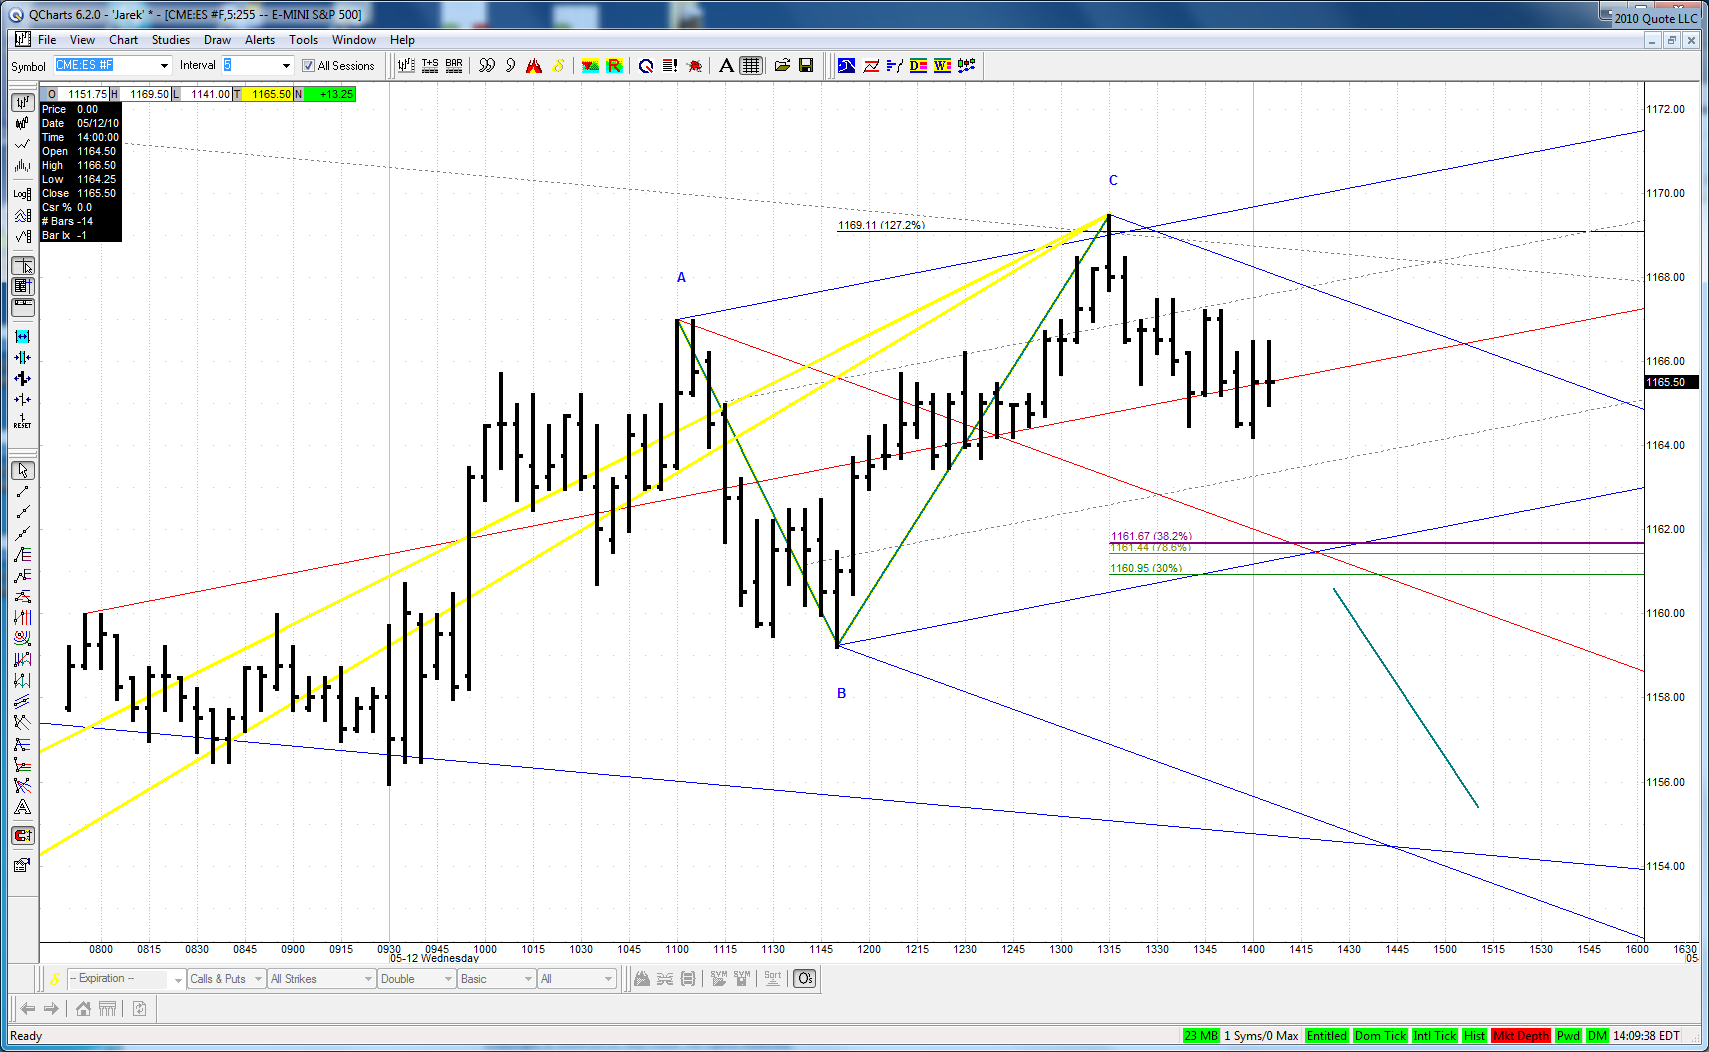
I have this area due in about 10 minutes:
Click image for original size
JI
jimkane
Rep: 3,058
Posts: 33,089
0
That's the basis for my lower layer.
JA
jarek
Rep: 94
Posts: 3,474
0
It doesn't behave like it was in W3 up. New HOD just by 1 tick and no follow through?
JA
jarek
Rep: 94
Posts: 3,474
0
In fact one could argue that there were 3 drives up. But I don't have the required area at the top ...