ES key numbers for 3-30-11
1300 - 1301.25 *** this is Tuesdays low and an area we have been watching recently that held. Volume spike at 1301.25 today.
1305.75 - 1307.00 - *****This is the value area low and a volume area that was created today. Also a Low volume area and some rejected that area quickly today. The opening range is in here too from Tuesday. Standard pivot formula S1 is in here.
1310.75 - 1311.75 ******* the big kahuna...we have the POC in here, volume spikes, and the standard pivot is in here. We also have a low volume area and the market moved away swiftly from the 1311.75. Any good shorts and buying failure will go back to this point. A big magnet that needs to be remembered even if it doesn't fill in on Wednesday. The opening range for the Week is also in this zone.
1315 - 1315.50 - *****This is Monday's High and the 4PM close sits here from Tuesday. Value area high is here too.
1320-1322.50 - we have multiple tops here and the R1 level sits up there.....monitor for poor volume and lack of follow through on any breach of that area
There are no 10 a.m reports on Wednesday but a few before 8:30 in the morning. This was some what of a trend today so it should be a better day tomorrow to buy into breaks and sell rallies early in the session. I prefer the sell side but not on declines.
R2 is 1329 today so lets not fool ourselves into what an upper objective might be ....that also falls 5 points above the O/N high... a common shakeout point
As well as being roughly the 10pt target range from the low of 1319.25.
Originally posted by BruceM
R2 is 1329 today so lets not fool ourselves into what an upper objective might be ....that also falls 5 points above the O/N high... a common shakeout point
BruceM,
1. Re IB data. I believe that in fast markets IB data lacks precision. But in slow markets it maybe OK, especially when dealing with orders that are different inmagnitude. I would like to test another data source.
2. Re big red accumulations. I believe that those show big short orders, especially at significant numbers. Not necesserily one big order, but could be several smaller orders by the same party at this price. Thus accumulation at price.
1327 was a previous high on date 3/1/2011). That was where big guys created BIG red bar on daily chart. So I expect that there are some residual orders (or big order remnants). I also expect that many traders see it and would short there - I also see those big orders. So I hop on, and put my stop close.
I also believe that traders those who originally shorted at 1327 have their stops at 1309 (2-point stop or so). So if some big guys decide to "PrepH" them (and us, small traders) they would bounce it there and take the stops. My stop is very small, so I will take it and later will try to re-short at 1329, if I see a confirmation ot my thinking.
It is also possible that those original "big shorts" on March 1 would meet a bigger buyer, the party who pushed this market higher all day today, into the major resistance, and in spite of big odds, like housing, Japan, Mid-East, etc.
So I took a short with "Mr. Big Wig" at 1327 and placed my stop and monitor what develops.
That is my train of thoughts. To summarize: I enter with Mr. Big Wig and monitor wether can follow through or he is "PrepH-ed". Mr. BigWig takes small stops, so will I. Hope that helps, if not - please ask more.
Originally posted by BruceM
I guess for me Lisa the only benefit of firing up my Delta charts is seeing the Exact price where the big volume is but I can usually see that on my one minute data...
So how specifically are you using a big RED delta bars at the highs ...? sometimes they signal shorts and sometimes long...I want to distill the core concepts which tilt the odds in my favor in regards to delta
Without us having exact data, our skype conversation would be a waste as far as Delta is concerned because our data doesn't match but we can talk about the other stuff you wanted to still...
Sorry took short at 1326 with Mr Big Wig
A look at where we are with CD. Divergence here at the recent high. LVN there at 24.75
Click image for original size
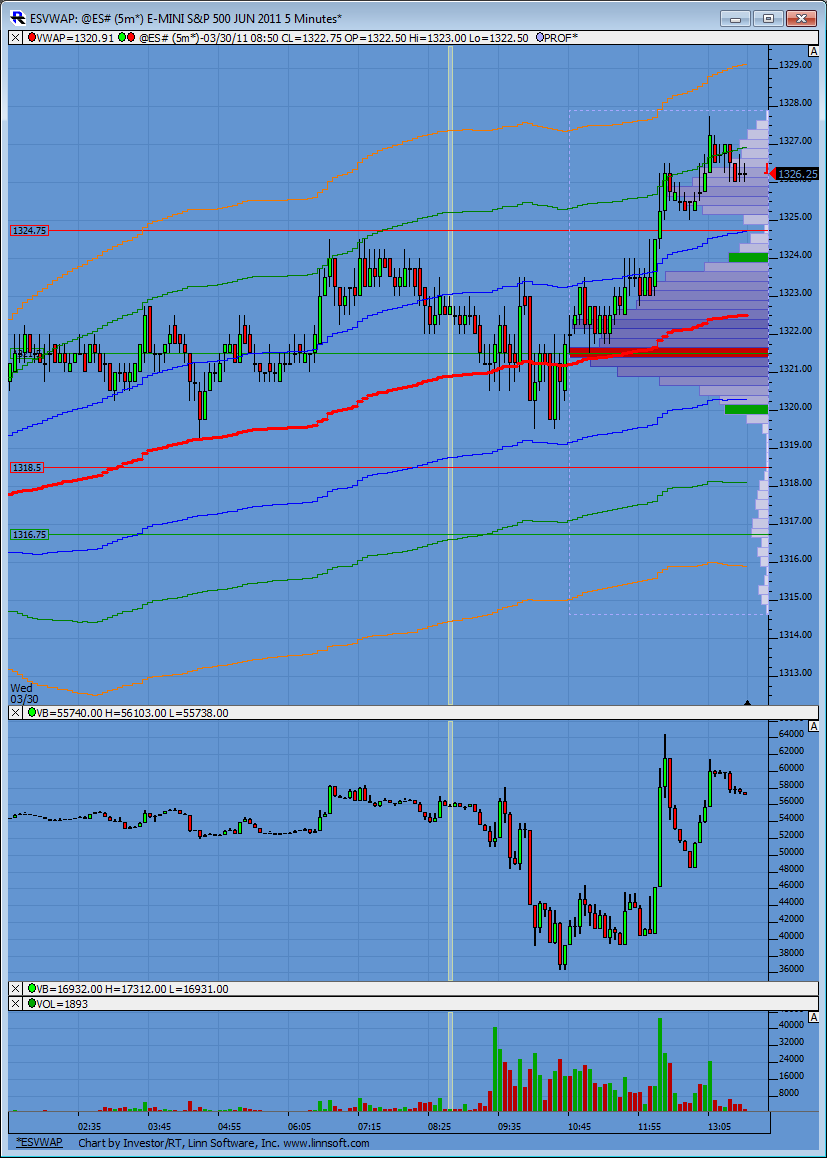
so it's safe to say that there are lots of numbers up here in the 27 - 29.50 area....sounds good to me..I want a 25.50 print as that will be the retest of the 30 minute bar low I'm watching...and right into a peak volume area...
Originally posted by Lorn
As well as being roughly the 10pt target range from the low of 1319.25.
Originally posted by BruceM
R2 is 1329 today so lets not fool ourselves into what an upper objective might be ....that also falls 5 points above the O/N high... a common shakeout point
how does CD compare with the march 1st high Lisa mentioned Lorn....do u have data back that far for CD ??
I don't have that much CD loaded right now. I can download the data after hours and let you see what it looks like.
Originally posted by BruceM
how does CD compare with the march 1st high Lisa mentioned Lorn....do u have data back that far for CD ??
back... and watching... as indicated early in the day.. odds favored no gap fill and trend up... i just wonder if we stop at that 1328.50-1329.25 or not...
I see it now, Kool. Thanks
Emini Day Trading /
Daily Notes /
Forecast /
Economic Events /
Search /
Terms and Conditions /
Disclaimer /
Books /
Online Books /
Site Map /
Contact /
Privacy Policy /
Links /
About /
Day Trading Forum /
Investment Calculators /
Pivot Point Calculator /
Market Profile Generator /
Fibonacci Calculator /
Mailing List /
Advertise Here /
Articles /
Financial Terms /
Brokers /
Software /
Holidays /
Stock Split Calendar /
Mortgage Calculator /
Donate
Copyright © 2004-2023, MyPivots. All rights reserved.
Copyright © 2004-2023, MyPivots. All rights reserved.