ES key numbers for 3-30-11
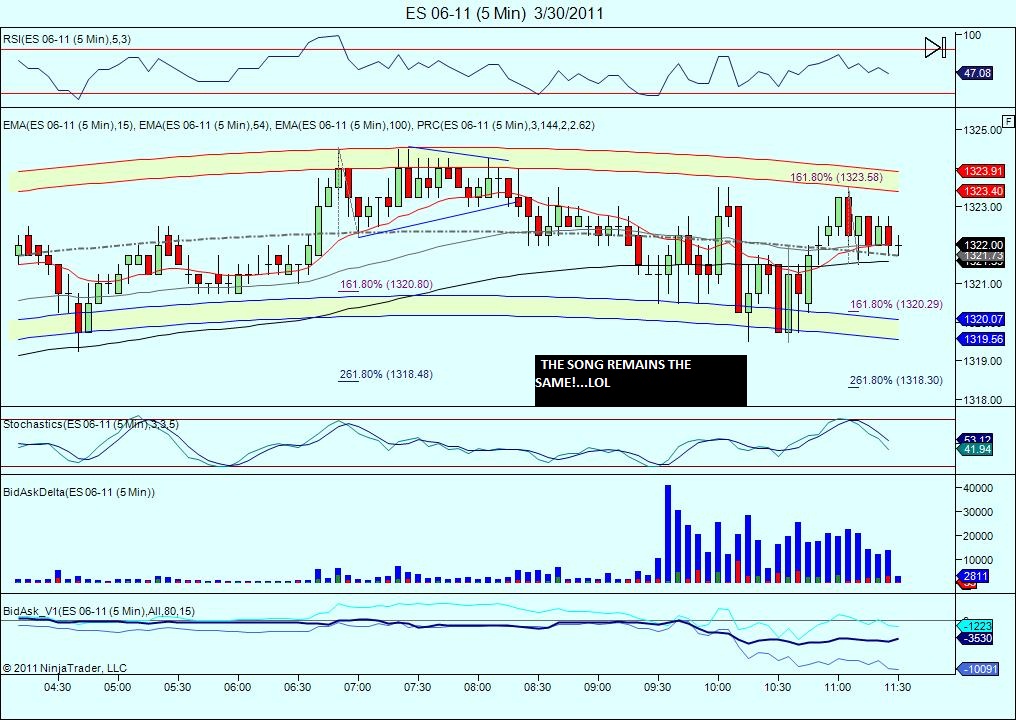
1300 - 1301.25 *** this is Tuesdays low and an area we have been watching recently that held. Volume spike at 1301.25 today.
1305.75 - 1307.00 - *****This is the value area low and a volume area that was created today. Also a Low volume area and some rejected that area quickly today. The opening range is in here too from Tuesday. Standard pivot formula S1 is in here.
1310.75 - 1311.75 ******* the big kahuna...we have the POC in here, volume spikes, and the standard pivot is in here. We also have a low volume area and the market moved away swiftly from the 1311.75. Any good shorts and buying failure will go back to this point. A big magnet that needs to be remembered even if it doesn't fill in on Wednesday. The opening range for the Week is also in this zone.
1315 - 1315.50 - *****This is Monday's High and the 4PM close sits here from Tuesday. Value area high is here too.
1320-1322.50 - we have multiple tops here and the R1 level sits up there.....monitor for poor volume and lack of follow through on any breach of that area
There are no 10 a.m reports on Wednesday but a few before 8:30 in the morning. This was some what of a trend today so it should be a better day tomorrow to buy into breaks and sell rallies early in the session. I prefer the sell side but not on declines.
BruceM and others, maybe I should stop posting my footprint charts. Let me know please. Thanks
Ulternatively, maybe our charts are set differently. Who shall I contact to compare the settings? Lorn? PT? Please let me know guys.
Ulternatively, maybe our charts are set differently. Who shall I contact to compare the settings? Lorn? PT? Please let me know guys.
appreciate your time...going back to study some now...thanks a lot folks, see you soon
Originally posted by koolblue
Originally posted by aynyes, correct.. i think your getting the basics!... but be advised, newer folk, and even me sometimes, can get carried away with looking at every single little bitty projection!, dont lose sight of the bigger scenerio(ie: the 5 and 13 min charts for example) to frame your opinions and trades! for example, im really pretty bullish here, looking for 1328.50-1329.25 later! thats why i would love to buy 1319 or below!!!
thanks for your time kool...so basically you draw first the minimum projection to have sthg to work with and then adjust to the full projection accordingly...am i right? and the min. proj comes if there is a significant retracement on the 2nd bar (relative to bar carry the low/hig) ?
Click image for original size
after adding positions @19.50 to my 22 buy, i averaged 20.75 i am out at 23.00 and will regroup. thanks for the explanation on your trading style kool... always good stuff see everyone tomorrow
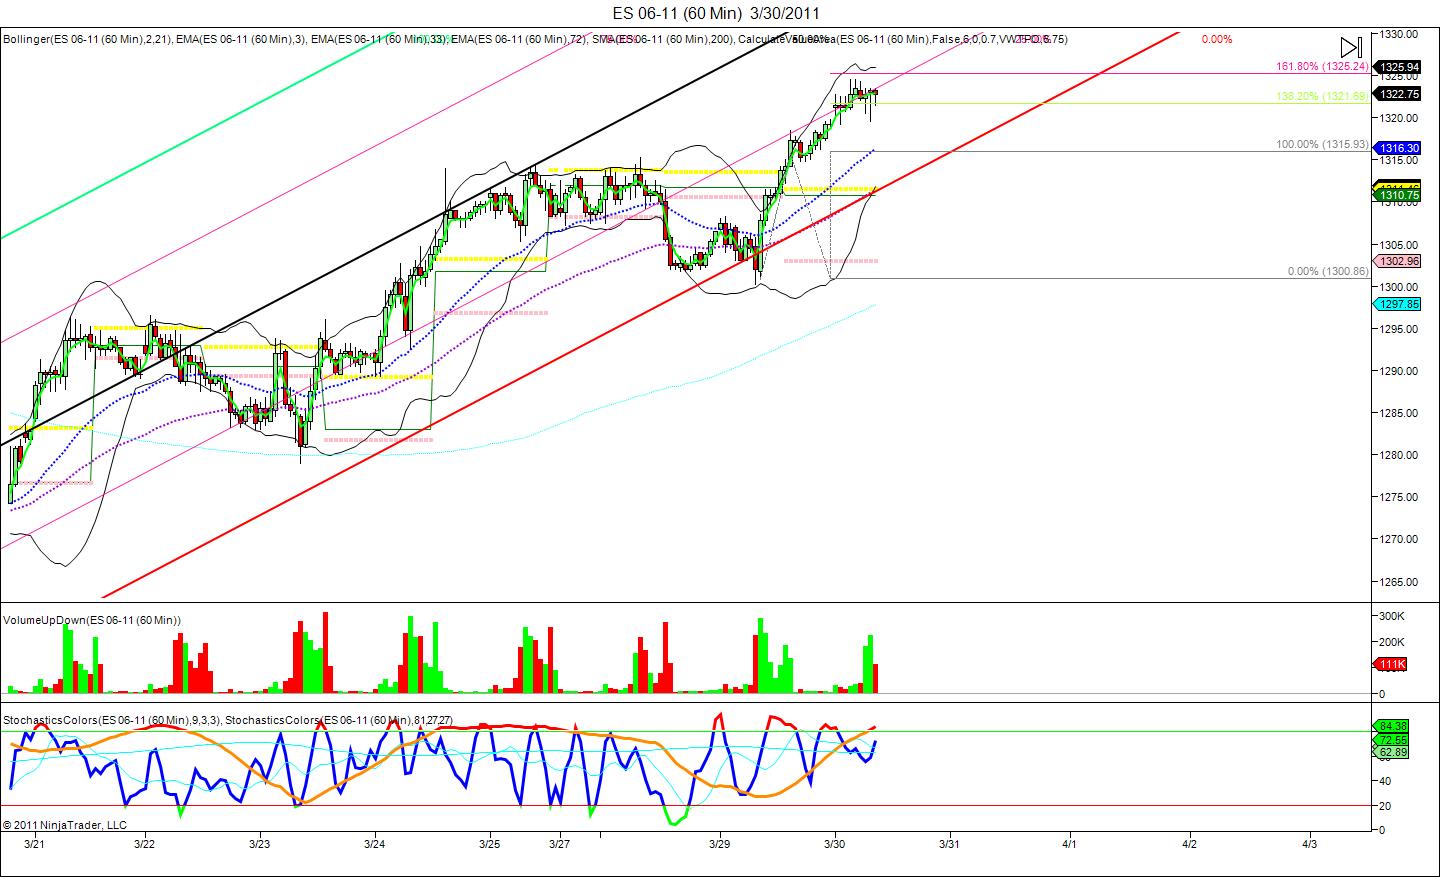
by the way.. here is my 60 min chart showing the 1.618 projection at 25.. we will probably get some kind of pullback today or tomorrow. price has traveled a little to far off the 200 ma. 1316 and 1311.75 is where my sights are on any significant move down at this time
Click image for original size
Finally got a bigger green bar than the last few red bars! Now maybe they can begin to push it up to 1326.00 and later 1328.50-1329.25
selling into the hour high break....hoigher risk on a gap up as Value is being created higher from yesterday...but volume and Ticks diverging up here
i'll try a scalp buy at 1322.25
have to leave for a bit
last try on shorts from 26 even
I see it now, Kool. Thanks
Emini Day Trading /
Daily Notes /
Forecast /
Economic Events /
Search /
Terms and Conditions /
Disclaimer /
Books /
Online Books /
Site Map /
Contact /
Privacy Policy /
Links /
About /
Day Trading Forum /
Investment Calculators /
Pivot Point Calculator /
Market Profile Generator /
Fibonacci Calculator /
Mailing List /
Advertise Here /
Articles /
Financial Terms /
Brokers /
Software /
Holidays /
Stock Split Calendar /
Mortgage Calculator /
Donate
Copyright © 2004-2023, MyPivots. All rights reserved.
Copyright © 2004-2023, MyPivots. All rights reserved.