ES key numbers for 3-30-11
1300 - 1301.25 *** this is Tuesdays low and an area we have been watching recently that held. Volume spike at 1301.25 today.
1305.75 - 1307.00 - *****This is the value area low and a volume area that was created today. Also a Low volume area and some rejected that area quickly today. The opening range is in here too from Tuesday. Standard pivot formula S1 is in here.
1310.75 - 1311.75 ******* the big kahuna...we have the POC in here, volume spikes, and the standard pivot is in here. We also have a low volume area and the market moved away swiftly from the 1311.75. Any good shorts and buying failure will go back to this point. A big magnet that needs to be remembered even if it doesn't fill in on Wednesday. The opening range for the Week is also in this zone.
1315 - 1315.50 - *****This is Monday's High and the 4PM close sits here from Tuesday. Value area high is here too.
1320-1322.50 - we have multiple tops here and the R1 level sits up there.....monitor for poor volume and lack of follow through on any breach of that area
There are no 10 a.m reports on Wednesday but a few before 8:30 in the morning. This was some what of a trend today so it should be a better day tomorrow to buy into breaks and sell rallies early in the session. I prefer the sell side but not on declines.
now the doubt i have is would the touch of 19.5 at 10:30 invalidate that previous projection ?
[/quote]
Originally posted by koolblue
Ayn, remember the one min projection?
[/quote]
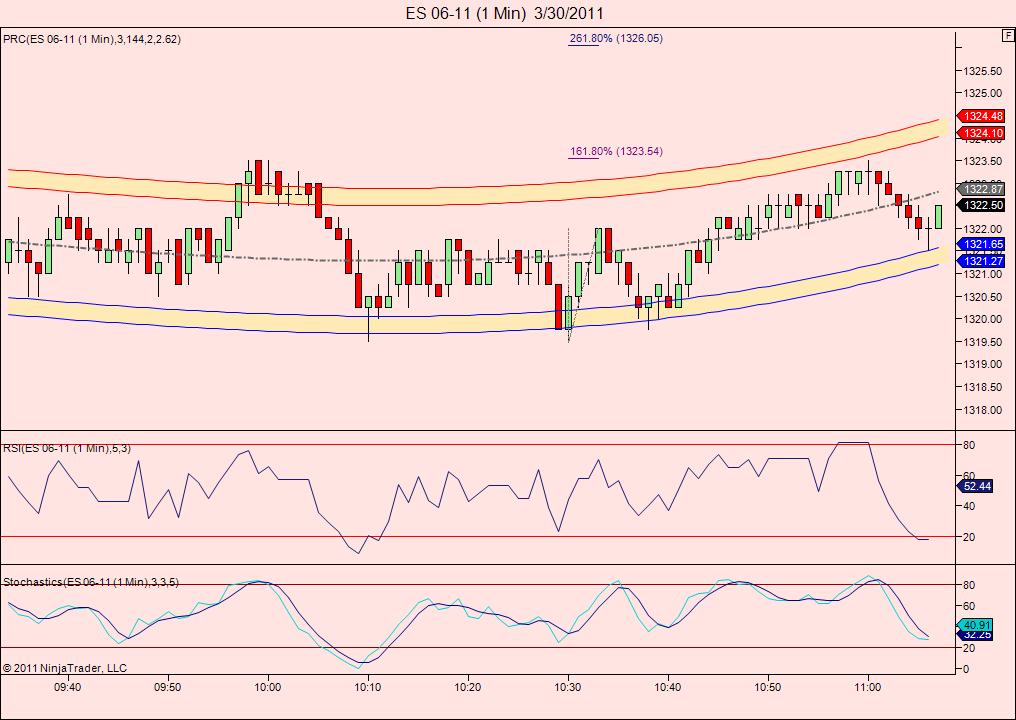
you mean the projection to 1318.50?.. NO it would have to touch where the start point of the projection was 1324.50. If you mean the 1322.75 proj , technically yes ,since the start point was the first touch of 1319.50,and as you see i just got stopped out..ugh! now i would look at the entire move one min proj from 1319.50 to 1321.75(first touch of 1319.50) or 1319.50 to 1322.00(2nd touch) thats why i hate double bottoms! the 1318.50 remauins possible however untill 1324.50 is touched!
just for the record I compared two different Feeds last night .....the Zenfire from PT and the DTN data from lorn....the delta charts were exactly the same....
The Ib data that Lisa and I have was not only very different from each other but also very different from Lorn and PT's...
so I don't trust IB footprints any longer
The Ib data that Lisa and I have was not only very different from each other but also very different from Lorn and PT's...
so I don't trust IB footprints any longer
starting new shorts at 23 even...will watch a 30 minute close above O/N high as a possible exit filter
got it, thank you !
Originally posted by koolblue
you mean the projection to 1318.50?.. NO it would have to touch where the start point of the projection was 1324.50. If you mean the 1322.75 proj , technically yes ,since the start point was the first touch of 1319.50,and as you see i just got stopped out..ugh! now i would look at the entire move one min proj from 1319.50 to 1321.75(first touch of 1319.50) or 1319.50 to 1322.00(2nd touch) thats why i hate double bottoms! the 1318.50 remauins possible however untill 1324.50 is touched!
tricky spot as the 60 minute high or low hasn;t been run out yet....
got 21.75 as that is midpoint of the day.....holding three and don't want it to come back up now....double highs and lows.....
interesting structure....
interesting structure....
AYN SEE HOW NOW I HAVE DRAWN THE FULL MOVE(2ND TOUCH) because its the bigger projection!... id rather err on the side of being to cautious! if i had been studying in stead of posting so much, i probably would have had my stop a little above 1323.50.. but hindsights always best ,isnt it/lol.. flat now and watching
Click image for original size
thanks for your time kool...so basically you draw first the minimum projection to have sthg to work with and then adjust to the full projection accordingly...am i right? and the min. proj comes if there is a significant retracement on the 2nd bar (relative to bar carry the low/hig) ?
Originally posted by aynyes, correct.. i think your getting the basics!... but be advised, newer folk, and even me sometimes, can get carried away with looking at every single little bitty projection!, dont lose sight of the bigger scenerio(ie: the 5 and 13 min charts for example) to frame your opinions and trades! for example, im really pretty bullish here, looking for 1328.50-1329.25 later! thats why i would love to buy 1319 or below!!!
thanks for your time kool...so basically you draw first the minimum projection to have sthg to work with and then adjust to the full projection accordingly...am i right? and the min. proj comes if there is a significant retracement on the 2nd bar (relative to bar carry the low/hig) ?
I see it now, Kool. Thanks
Emini Day Trading /
Daily Notes /
Forecast /
Economic Events /
Search /
Terms and Conditions /
Disclaimer /
Books /
Online Books /
Site Map /
Contact /
Privacy Policy /
Links /
About /
Day Trading Forum /
Investment Calculators /
Pivot Point Calculator /
Market Profile Generator /
Fibonacci Calculator /
Mailing List /
Advertise Here /
Articles /
Financial Terms /
Brokers /
Software /
Holidays /
Stock Split Calendar /
Mortgage Calculator /
Donate
Copyright © 2004-2023, MyPivots. All rights reserved.
Copyright © 2004-2023, MyPivots. All rights reserved.