ES key numbers for 3-30-11
1300 - 1301.25 *** this is Tuesdays low and an area we have been watching recently that held. Volume spike at 1301.25 today.
1305.75 - 1307.00 - *****This is the value area low and a volume area that was created today. Also a Low volume area and some rejected that area quickly today. The opening range is in here too from Tuesday. Standard pivot formula S1 is in here.
1310.75 - 1311.75 ******* the big kahuna...we have the POC in here, volume spikes, and the standard pivot is in here. We also have a low volume area and the market moved away swiftly from the 1311.75. Any good shorts and buying failure will go back to this point. A big magnet that needs to be remembered even if it doesn't fill in on Wednesday. The opening range for the Week is also in this zone.
1315 - 1315.50 - *****This is Monday's High and the 4PM close sits here from Tuesday. Value area high is here too.
1320-1322.50 - we have multiple tops here and the R1 level sits up there.....monitor for poor volume and lack of follow through on any breach of that area
There are no 10 a.m reports on Wednesday but a few before 8:30 in the morning. This was some what of a trend today so it should be a better day tomorrow to buy into breaks and sell rallies early in the session. I prefer the sell side but not on declines.
the point on all that is we can't get too greedy as so much back and fill happens on these days and no reports to inspire a true and easy trend ....in any particular direction
Is this what you are looking for Paul?
Click image for original size
Originally posted by PAUL9
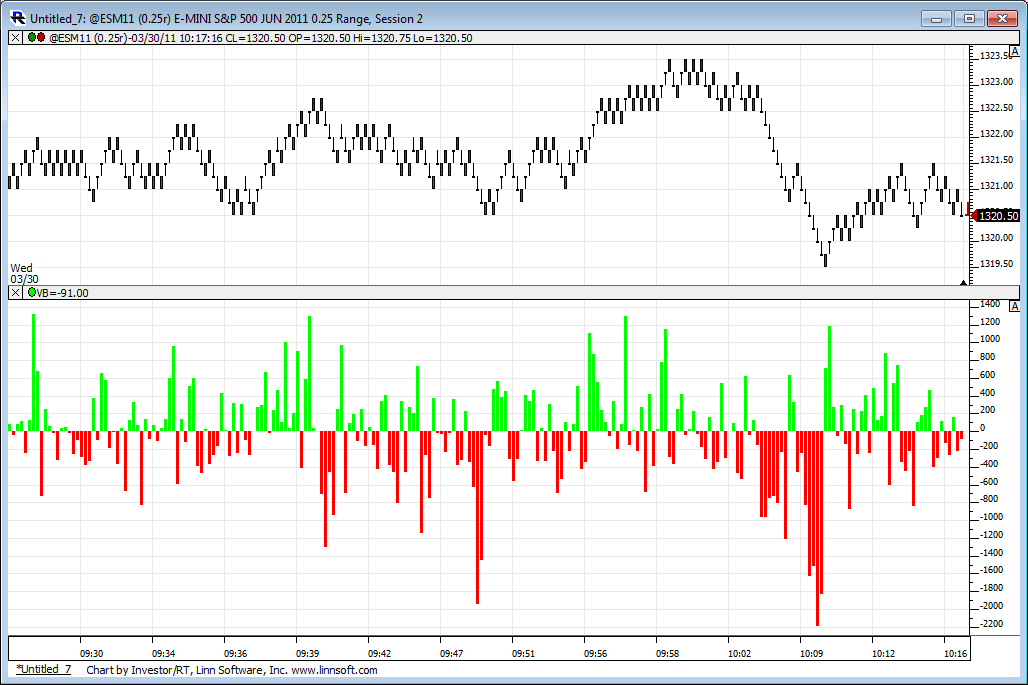
Is it possible for someone to post a chart of the net delta on those 5 tick range bars so I can see what it looked like near the early RTH High? Please.
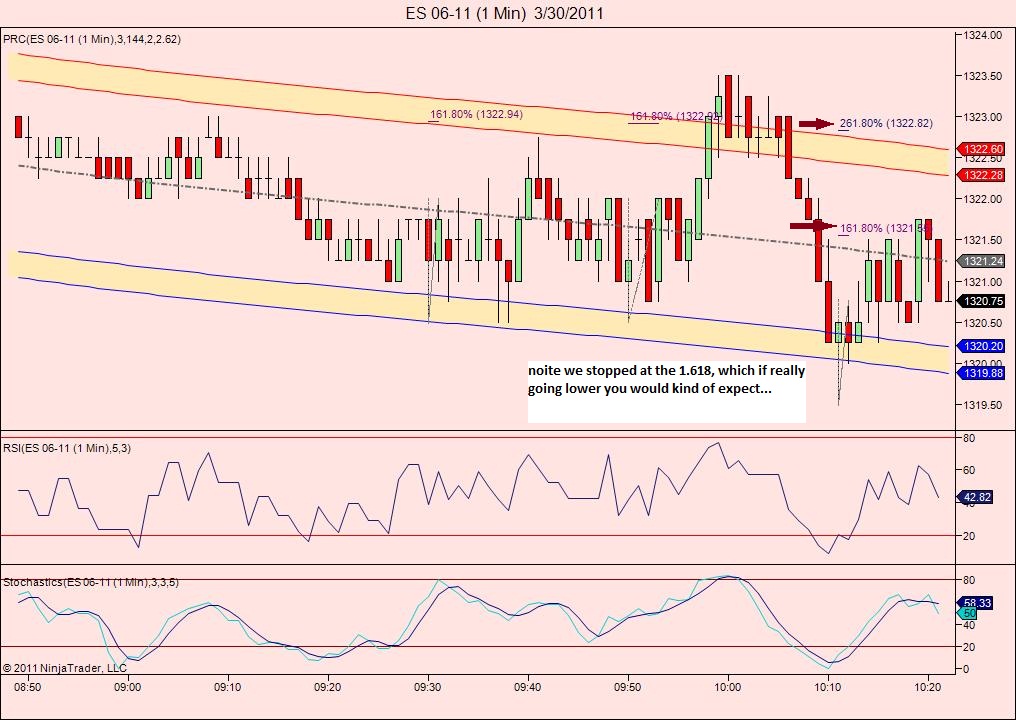
Originally posted by koolblue...right now for instance you see the bottom at 1319.50? next one min bar is 1320.75 so the minimum rebound would be expected to be around 1322.75... my stop on the runner is at 1323.25 now...
Originally posted by aynONE MIN CHART THE INITIAL MOVE AT ABOUT 9:50 FROM 1320.50 TO 1322.75 GIVES 2.618=1323.75 AND THE VERY FIRST TOUCH OF 1320.50 AT ABOUT 9:30 GAVE 1323.00, SO I MADE A GOOD GUESS....
hey koolblue, how did you come up with 23.25? what projection where you using ? many thanks ! trying to follow your system actively over the past few months...
Originally posted by koolblue
very bullish market that wants 1329.25, but i am now short from 1323.25...
thanks kool, huge fan of yours...i guess you meant 1.618, but i got it...thanks again
Originally posted by koolblue
Originally posted by aynONE MIN CHART THE INITIAL MOVE AT ABOUT 9:50 FROM 1320.50 TO 1322.75 GIVES 2.618=1323.75 AND THE VERY FIRST TOUCH OF 1320.50 AT ABOUT 9:30 GAVE 1323.00, SO I MADE A GOOD GUESS....
hey koolblue, how did you come up with 23.25? what projection where you using ? many thanks ! trying to follow your system actively over the past few months...
Originally posted by koolblue
very bullish market that wants 1329.25, but i am now short from 1323.25...
Originally posted by apk781
thanks kool, huge fan of yours...i guess you meant 1.618, but i got it...thanks again
Originally posted by koolblue...yeah! sorry!...
Originally posted by aynONE MIN CHART THE INITIAL MOVE AT ABOUT 9:50 FROM 1320.50 TO 1322.75 GIVES 2.618=1323.75 AND THE VERY FIRST TOUCH OF 1320.50 AT ABOUT 9:30 GAVE 1323.00, SO I MADE A GOOD GUESS....
hey koolblue, how did you come up with 23.25? what projection where you using ? many thanks ! trying to follow your system actively over the past few months...
Originally posted by koolblue
very bullish market that wants 1329.25, but i am now short from 1323.25...
Click image for original size
Thanks for posting, Lorn, But no, I was curious to see one of those 5 tick range bar charts with the net of trades "at bid" (reddish) and trades "at ask" (shades of green) in the little boxes at each tick level.
Years ago I tried to incorporate delta in my view of the markets but I just didn't have anything jell. Now I am trying to understand it again.
Years ago I tried to incorporate delta in my view of the markets but I just didn't have anything jell. Now I am trying to understand it again.
Looks like mr. James Dalton and i are in agereement again!..."The three day high at the 1317 level is your downside reference as the market is expected to gap higher; your early focus is on any attempt to fill the gap. Overnight inventory is very long, which adds to long risk following a low volume, poor structure day on Tuesday. Failure to fill a gap is positive for the day timeframe."
my data is crap Paul for delta so I don't have it fired up today....sorry..
ill exit 1319.50, but expecting 138.50 where i will buy!...
koolblue projection coincides with daily R1 for today (RTH only data) = 1322.50
1618 extension of Monday range = 1323.50
and Weekly R1 = 1323.50
so it might have been coming up on other people';s radar as possible inflection point.
Since there has been a print at 1618 up of monday's range, 8 in 10 that full extension prints = 1328.50.
If price retraces, best "last chance" place to find support is at/above Monday H of 1315.25 for 1328.50 run.
I see it now, Kool. Thanks
Emini Day Trading /
Daily Notes /
Forecast /
Economic Events /
Search /
Terms and Conditions /
Disclaimer /
Books /
Online Books /
Site Map /
Contact /
Privacy Policy /
Links /
About /
Day Trading Forum /
Investment Calculators /
Pivot Point Calculator /
Market Profile Generator /
Fibonacci Calculator /
Mailing List /
Advertise Here /
Articles /
Financial Terms /
Brokers /
Software /
Holidays /
Stock Split Calendar /
Mortgage Calculator /
Donate
Copyright © 2004-2023, MyPivots. All rights reserved.
Copyright © 2004-2023, MyPivots. All rights reserved.