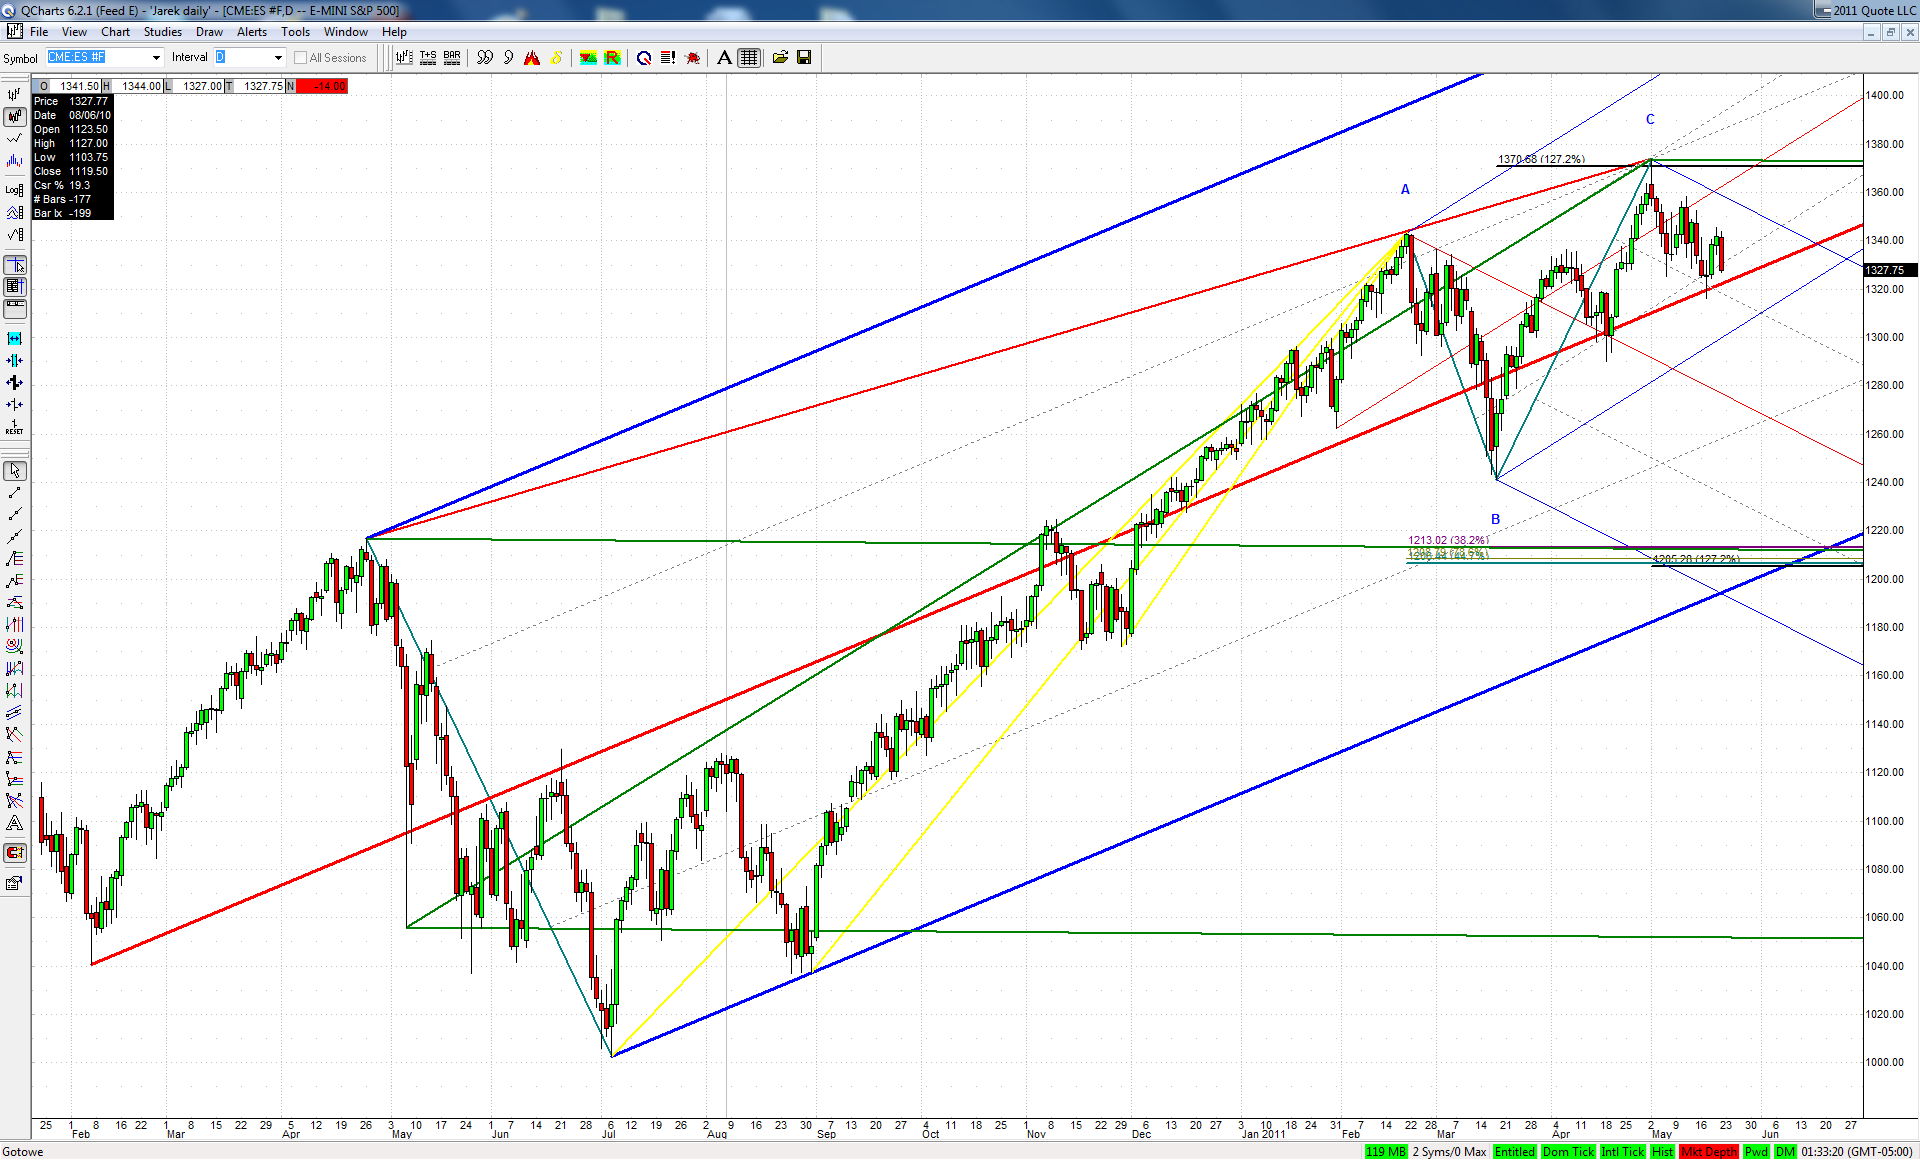
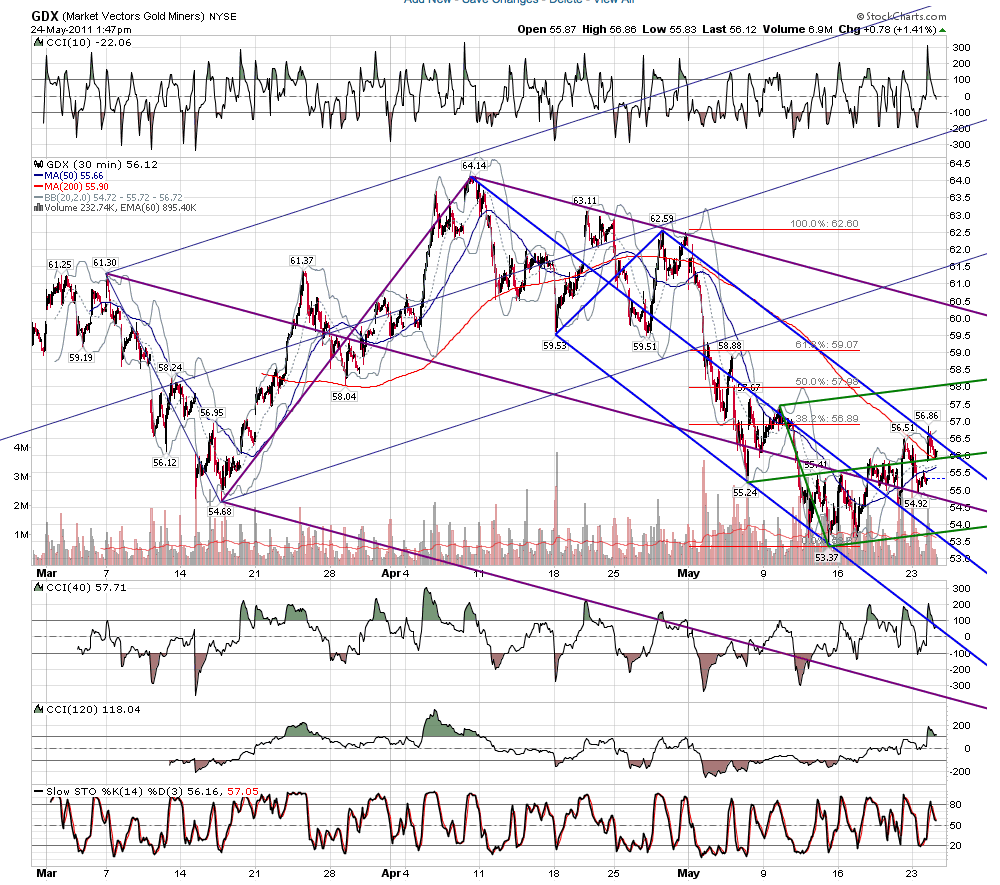
I know this potential drop of 10% in a couple of weeks is hard to conceive for some. But I can't find a better explanation for the corrective nature of the March-May rise
I see a key area in the 1308 range, and then that area just above 1300.
JI
jimkane
Rep: 3,058
Posts: 33,089
0
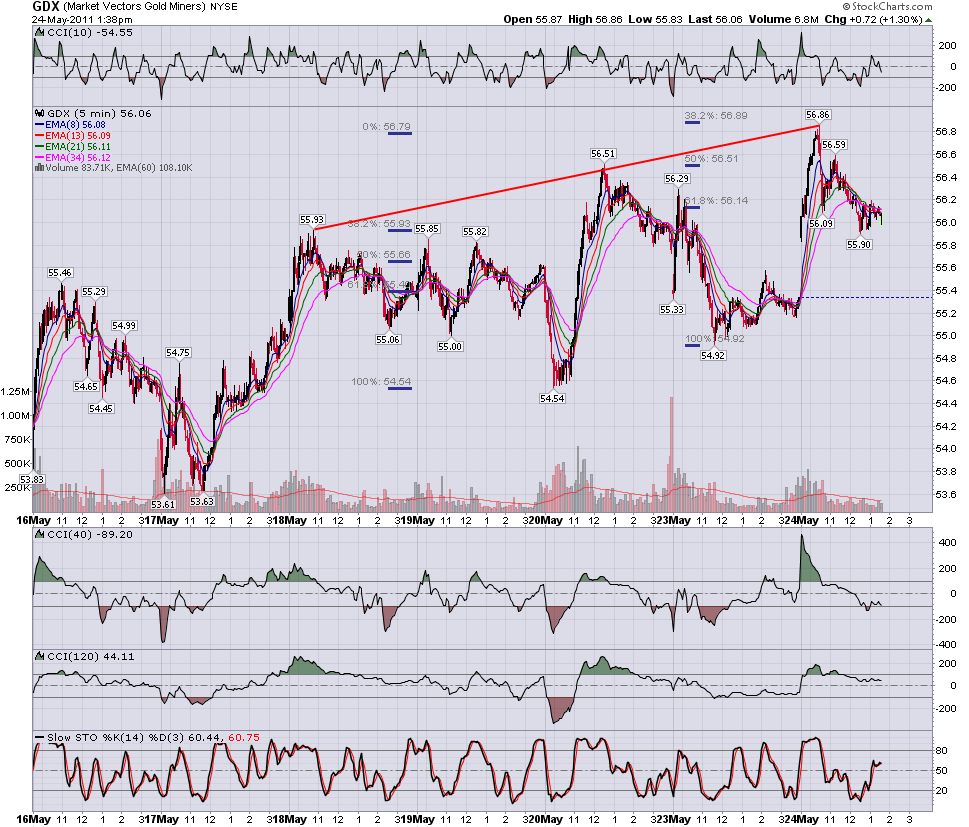
Understand, though, very short-term this is now at the extended point again. It's not trending strongly, it's almost range trading in here with a downward slope.
JI
jimkane
Rep: 3,058
Posts: 33,089
0
And as soon as I get that posted, it does the obligatory snap...
JI
jimkane
Rep: 3,058
Posts: 33,089
0
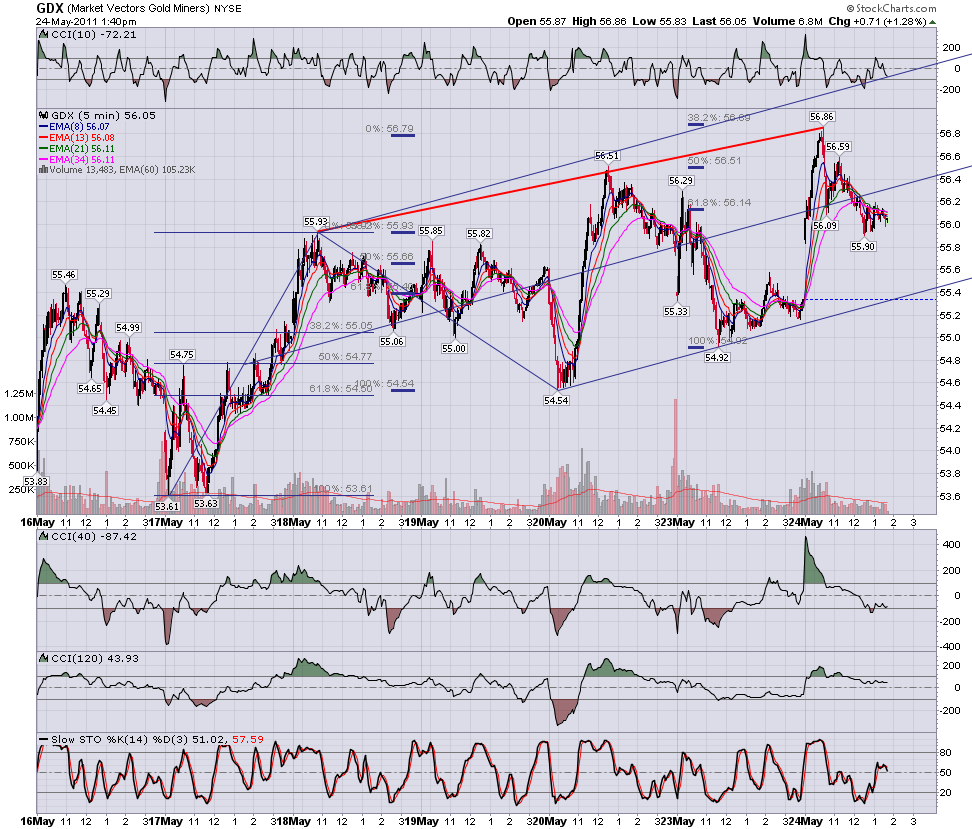
This is just sitting on a key TL... It better be very careful.
JI
jimkane
Rep: 3,058
Posts: 33,089
0
Up like a rocket for a bit???
JI
jimkane
Rep: 3,058
Posts: 33,089
2
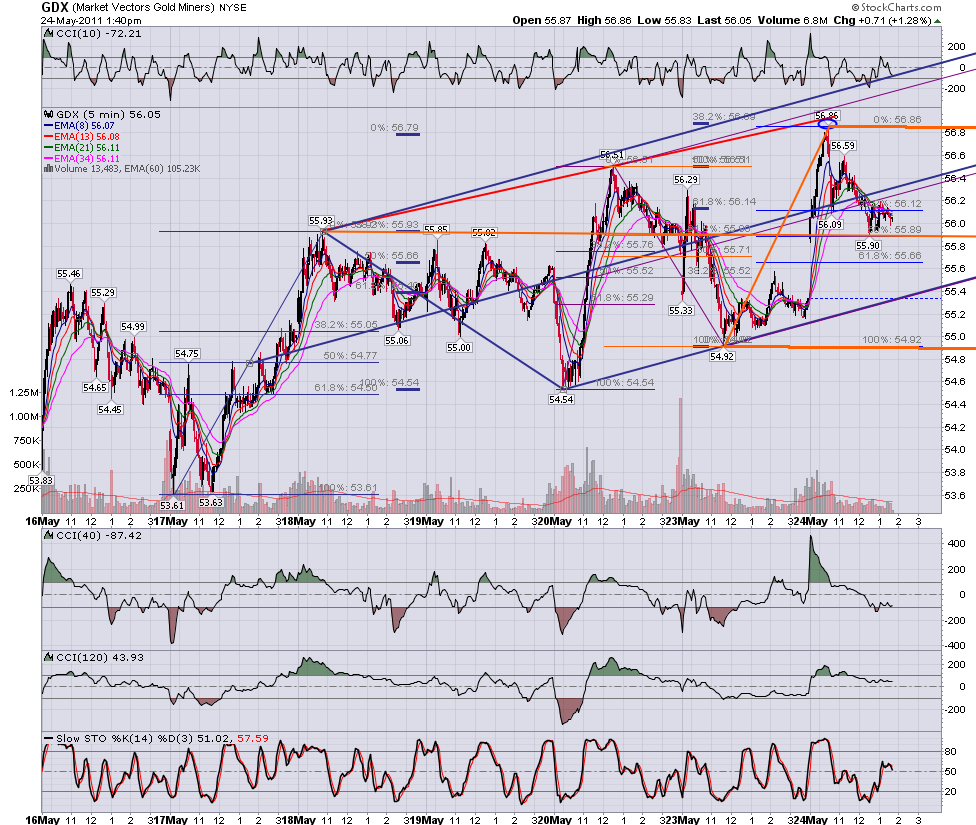
Why am I even thinking of that as a possibility? This TL here is very key, and usually when they see something like that they react violently to it, because they know what happens if they let it go (let it give way). Maybe they won't this time, but it's something I'm always ready for when I'm on a side against it, in this case short-side bias.
RA
rat89
Rep: 0
Posts: 7,015
2
Click image for original size
Click image for original size
Click image for original size
Click image for original size
JI
jimkane
Rep: 3,058
Posts: 33,089
0
(Edited )
Watch this 1-min downsloping TL and the 'squirt effect' when if gives way.
Okay, see everyone later. I'll try to do those updates on copper and the Swissie like I mentioned in those sections, and get to jarek's question on that being a KT rocking chair pattern failure setup, some time this weekend.