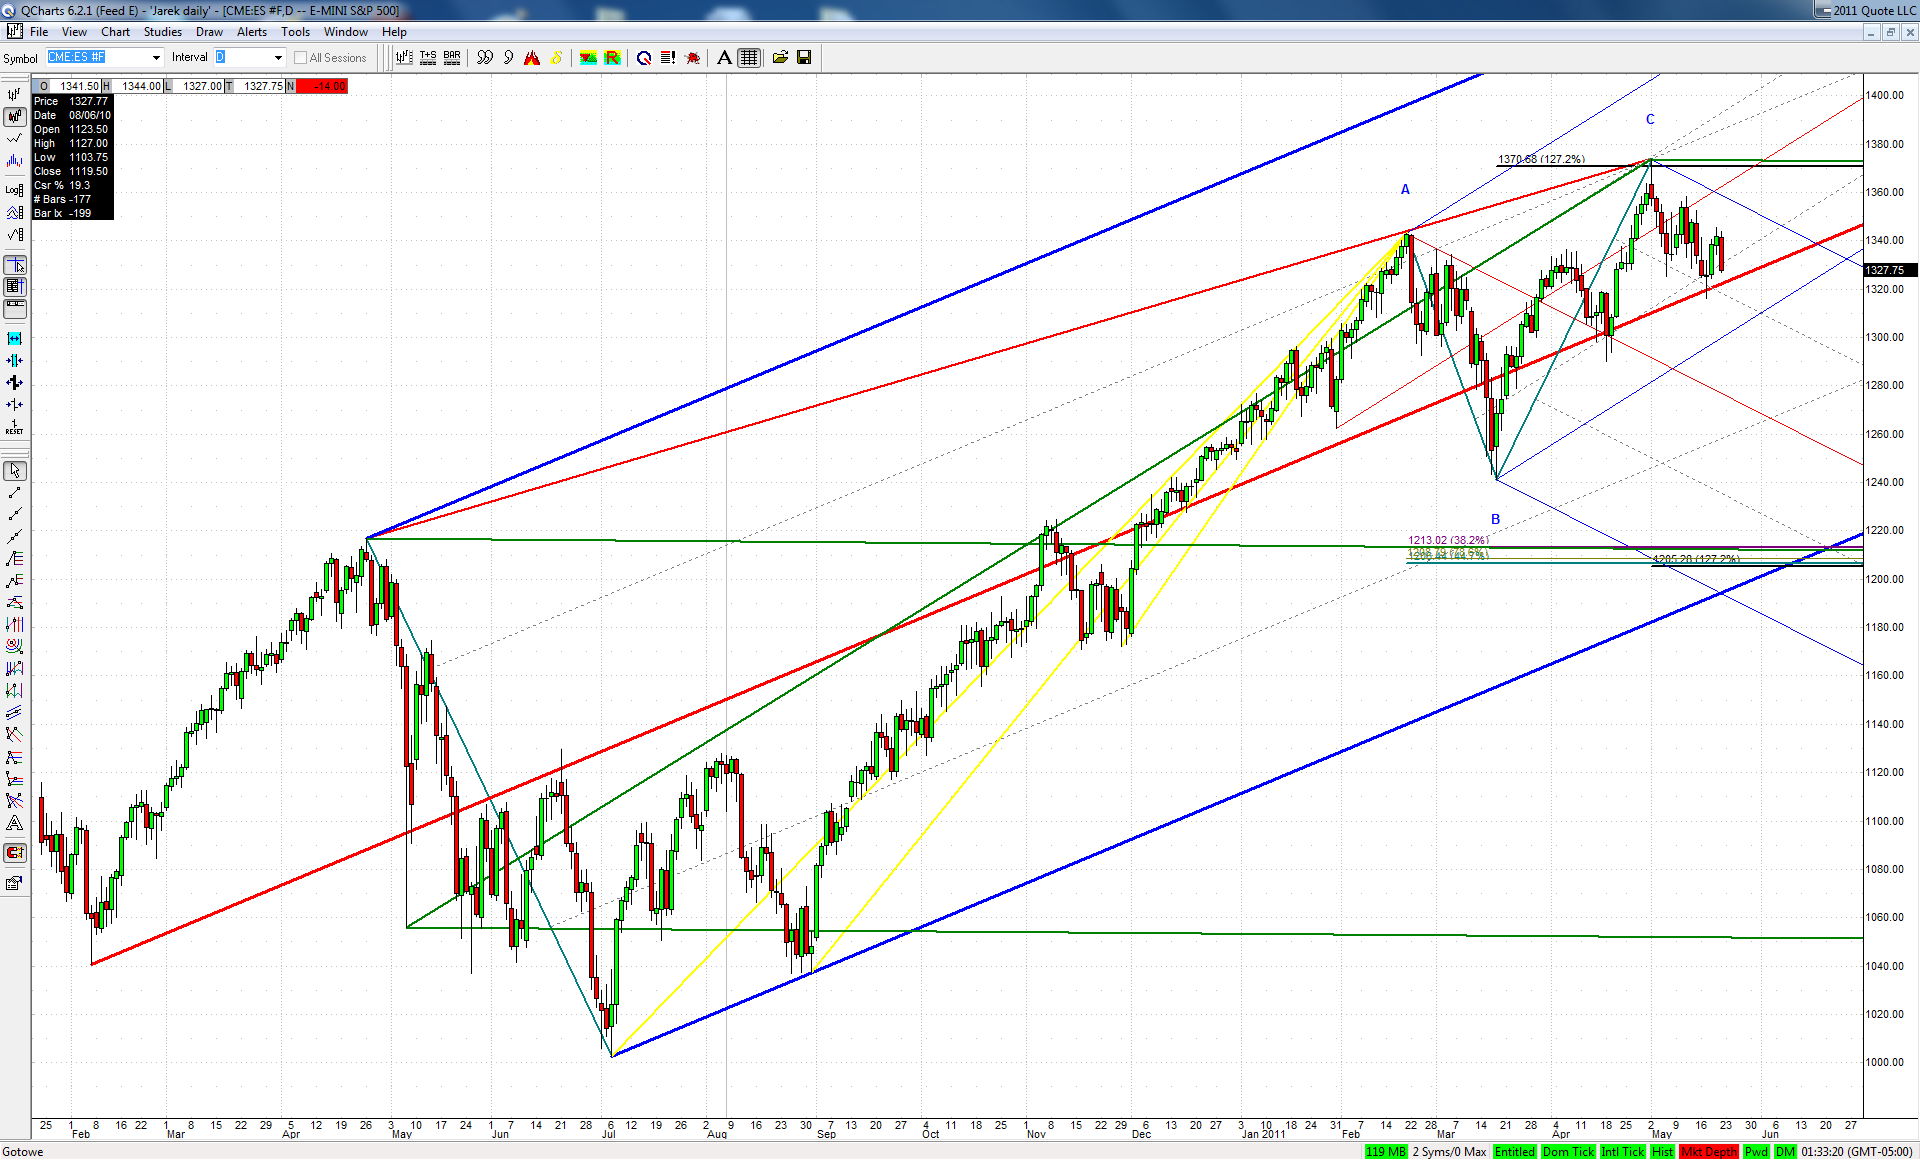
Here is the update of my longer term ES chart:
I know this potential drop of 10% in a couple of weeks is hard to conceive for some. But I can't find a better explanation for the corrective nature of the March-May rise
JI
jimkane
Rep: 3,058
Posts: 33,089
Market has a funny way of showing this so far...
Originally posted by jimkane
I think the market wants to rise a bit from here.
JI
jimkane
Rep: 3,058
Posts: 33,089
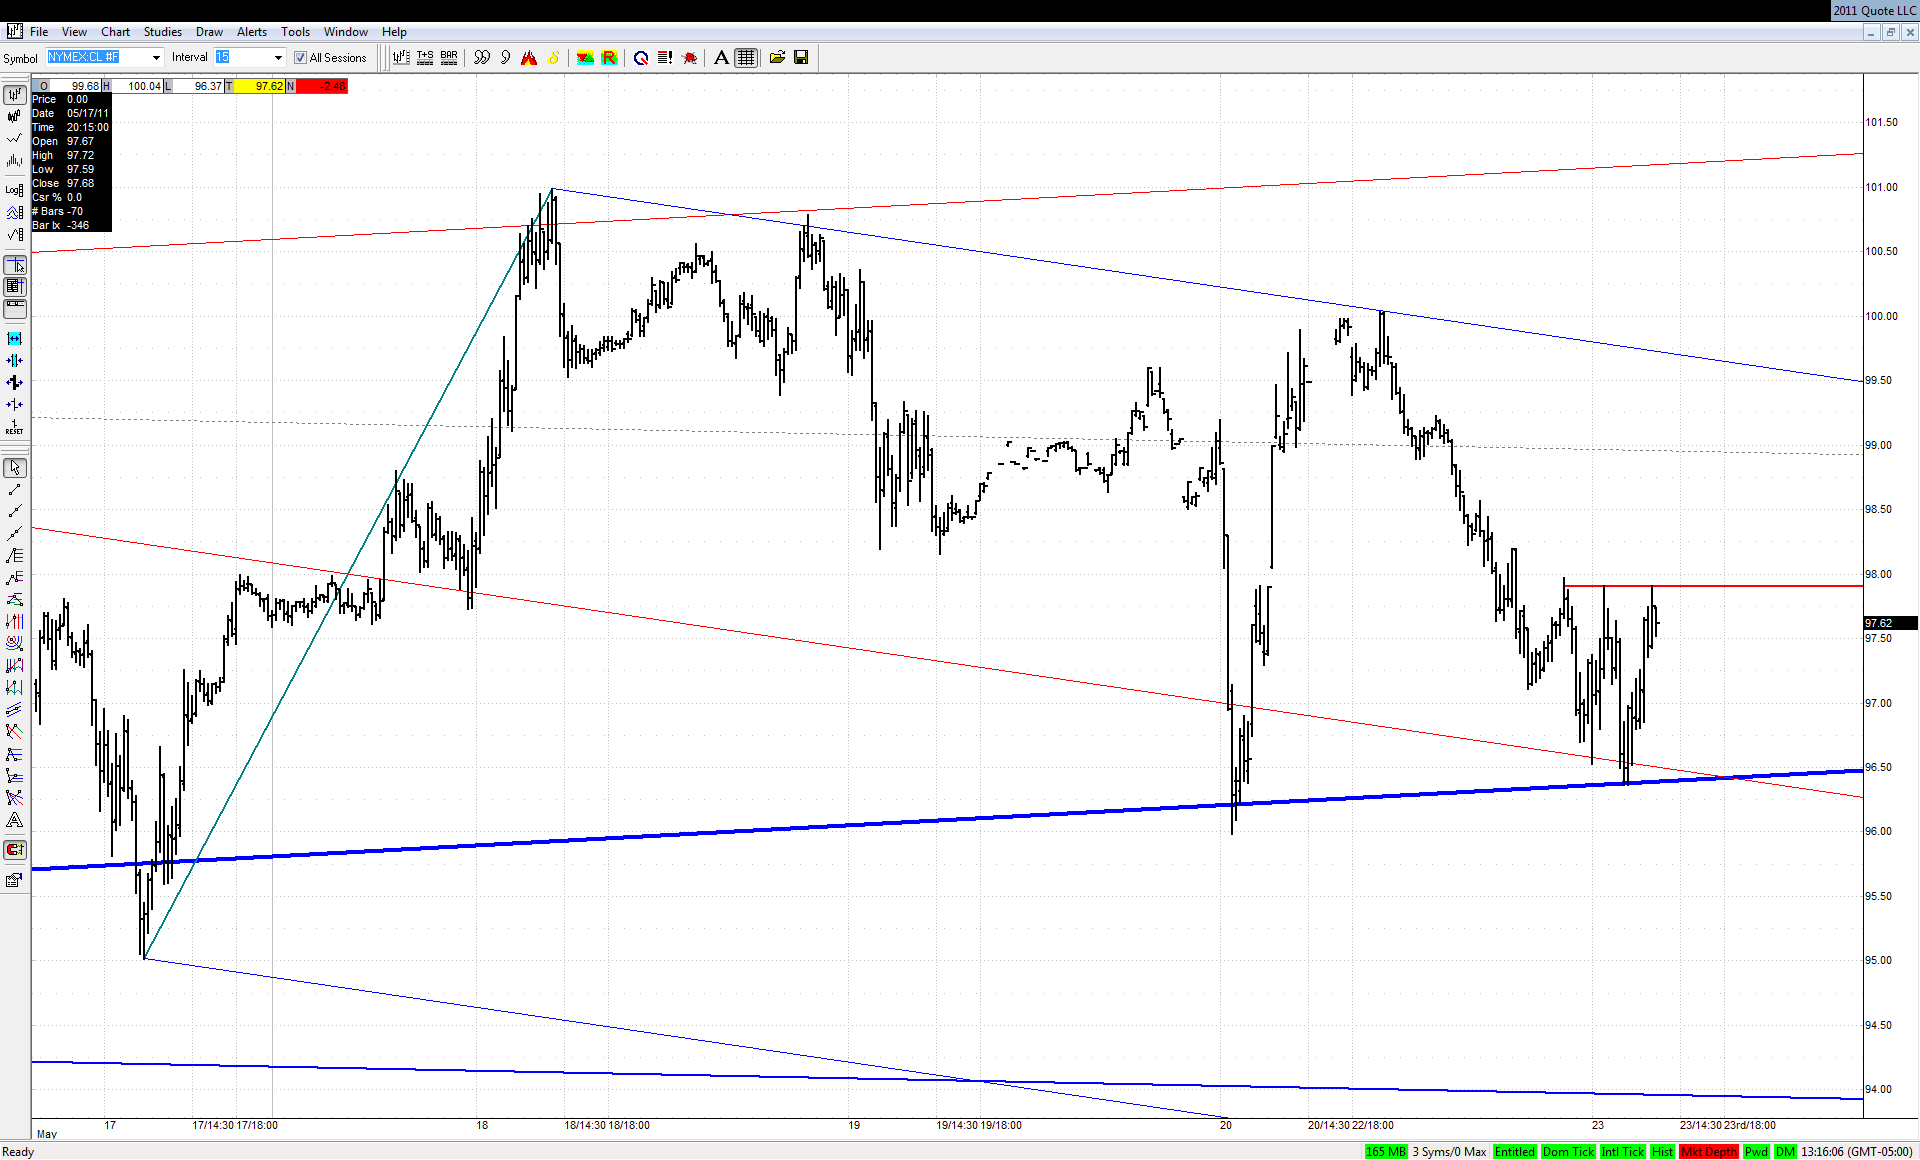
Can you show a 15-min chart, or even a 5-min? I was talking about the overhead spot on that timeframe. Yes, ultimately I think this will break down below all that lateral support you show. I have those two areas below I mentioned, at roughly 92 and 90.
Originally posted by jarek
Originally posted by jimkane
... watch all that 'lateral resistance' in CL ...
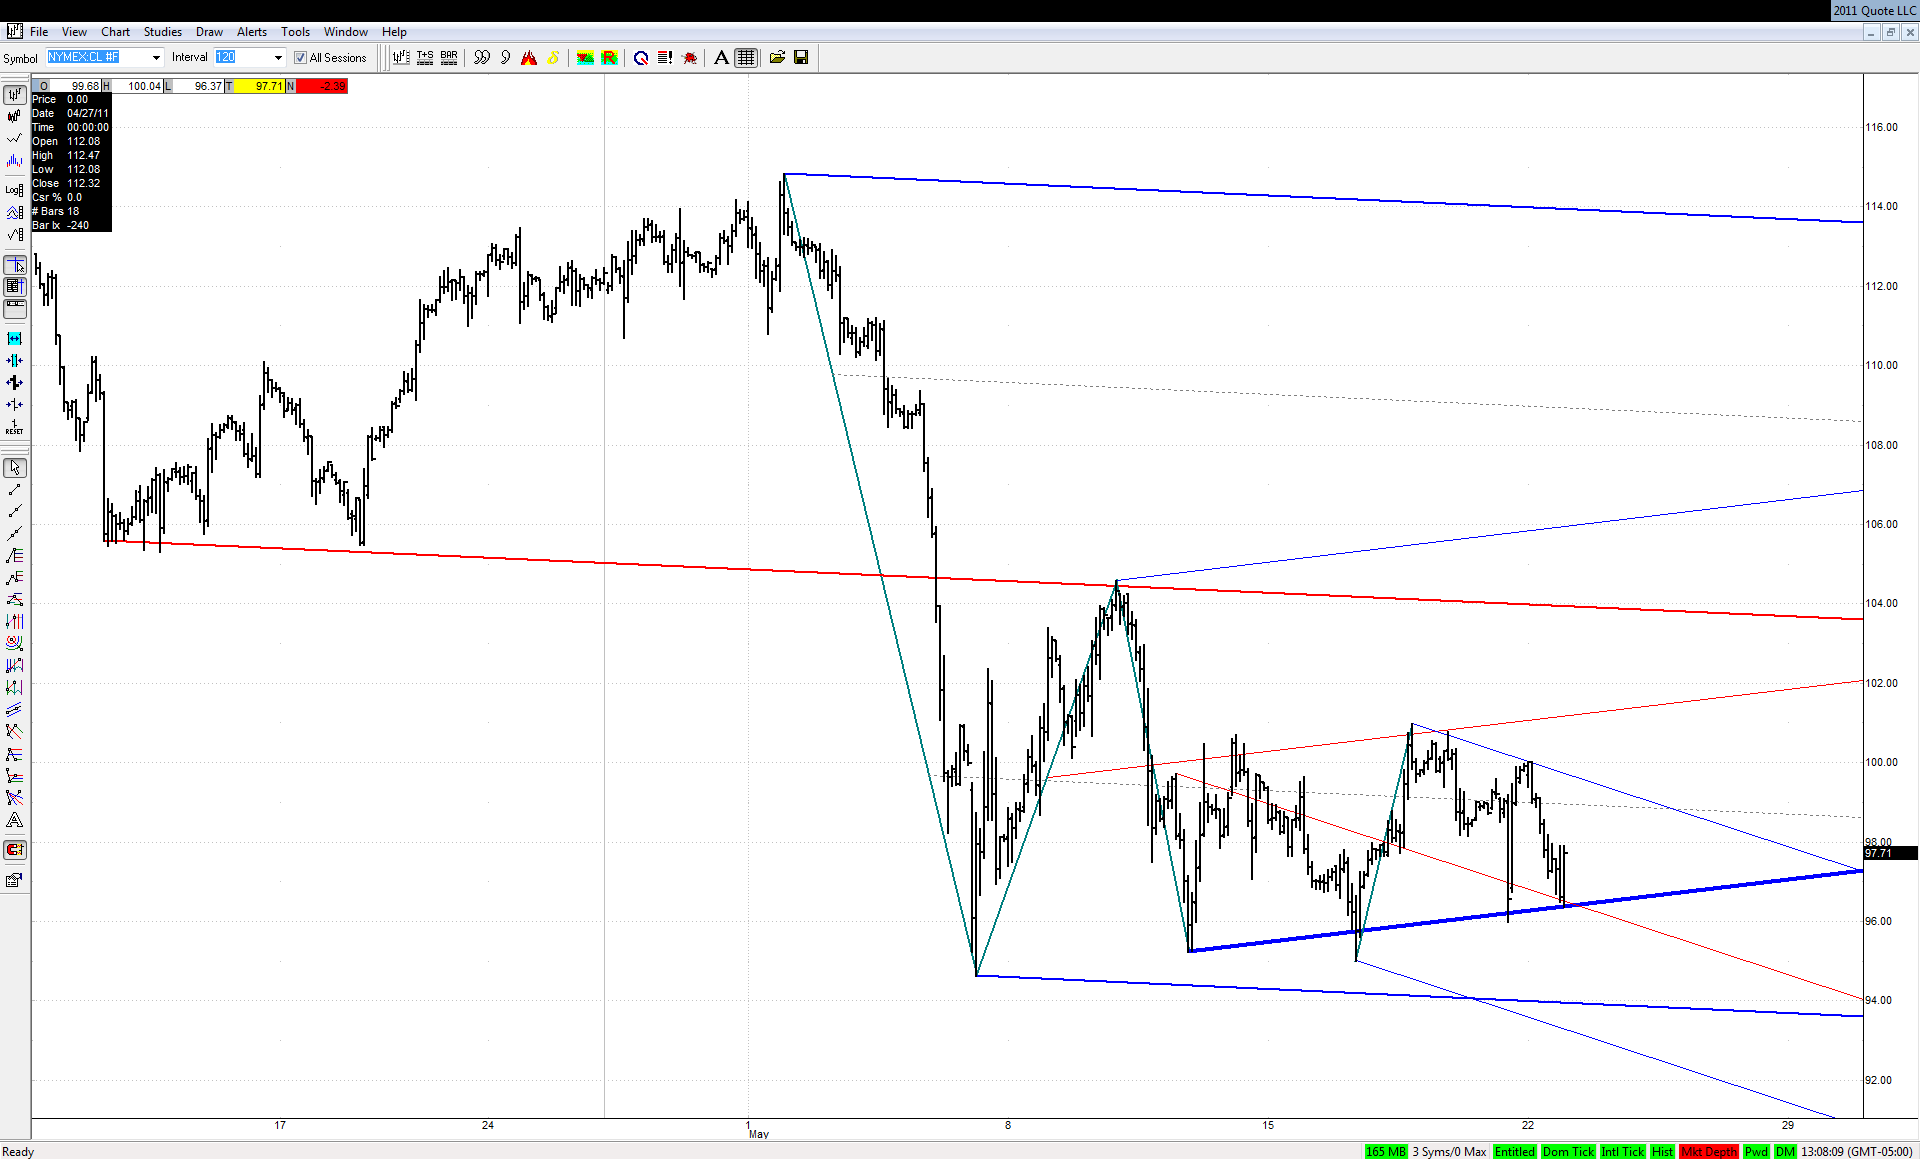
Breaking it could mean a lot of troubles for the bull:
JI
jimkane
Rep: 3,058
Posts: 33,089
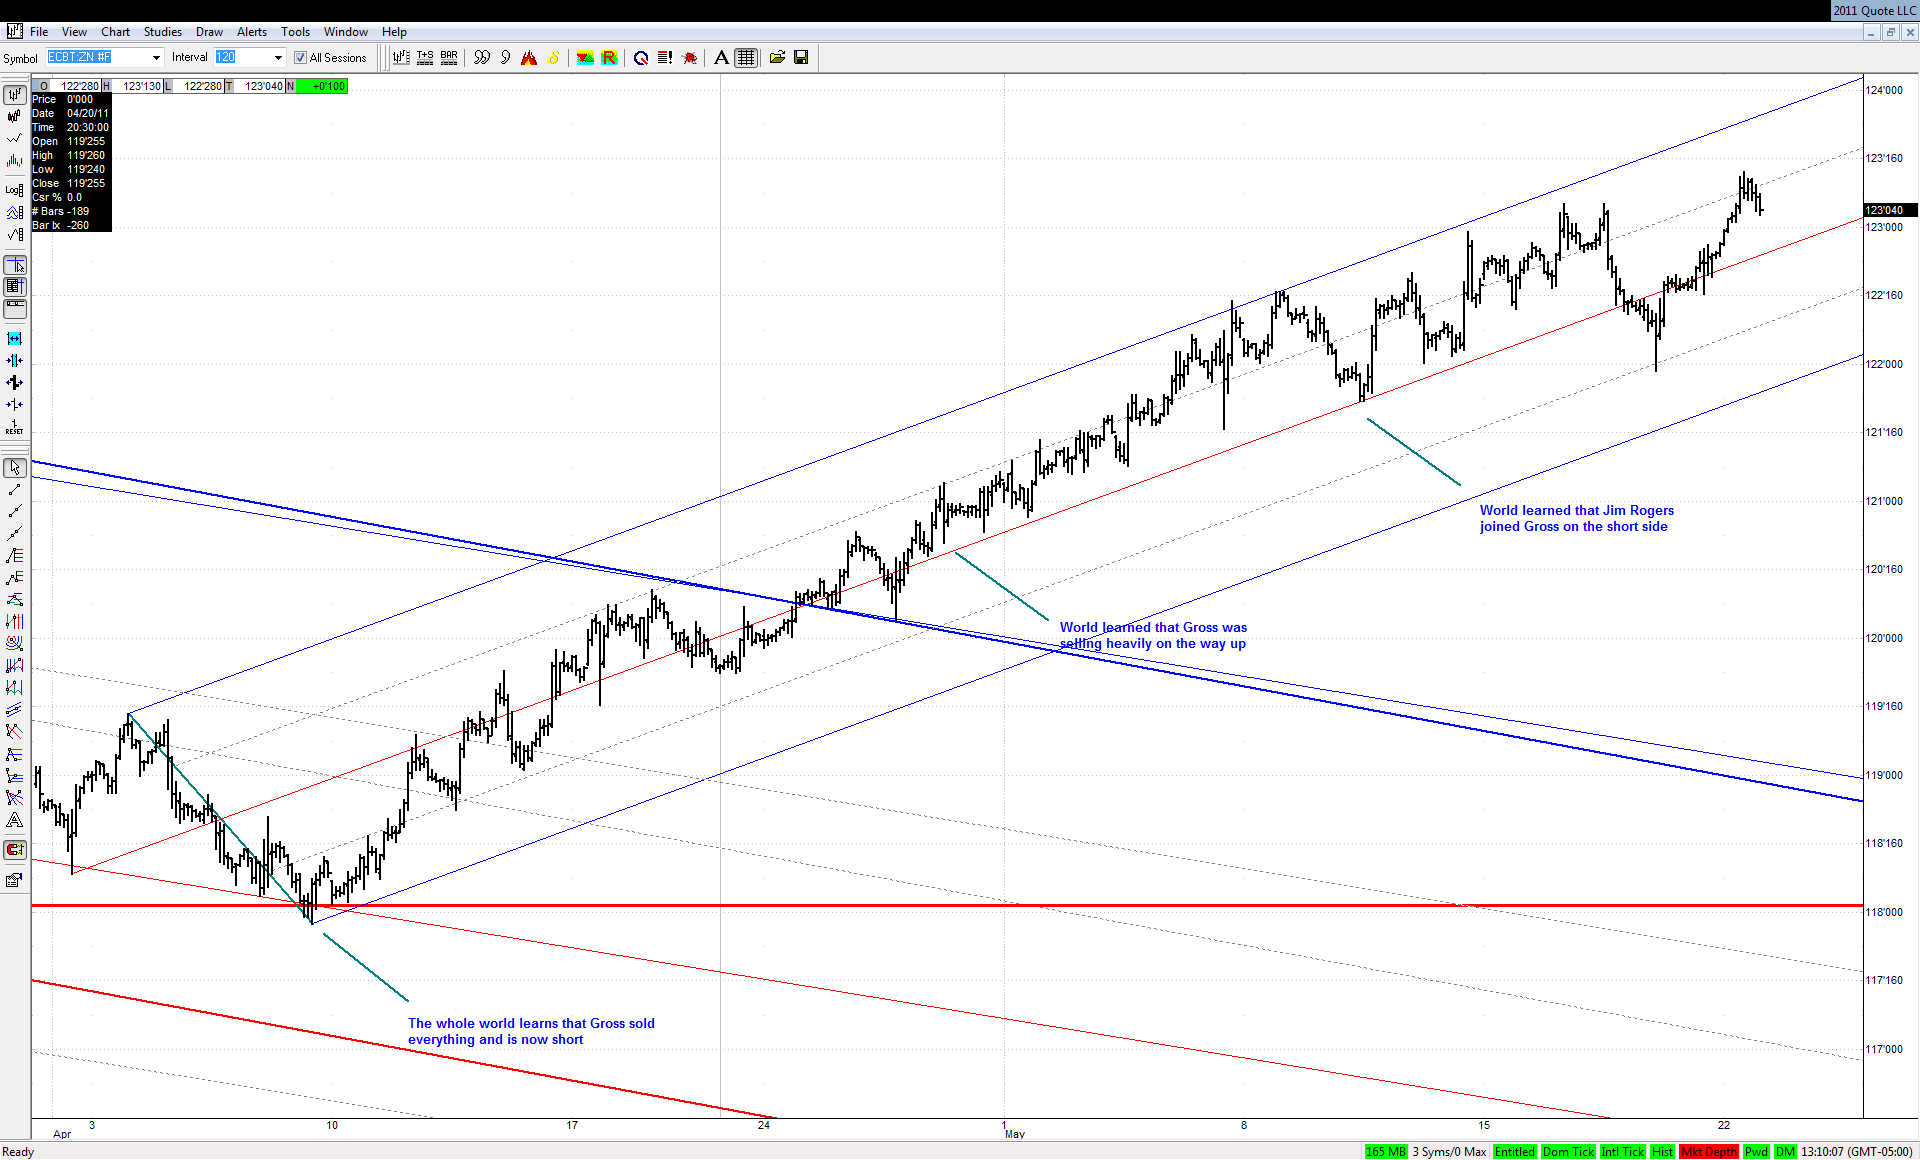
I did some work with a student this weekend, and we looked at the bigger picture in ZN. We were looking at one scenario where the market sold off hard (you know, the we need QE3 dump game) and money went into treasuries (that's a big if nowadays, but under duress and fear...). I saw one area in ZN about eight points overhead that it might hit. In the ZB the equivalent area would be 134 and change. There is also an area around 130 and change.
So, I can see the ZB rising nine plus points from here. Notice the key TL off the previous two peaks there, too. If it did rise this high I think Gross and the other biggies would be shorting the daylights out of it all the way there, cheering at their incredible good fortune at such a gift. But, that's just what I think would happen...
Originally posted by jarek
Bonds are still defying gravity:
JI
jimkane
Rep: 3,058
Posts: 33,089
Oops, I see now you showed the ZN. Most talk about the ZB when they talk Gross et al. So, I didn't need to do the ZB numbers. On the ZN the areas are roughly 126 and 129. Everyone who is interested should do their own work. The 129 area would be a 'retest', essentially, of the highs.