MyPivots
Sign In
JA
jarek
Rep: 94
Posts: 3,474
Here is the update of my longer term ES chart:

Click image for original size
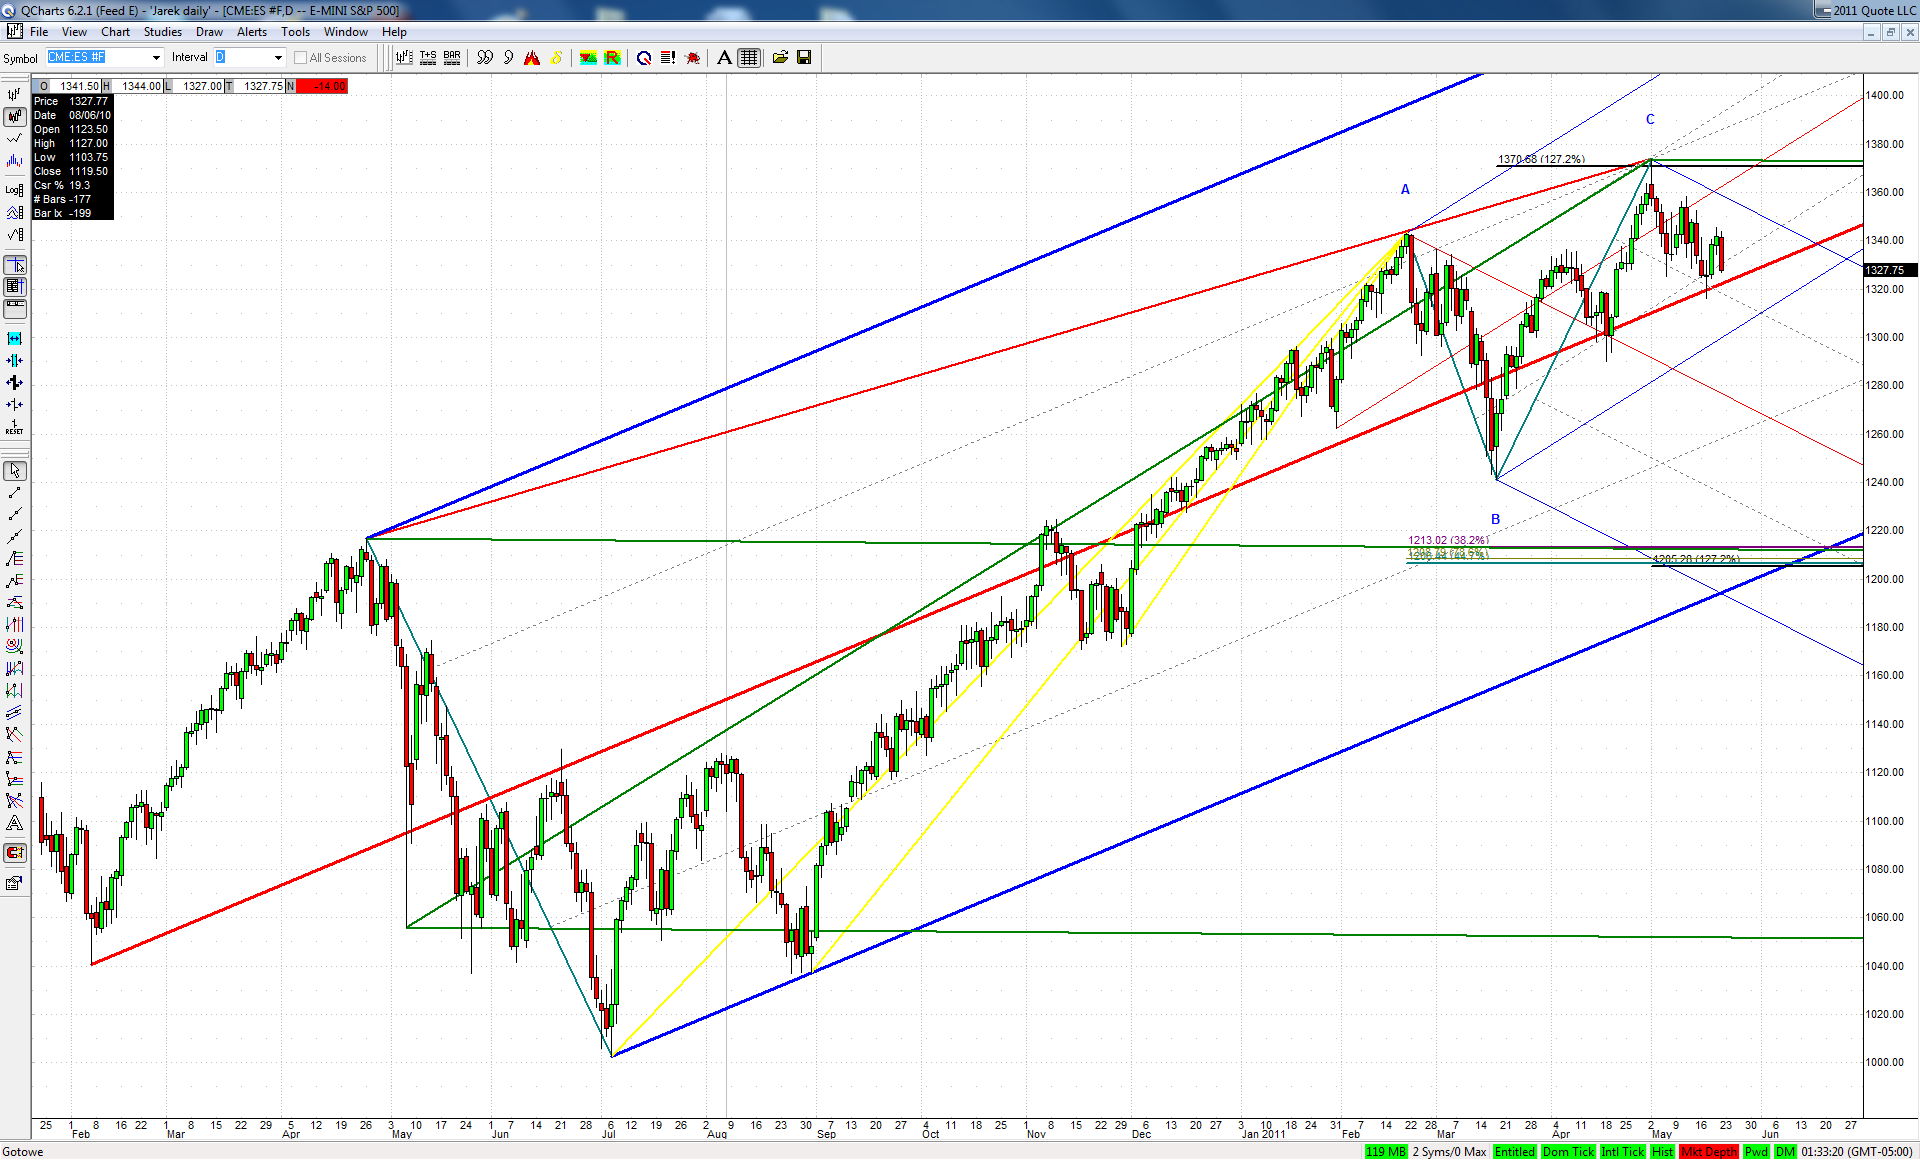

I know this potential drop of 10% in a couple of weeks is hard to conceive for some. But I can't find a better explanation for the corrective nature of the March-May rise
RA
rat89
Rep: 0
Posts: 7,015
turn the charts upside down?


Originally posted by jarek

Originally posted by jarek

Maybe to cure myself a bit I'll start to show bullish setups...

I see only bearish ones in ES at the moment...

JA
jarek
Rep: 94
Posts: 3,474
Does it help?
MA
MarcinO
Rep: 67
Posts: 5,506
Definitely. The bull turned upside down poses much weaker resistance.
RA
rat89
Rep: 0
Posts: 7,015
why does it feel like a sharp move is coming? which way?
TX
tx_ches
Rep: -10
Posts: 514
Yeah, it is confusing. I have an abcd that could be bear - its structure of the legs is bearish but the fibs work better as a bull.
"When in doubt, stay out" as others have said.
TX
tx_ches
Rep: -10
Posts: 514
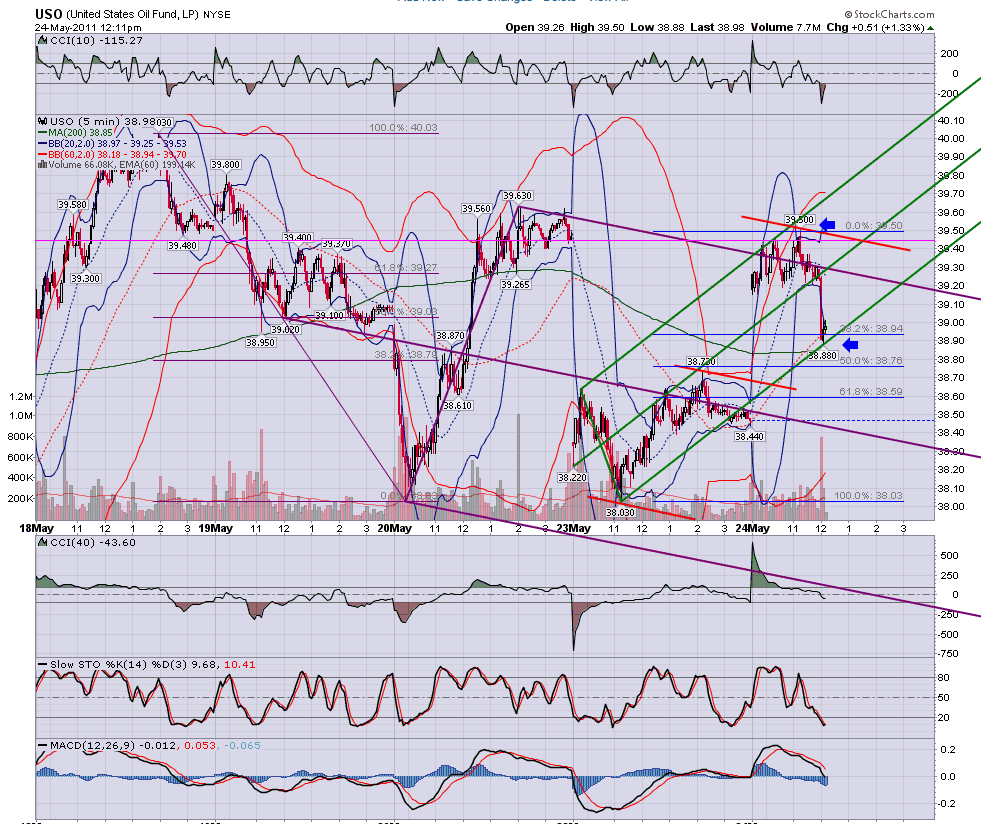
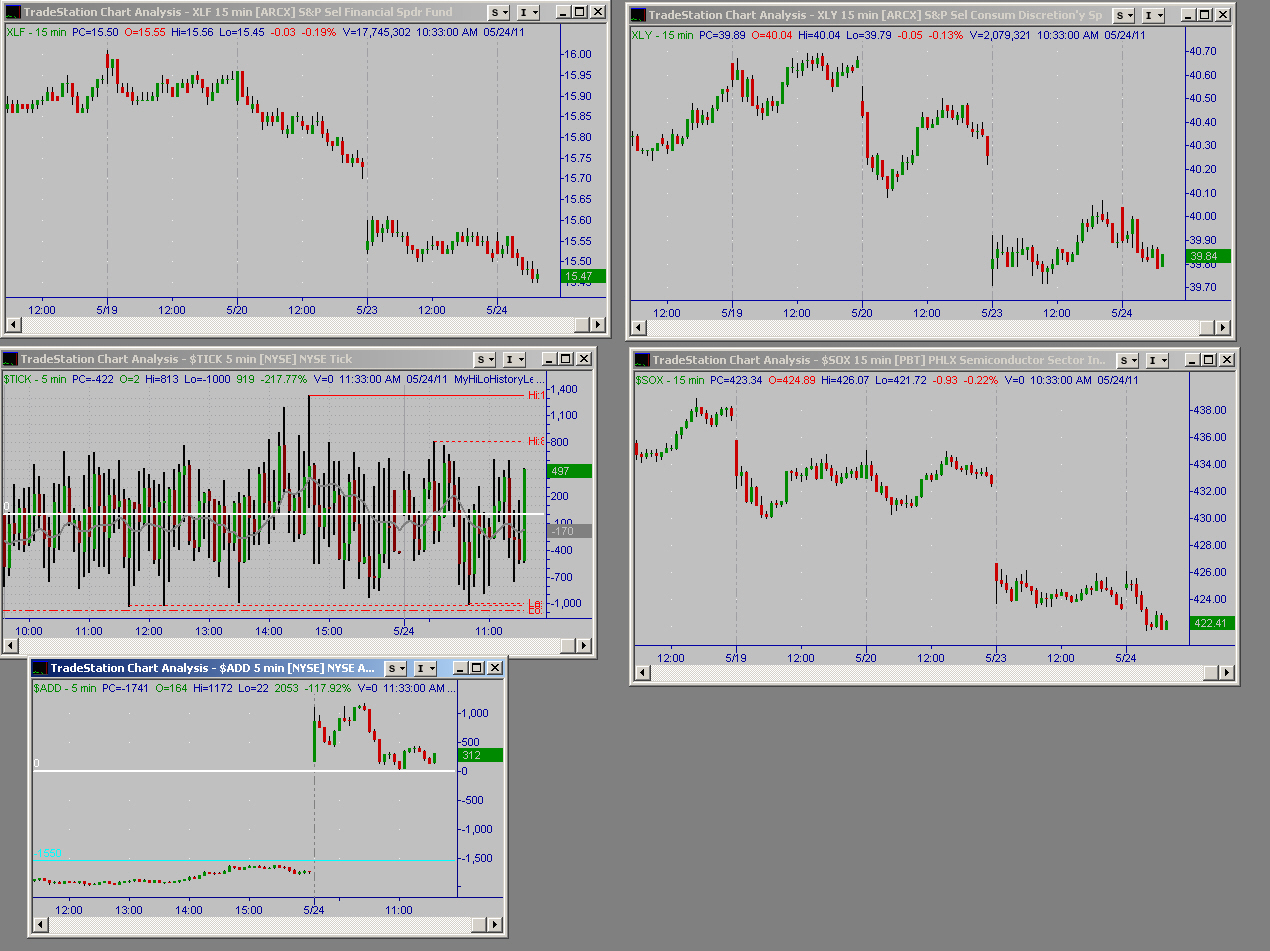
Most of the Spdr ETFs are sideways but Financials and Discretionary have a direction picked - down.

Click image for original size
RA
rat89
Rep: 0
Posts: 7,015
Click image for original size
AL
albert
Rep: 99
Posts: 3,094
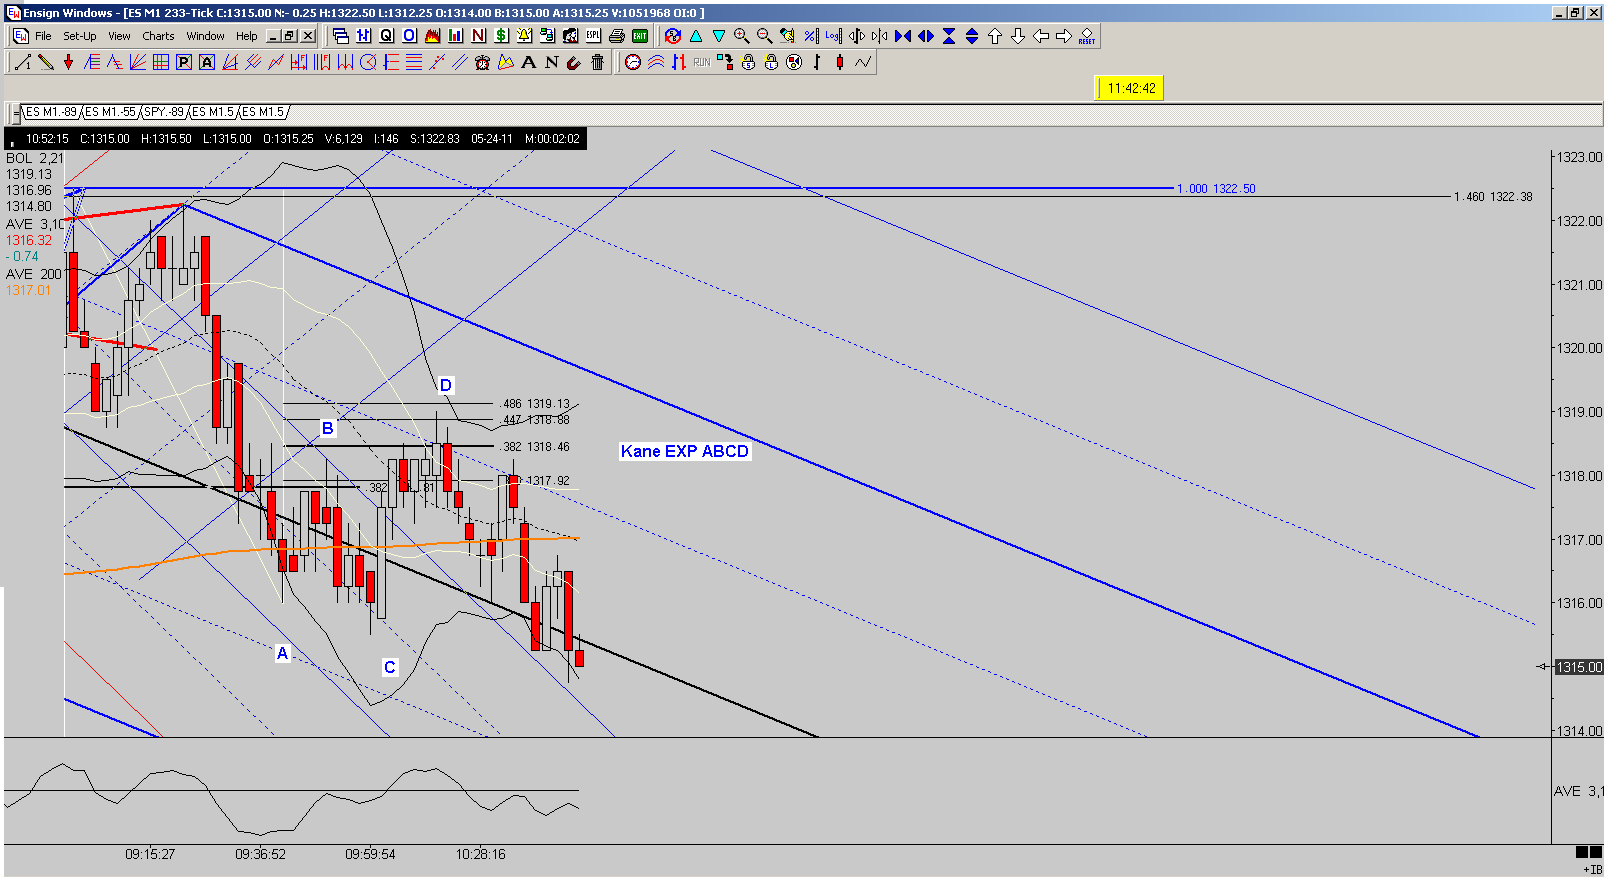
KAne EXP ABCD completing at 0.486 fibo.

Good Trading,

Al Kamego

Click image for original size
JI
jimkane
Rep: 3,058
Posts: 33,089
And yet another bearish ES ABCD plays out...
TX
tx_ches
Rep: -10
Posts: 514
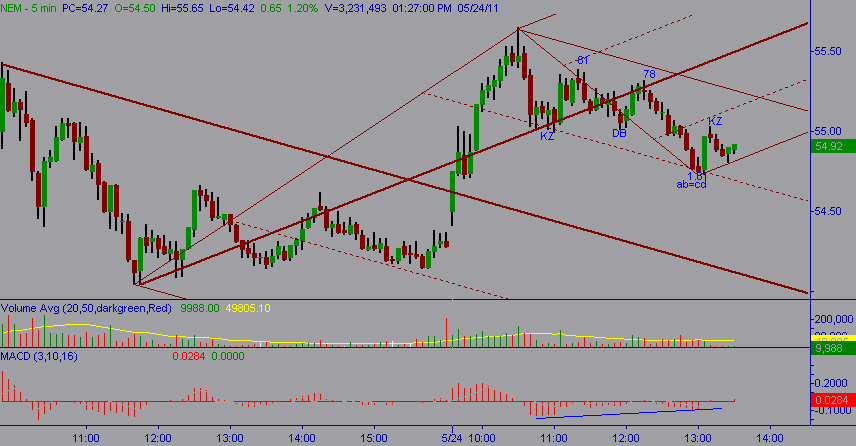
NEM 5 minute. Will bulls overcome?

Click image for original size
JI
jimkane
Rep: 3,058
Posts: 33,089
Okay, see everyone later. I'll try to do those updates on copper and the Swissie like I mentioned in those sections, and get to jarek's question on that being a KT rocking chair pattern failure setup, some time this weekend.