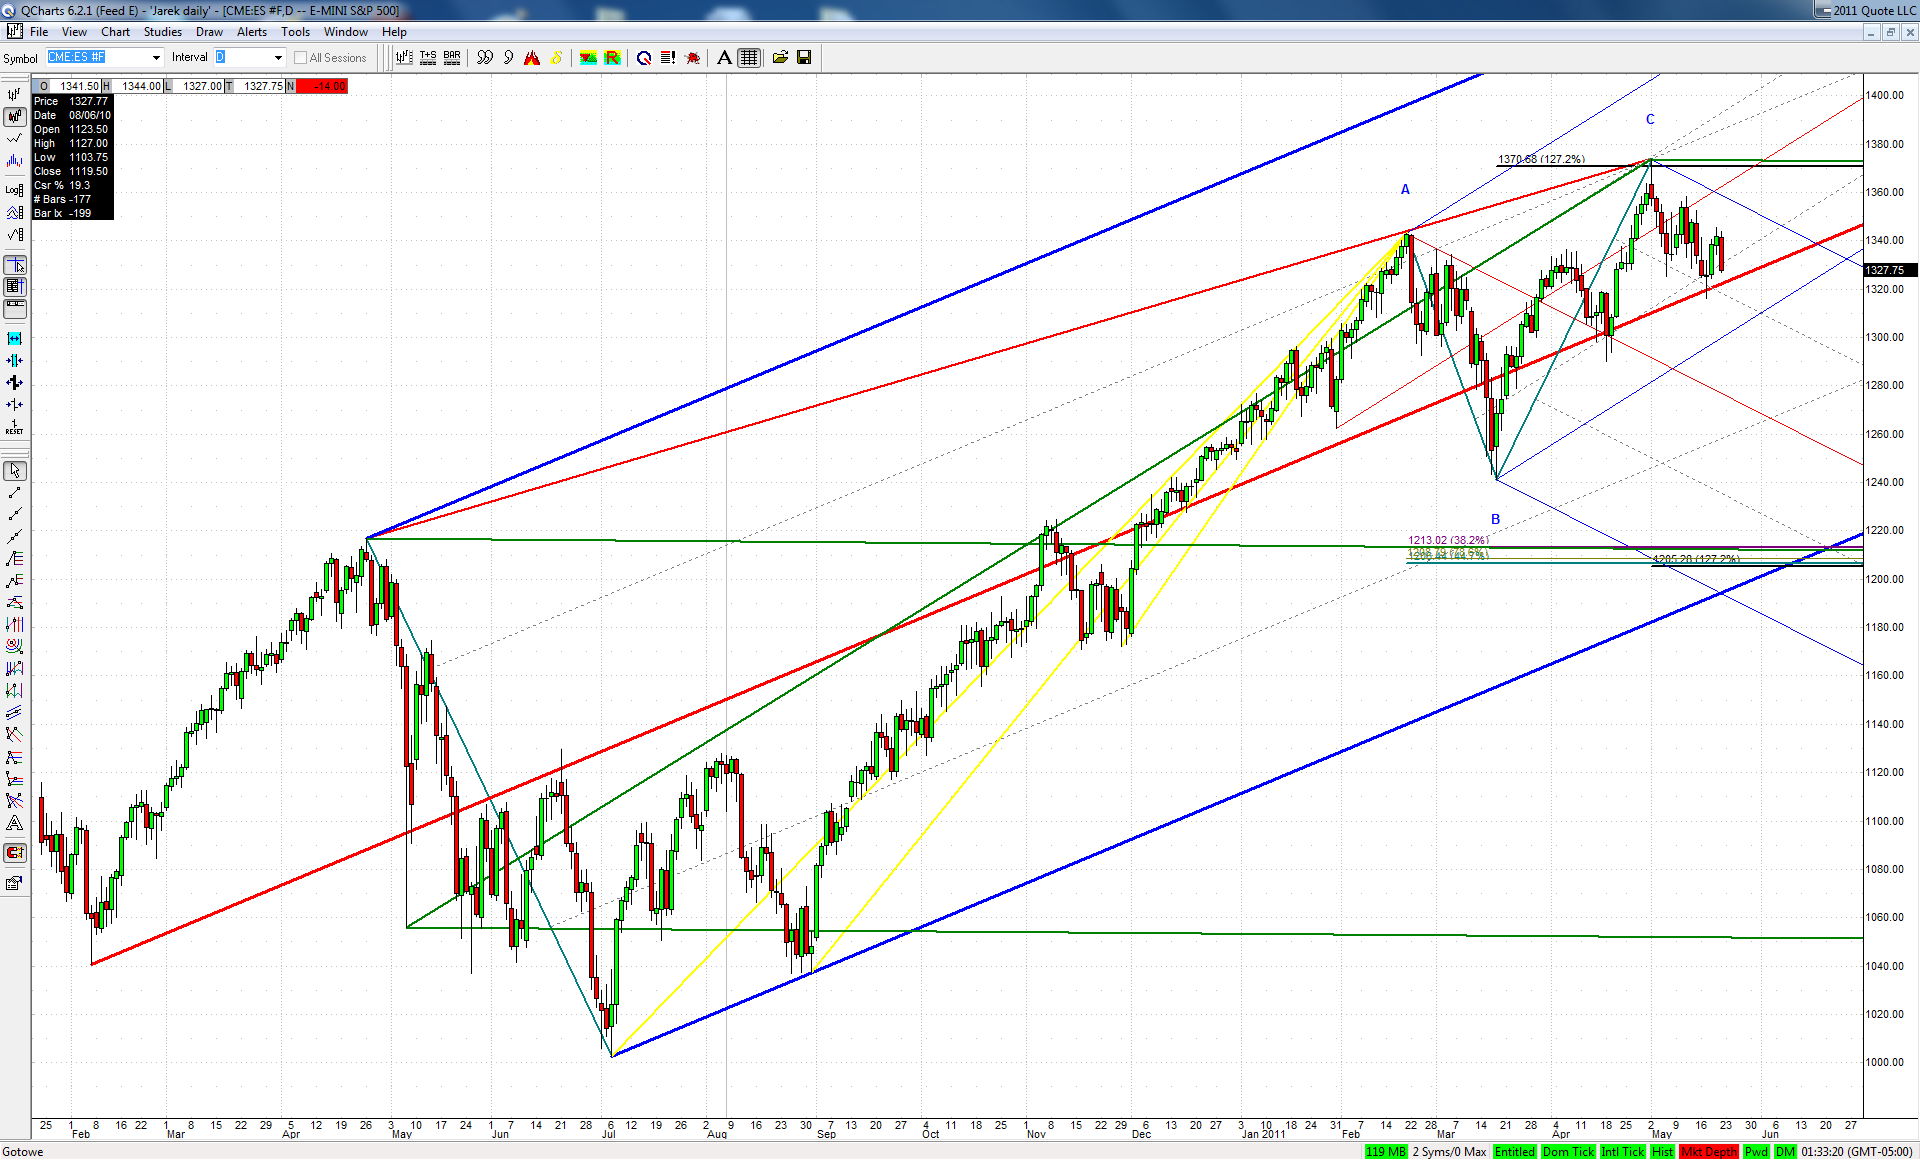
I know this potential drop of 10% in a couple of weeks is hard to conceive for some. But I can't find a better explanation for the corrective nature of the March-May rise
Set line next. None of this should be any issue for it, I suspect. We'll see.
JI
jimkane
Rep: 3,058
Posts: 33,089
1
First area hit, as expected.
JI
jimkane
Rep: 3,058
Posts: 33,089
5
(Edited )
'Normally' it would check back in here before trying the next level, in my experience. But, you never know the way they manipulate things nowadays.
JA
jarek
Rep: 94
Posts: 3,474
3
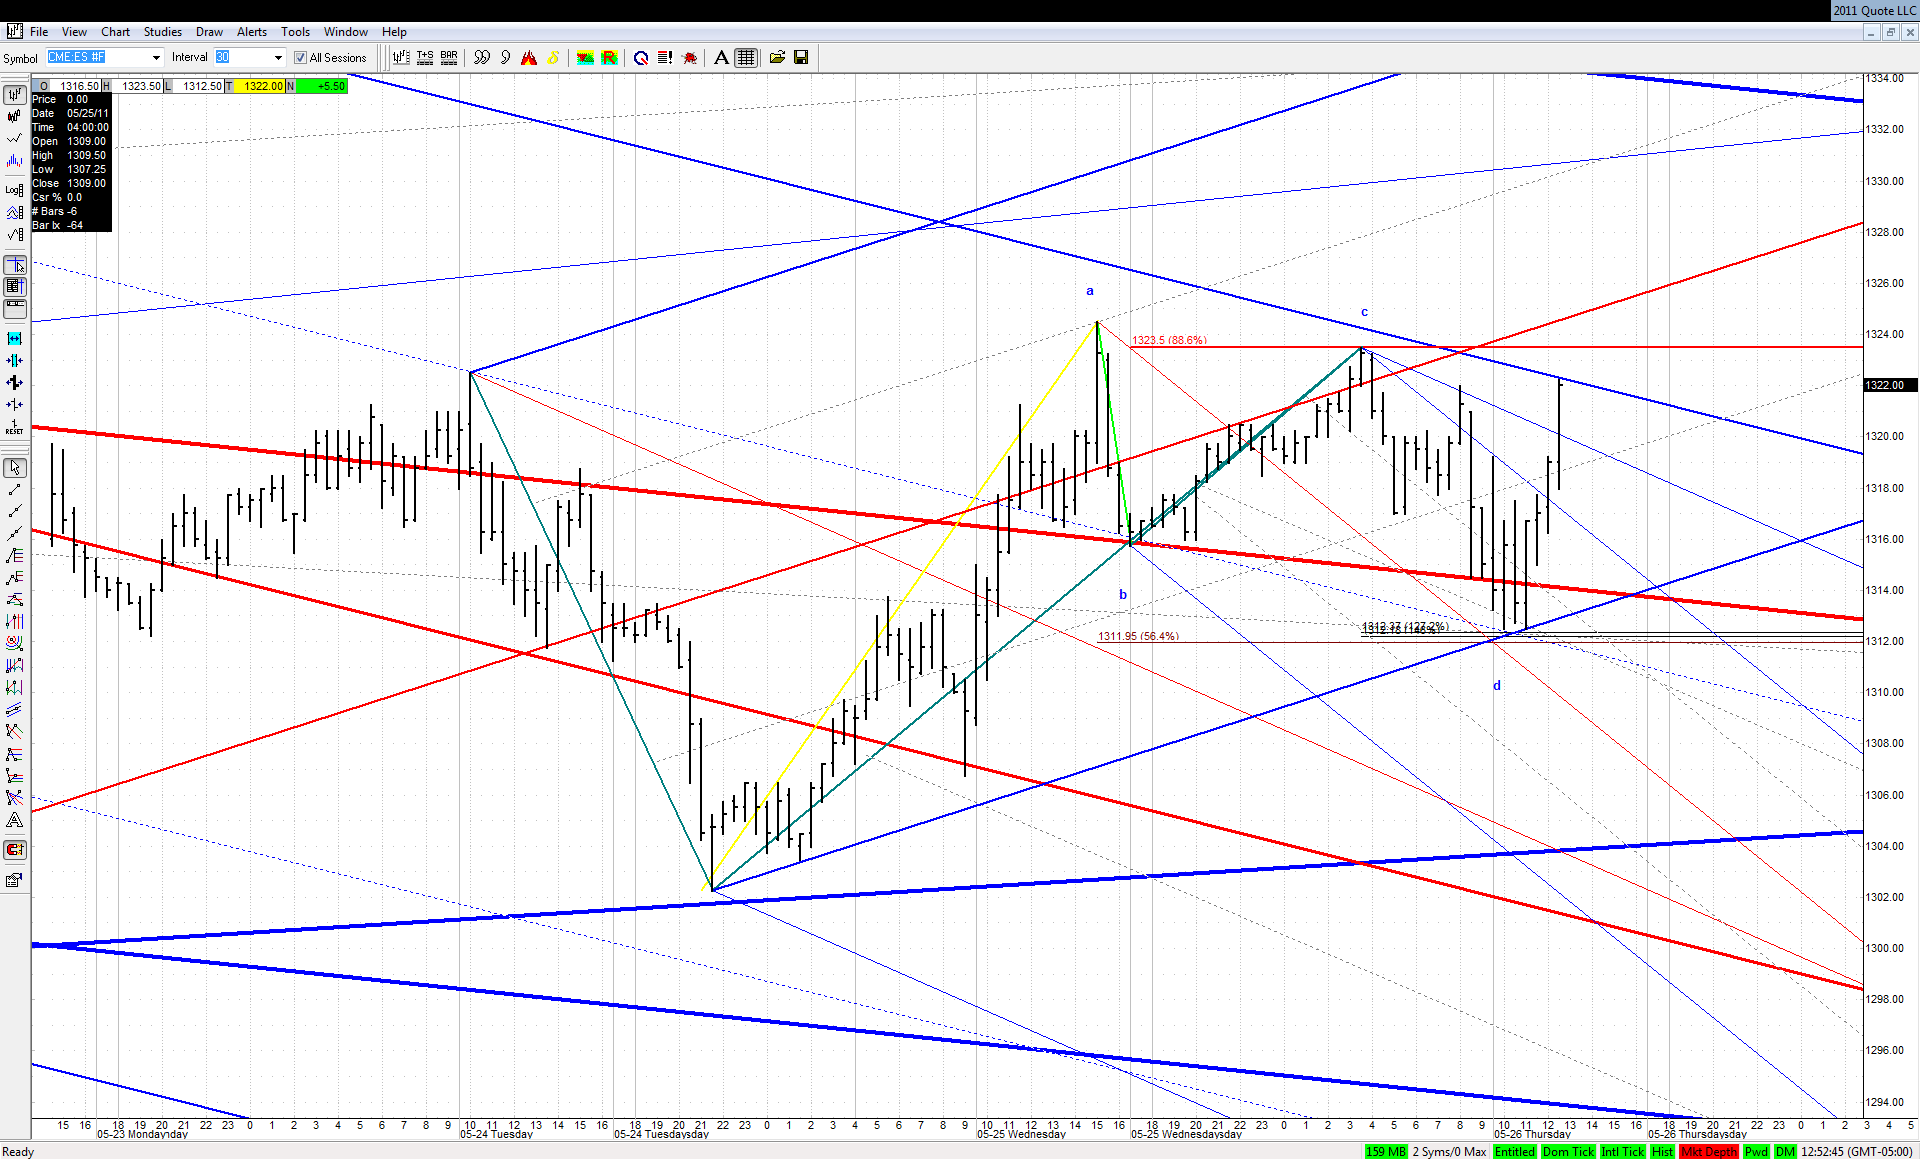
Here's the bullish ABCD:
Click image for original size
RA
rat89
Rep: 0
Posts: 7,015
1
Click image for original size
JI
jimkane
Rep: 3,058
Posts: 33,089
2
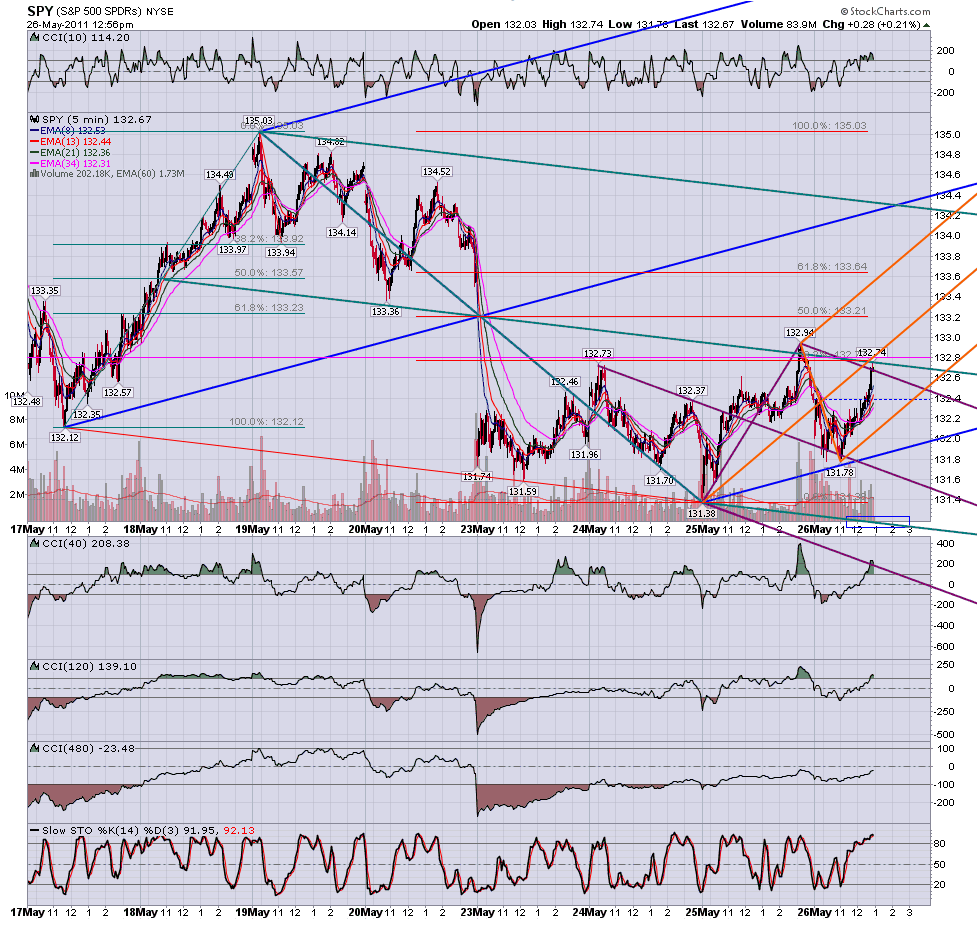
My next bigger key area is around 34-36. I'll refine this later if it does head up that-a-ways. What I don't like about that area is it is a very, very, very obvious area that has been tested many times (the TL), and it would do it with an ABCD. Too obvious. Makes me think if it got there it would be a 'W3'.
JI
jimkane
Rep: 3,058
Posts: 33,089
1
First area just stopped it dead. Amazing how that happens. It may be just resting now for the next burst. We'll see. It does what it does.
JI
jimkane
Rep: 3,058
Posts: 33,089
1
Here comes the next leg, no checkback. Wow.
JI
jimkane
Rep: 3,058
Posts: 33,089
1
Notice the next level is also yet another 'backtest' of that same key TL. I can't imagine it would fail this time.
Okay, see everyone later. I'll try to do those updates on copper and the Swissie like I mentioned in those sections, and get to jarek's question on that being a KT rocking chair pattern failure setup, some time this weekend.