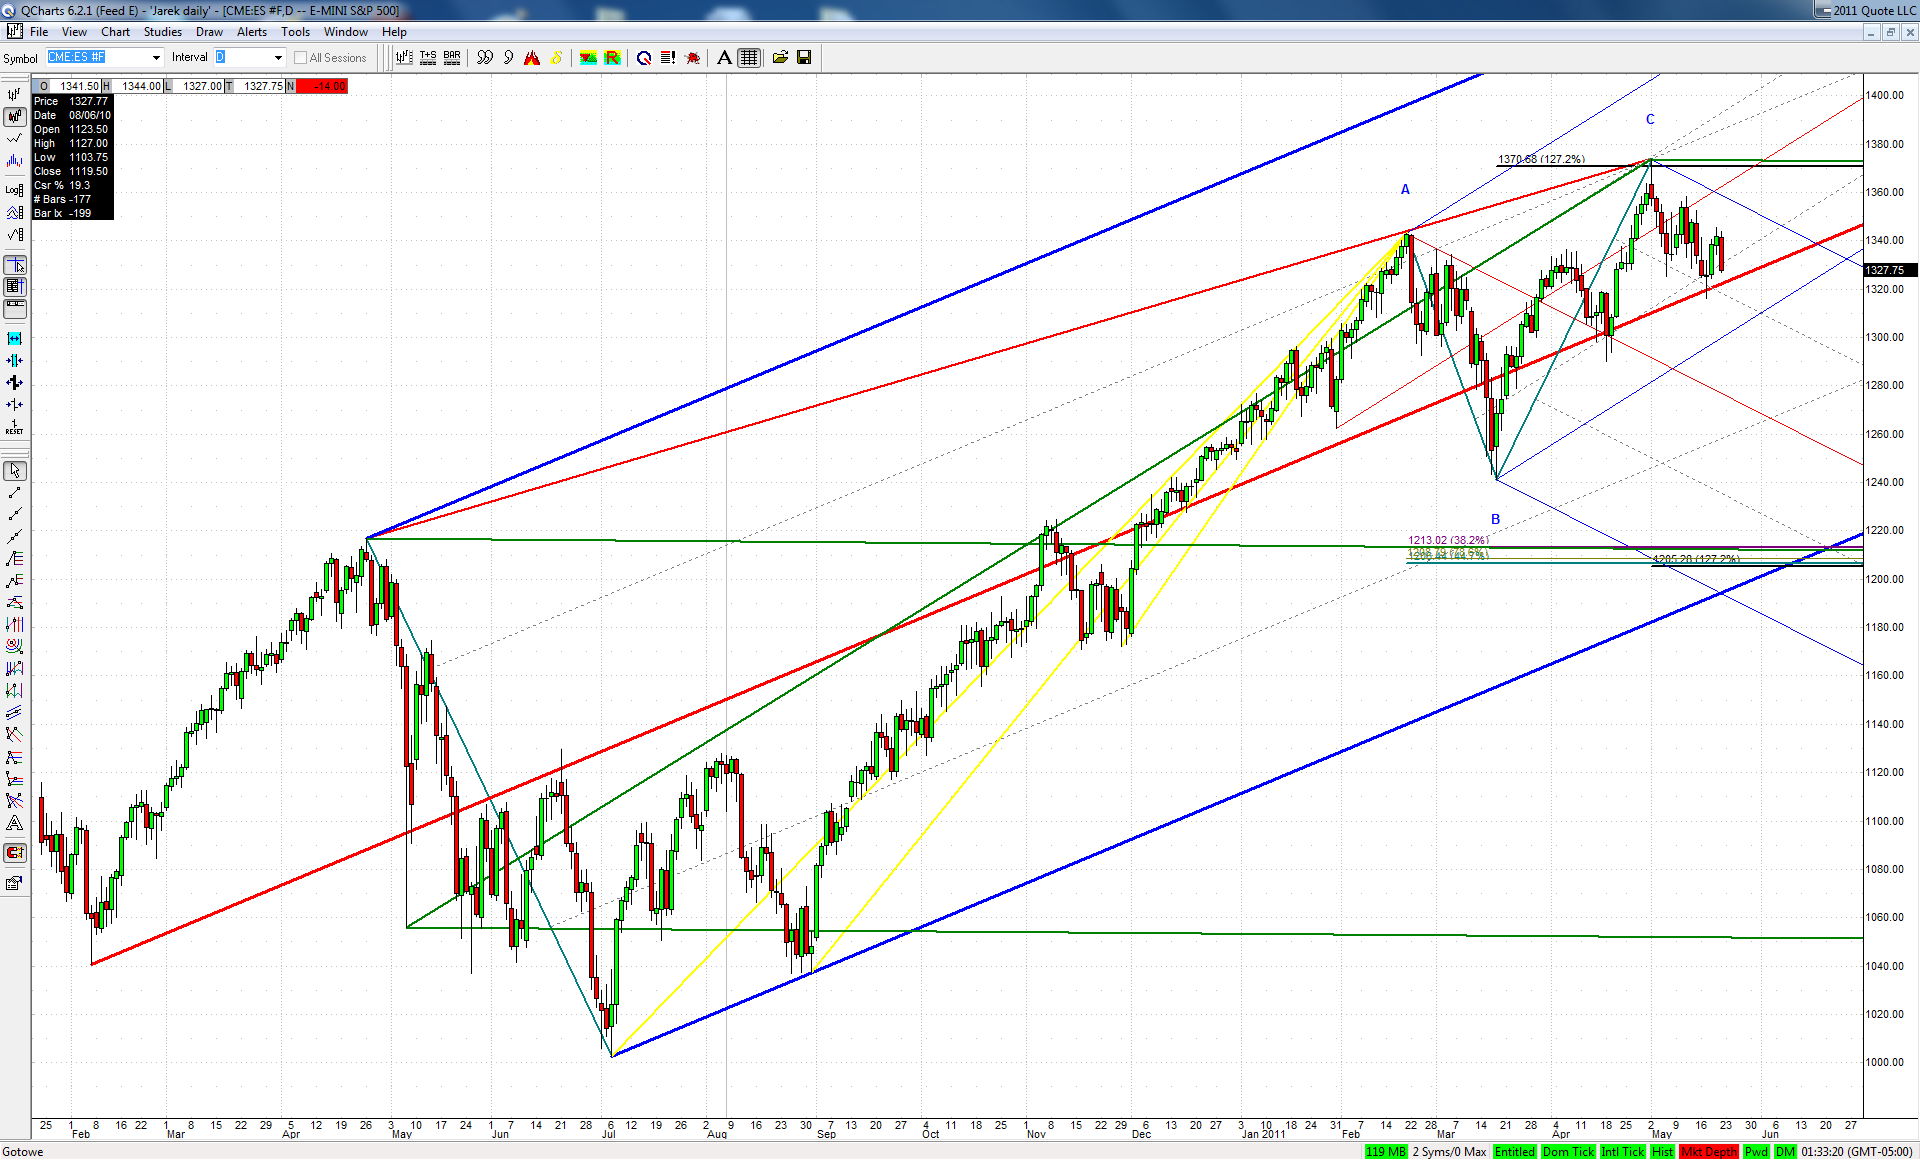
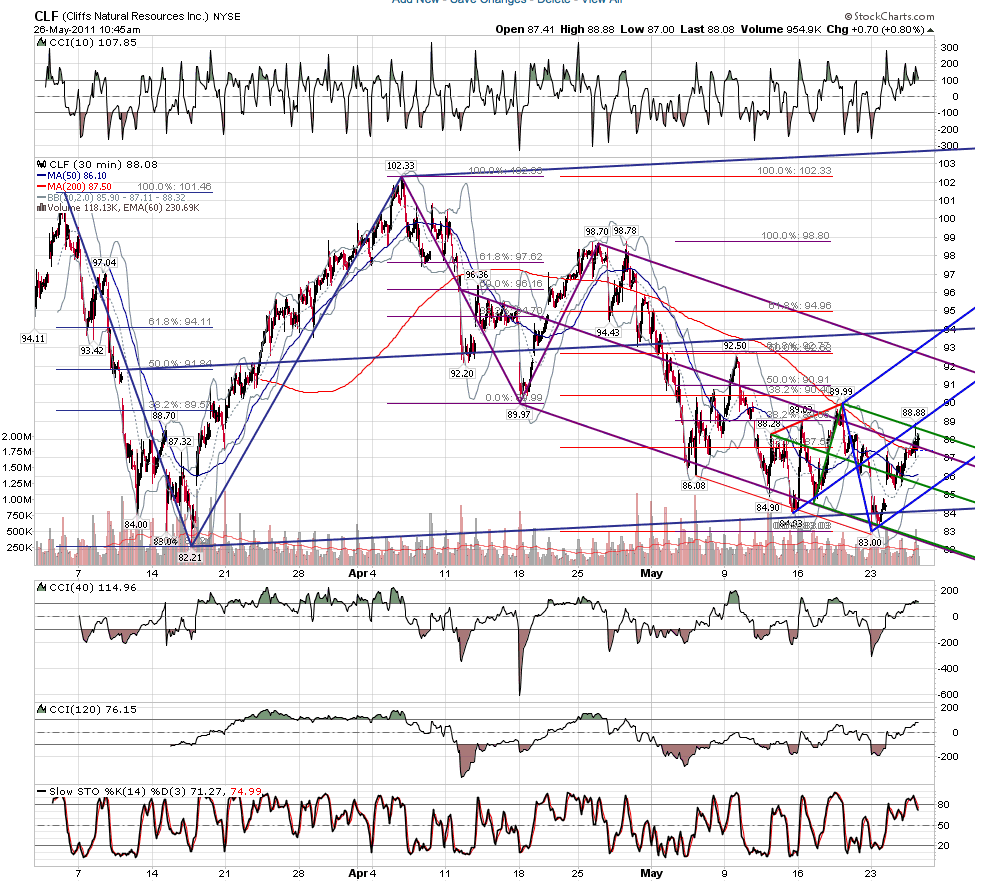
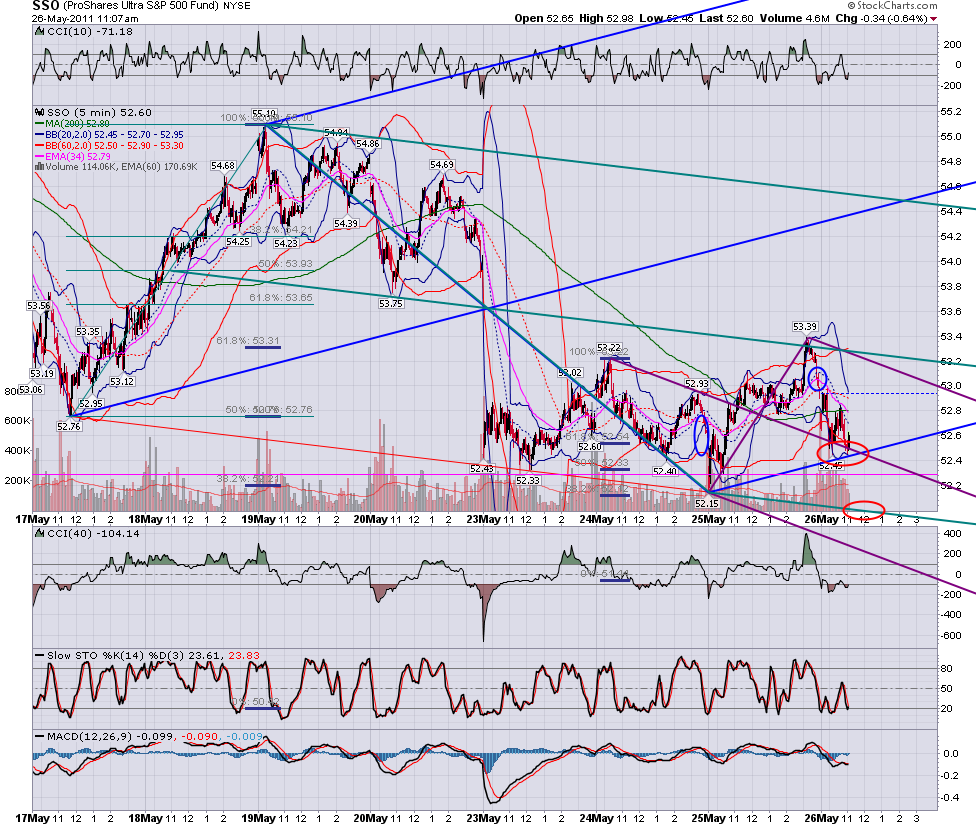
I know this potential drop of 10% in a couple of weeks is hard to conceive for some. But I can't find a better explanation for the corrective nature of the March-May rise
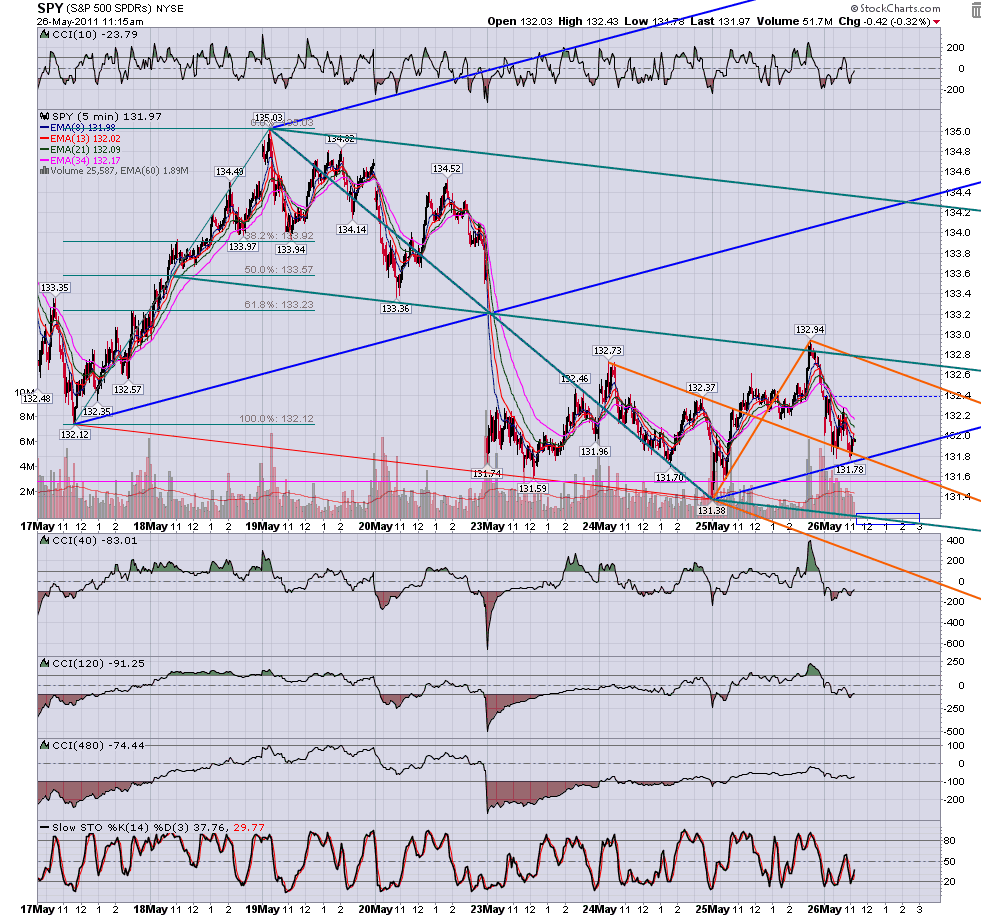
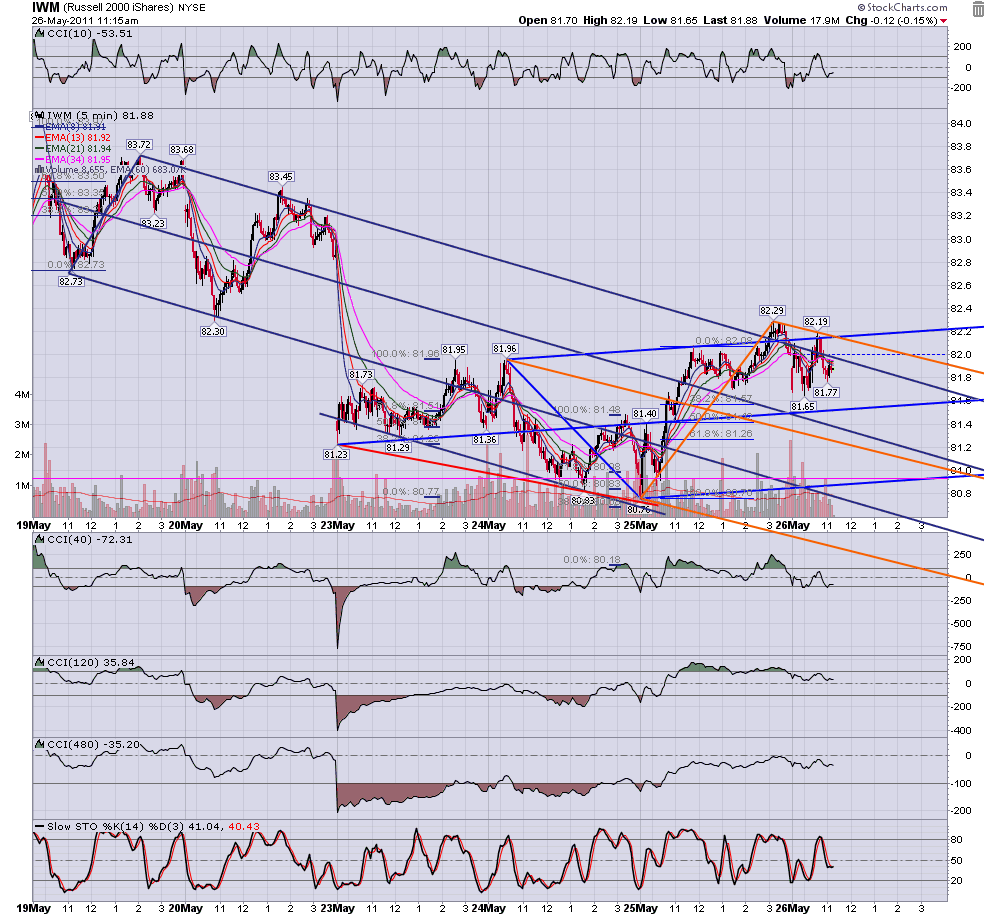
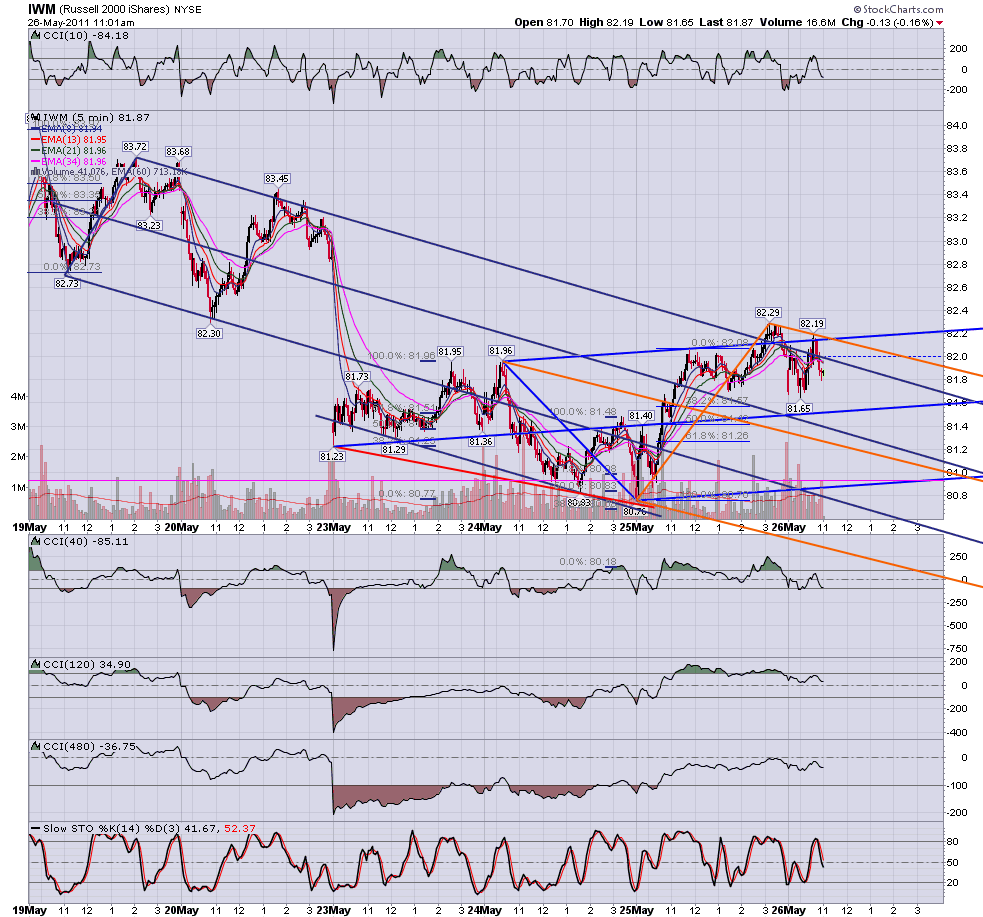
the divergence between iwm and spy has been bothering me...how does spy retest and iwm has so far to go to do the same thing.....do we get an 886 iwm and a 1.128 spy? or something like that to shake long positions out again?
Click image for original size
Click image for original size
JA
jarek
Rep: 94
Posts: 3,474
3
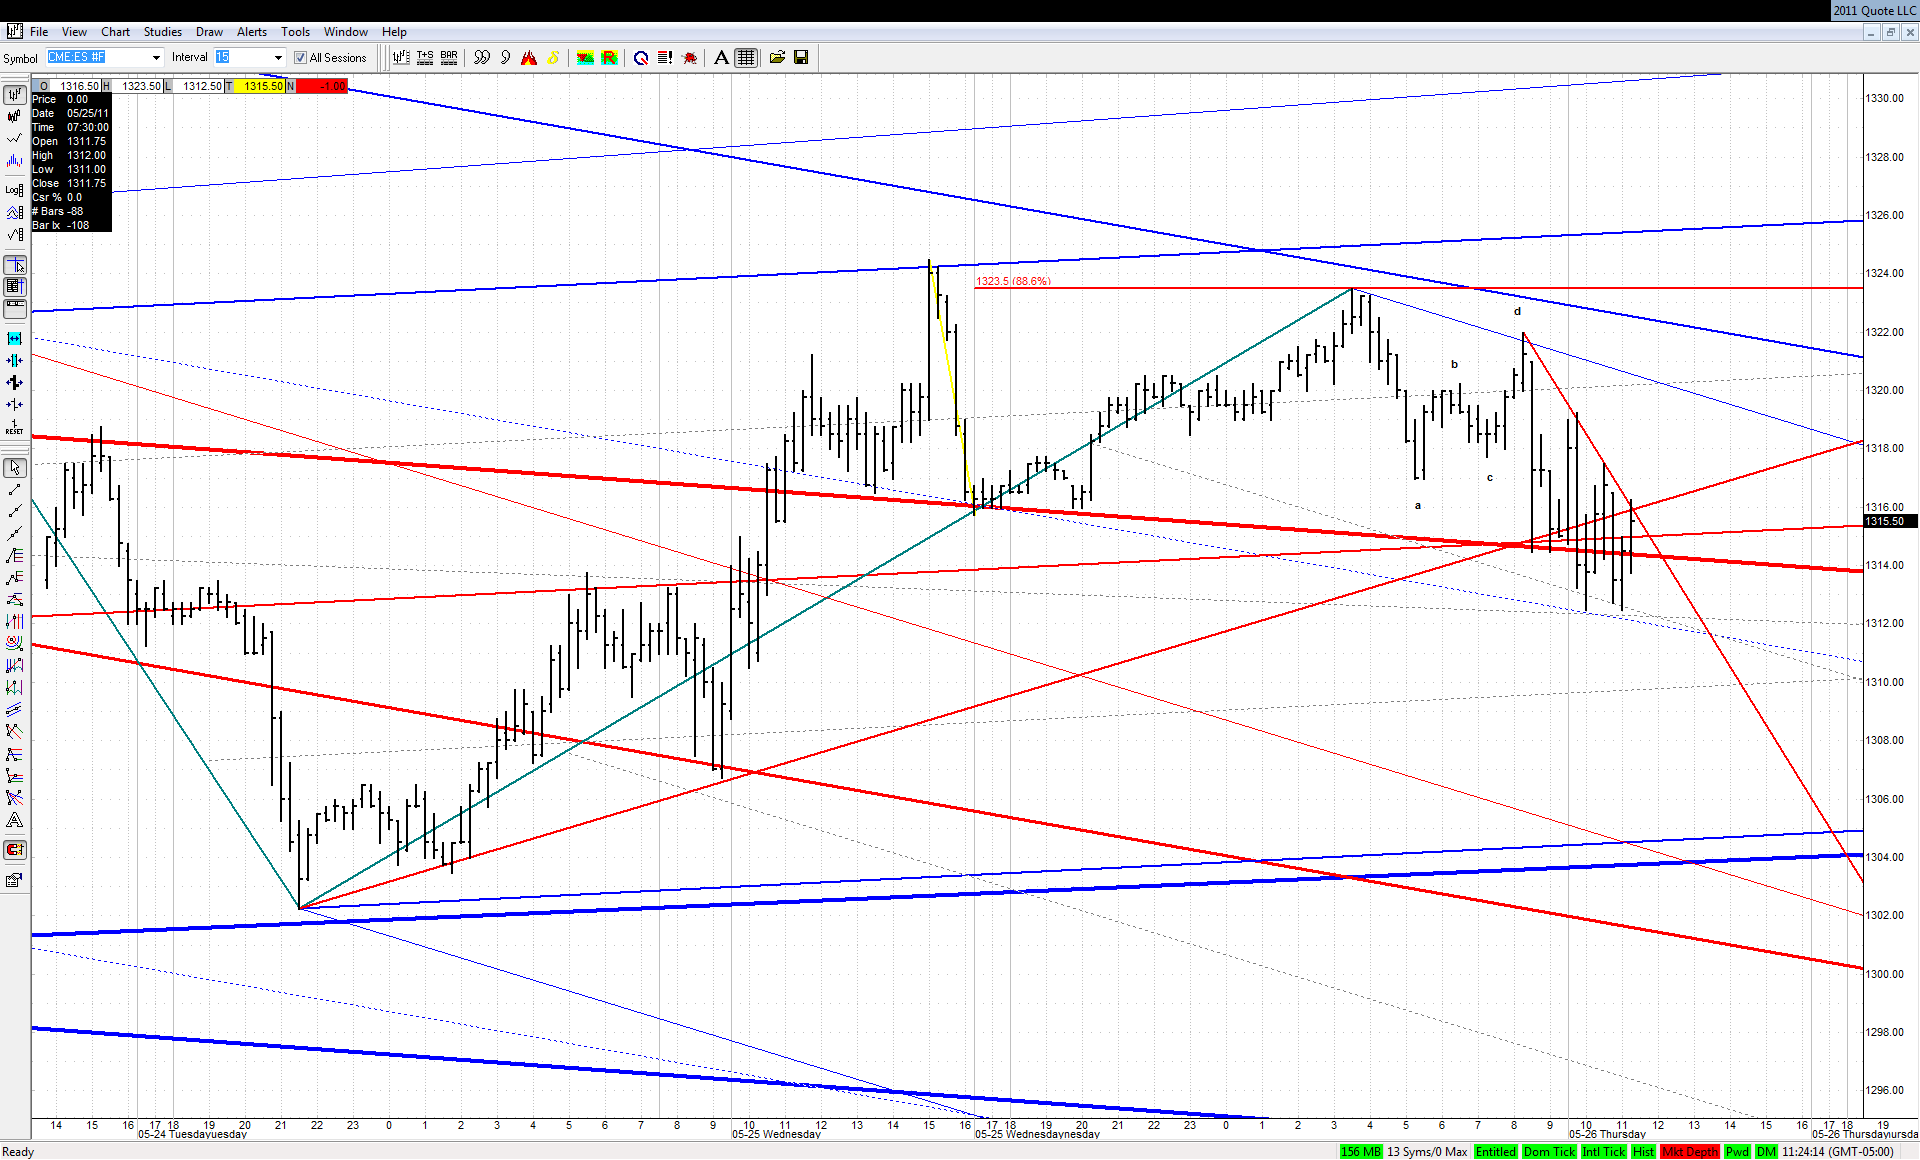
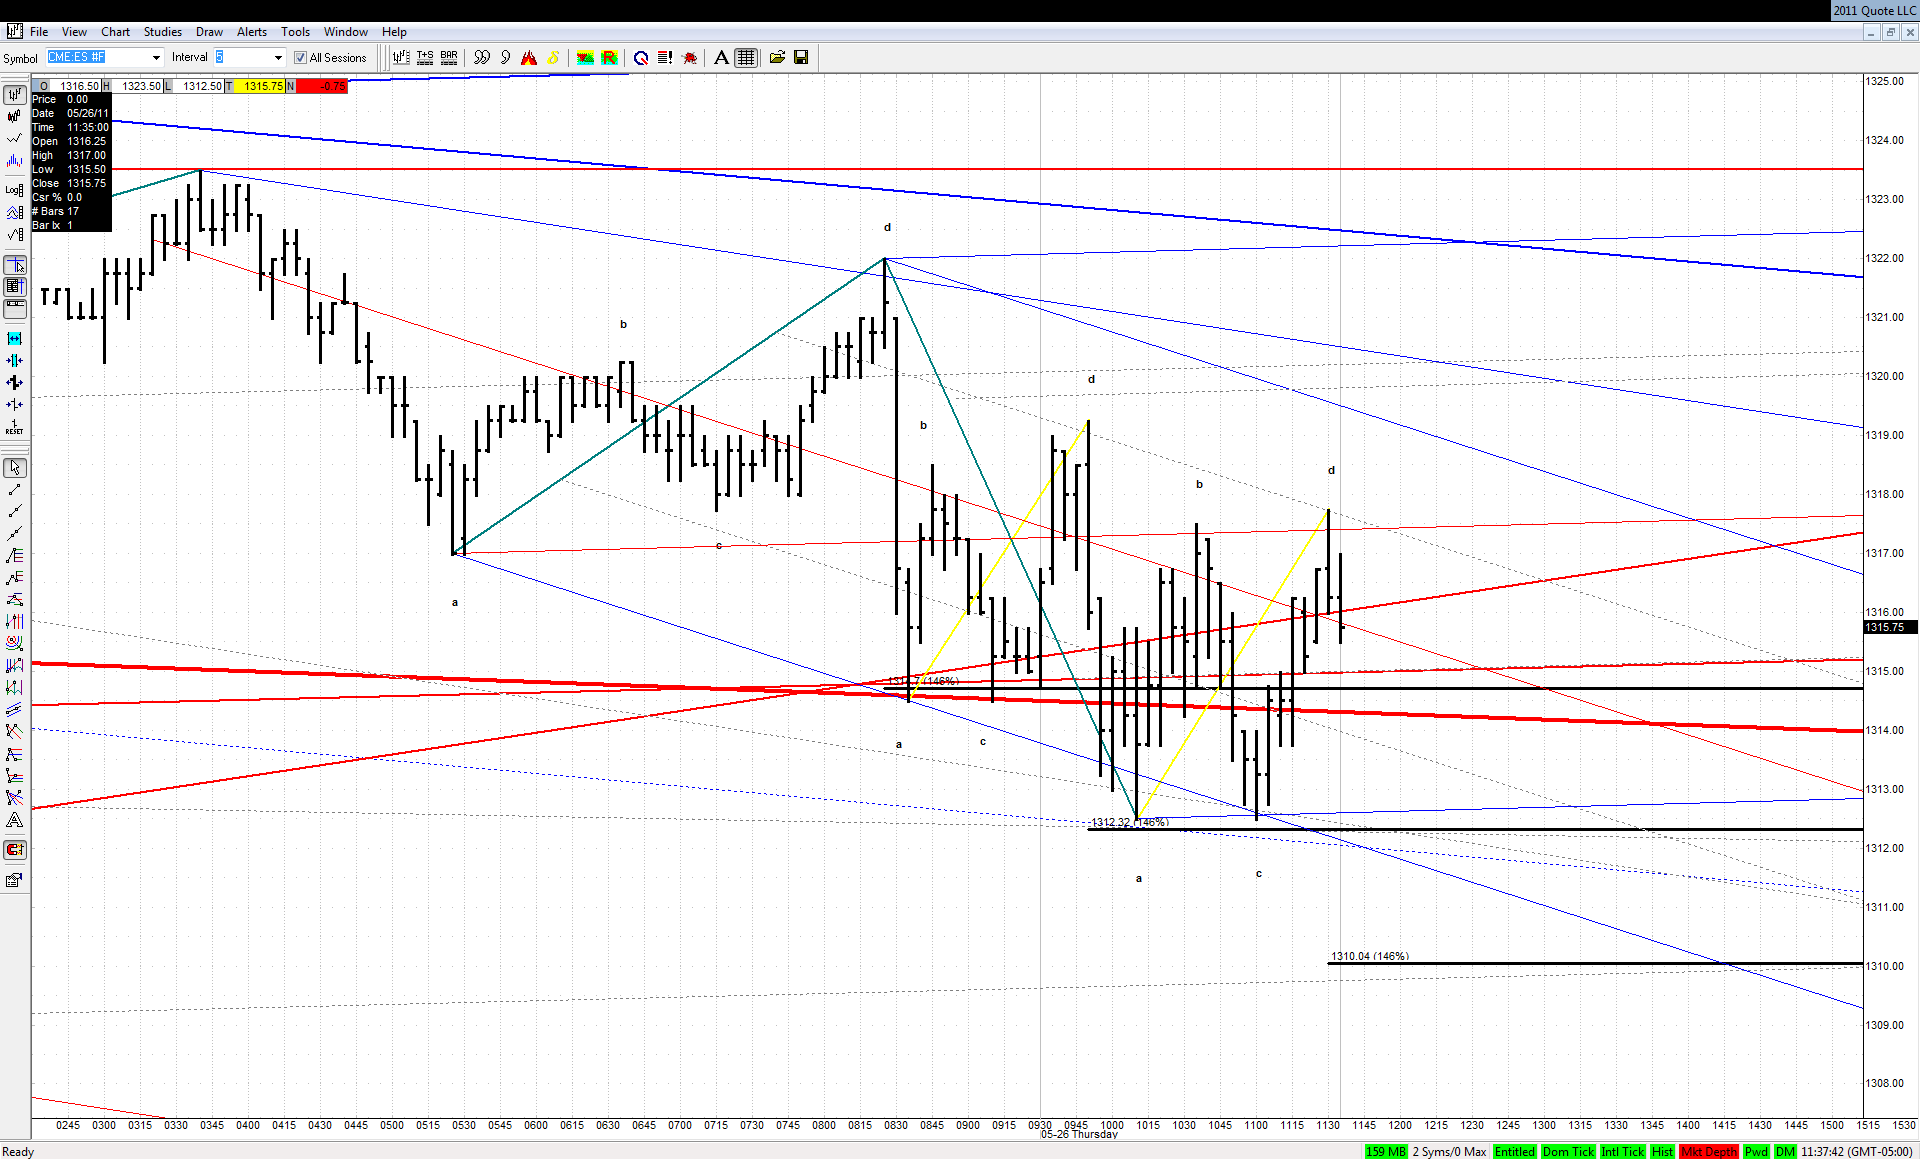
The drop in ES looks all but not impulsive to the downside:
Click image for original size
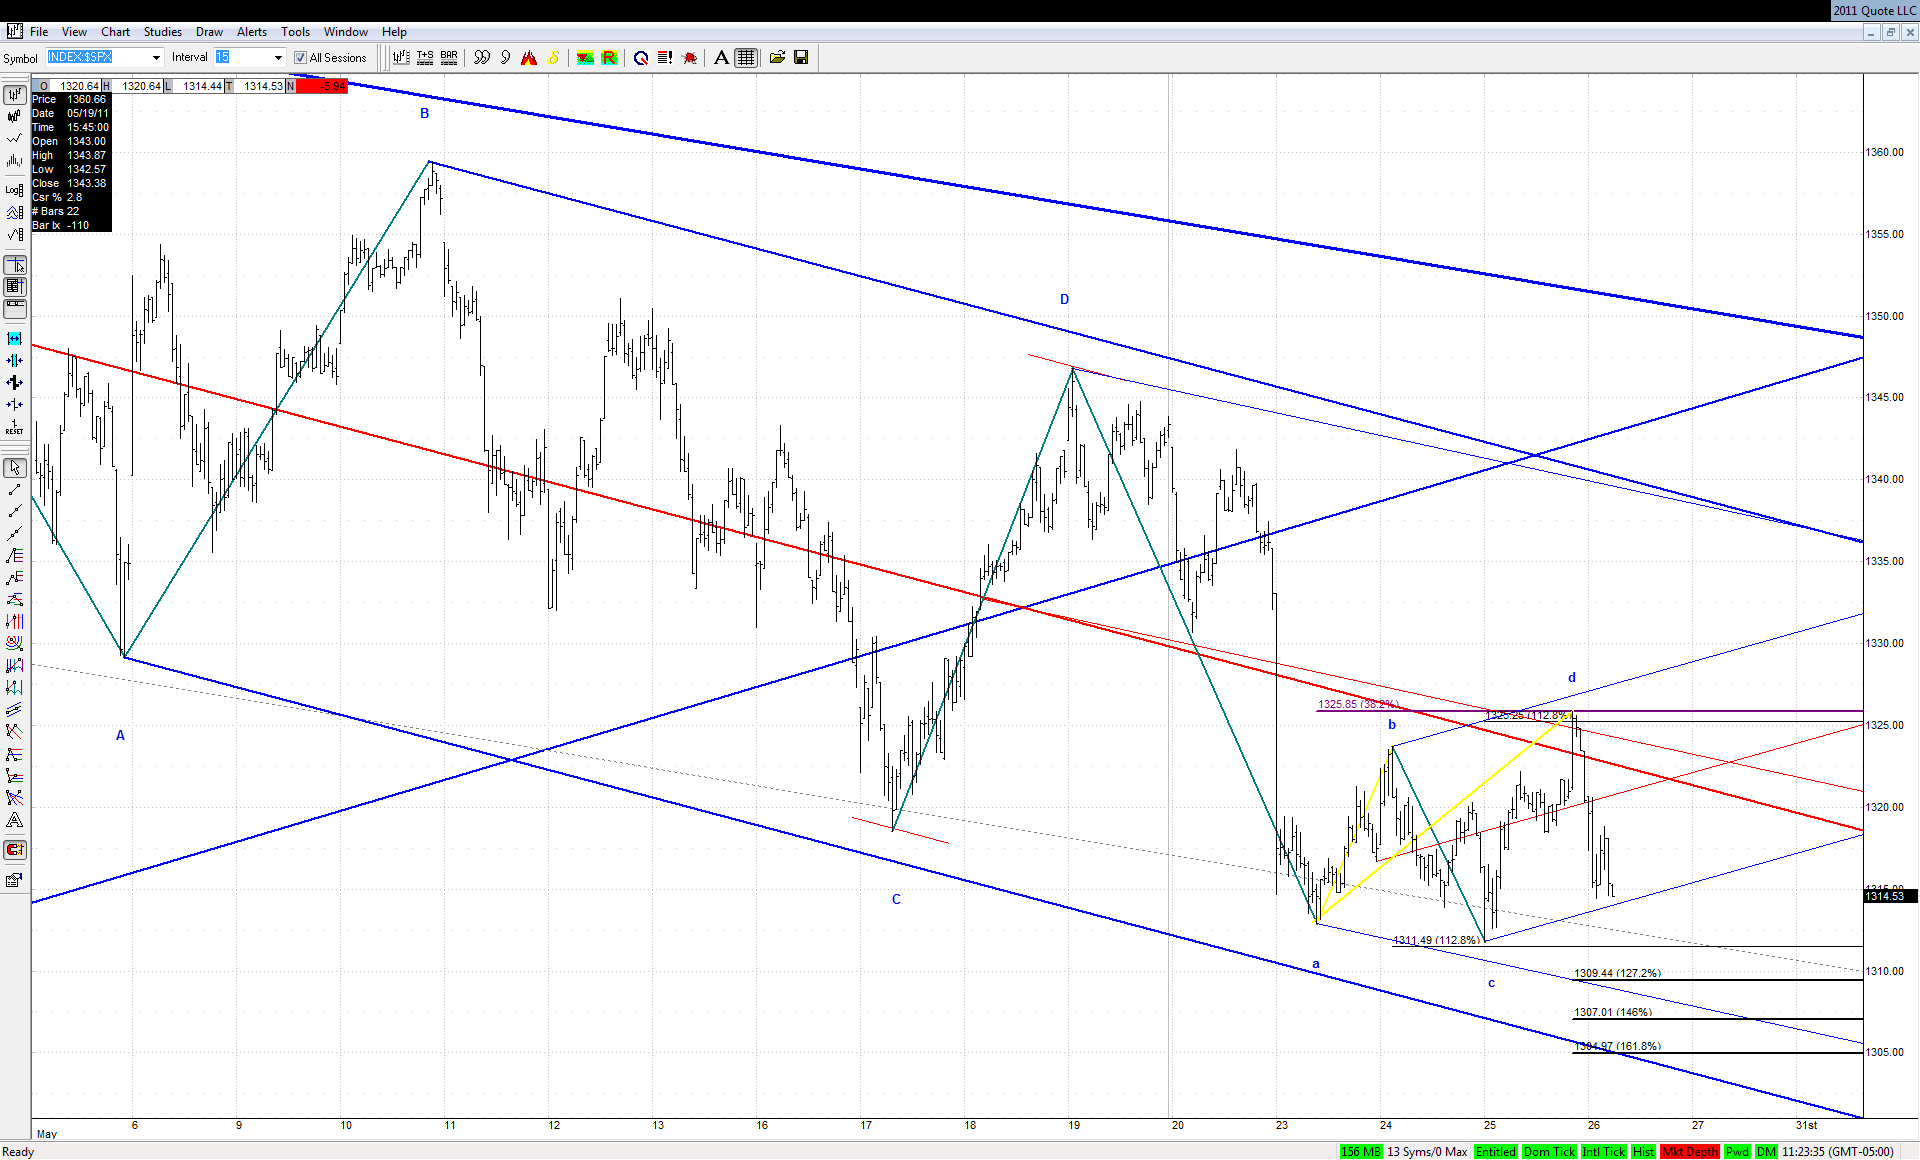
However the bearish .382 EXP ABCD in $SPX hasn't played out yet and chances for this as we know are pretty substantial:
Click image for original size
JA
jarek
Rep: 94
Posts: 3,474
2
(Edited )
2 previous small bearish ABCDs in this move down in ES played out exactly to 1.460:
Click image for original size
How about the 3rd one?
JI
jimkane
Rep: 3,058
Posts: 33,089
3
It may move up now off this 60-min ABCD. You'd have thought if it had that in mind it wouldn't have chopped this much, though.
JI
jimkane
Rep: 3,058
Posts: 33,089
2
Watching 22.50 and 25.75-26.00 areas.
JI
jimkane
Rep: 3,058
Posts: 33,089
3
Watch the 15-min overhead TL coming up, and the set line just over that, to see how it handles it.
Okay, see everyone later. I'll try to do those updates on copper and the Swissie like I mentioned in those sections, and get to jarek's question on that being a KT rocking chair pattern failure setup, some time this weekend.