MyPivots
Sign In
JA
jarek
Rep: 94
Posts: 3,474
Here is the update of my longer term ES chart:

Click image for original size
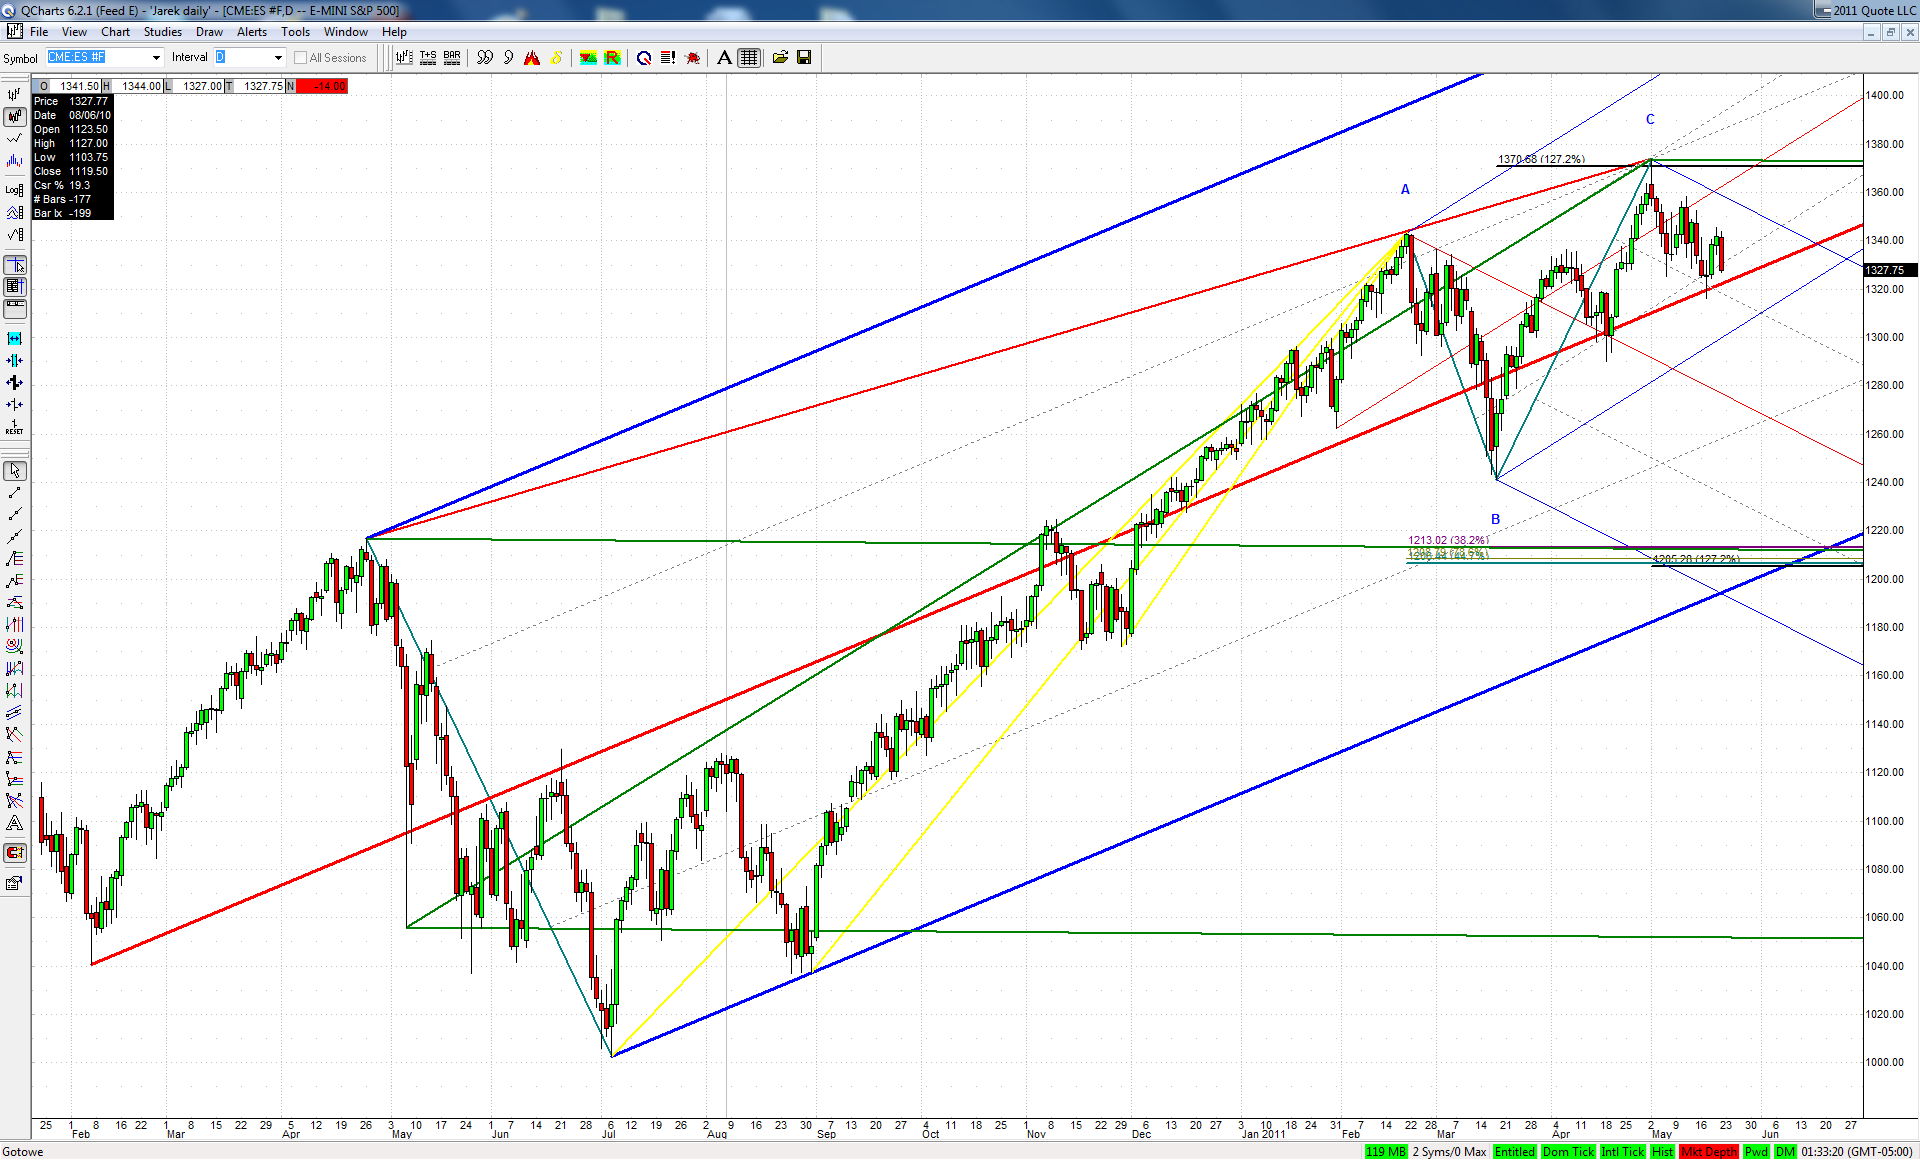

I know this potential drop of 10% in a couple of weeks is hard to conceive for some. But I can't find a better explanation for the corrective nature of the March-May rise
JI
jimkane
Rep: 3,058
Posts: 33,089
CL 'There it is!'
JI
jimkane
Rep: 3,058
Posts: 33,089
Now they can go nuts with 'risk on'.
JI
jimkane
Rep: 3,058
Posts: 33,089
Watching around ES 19.75 and 22.50 next.
JI
jimkane
Rep: 3,058
Posts: 33,089
It goes without saying that is assuming it gets above the 1.128 ABCD here.
JI
jimkane
Rep: 3,058
Posts: 33,089
It's a big clue if they don't, and dump this here. Big clue.

Originally posted by jimkane

Now they can go nuts with 'risk on'.
JI
jimkane
Rep: 3,058
Posts: 33,089
First area hit, as expected. ABCD gives way, as expected. 'Too easy'. These guys are sooooo predictable at times, I feel.
JI
jimkane
Rep: 3,058
Posts: 33,089
Curious how it explodes up, and then stops dead (for now) right at the area I posted, to the tick. Very curious.
JI
jimkane
Rep: 3,058
Posts: 33,089
Hmmm, could that be it? It would surprise me, but it is a possibility.
JI
jimkane
Rep: 3,058
Posts: 33,089
Watch the two main KZ's here.
JI
jimkane
Rep: 3,058
Posts: 33,089
.300/.382 overlap at key line, and it sure 'sees' it. Will that send it up for another leg to the next area?
JI
jimkane
Rep: 3,058
Posts: 33,089
Okay, see everyone later. I'll try to do those updates on copper and the Swissie like I mentioned in those sections, and get to jarek's question on that being a KT rocking chair pattern failure setup, some time this weekend.