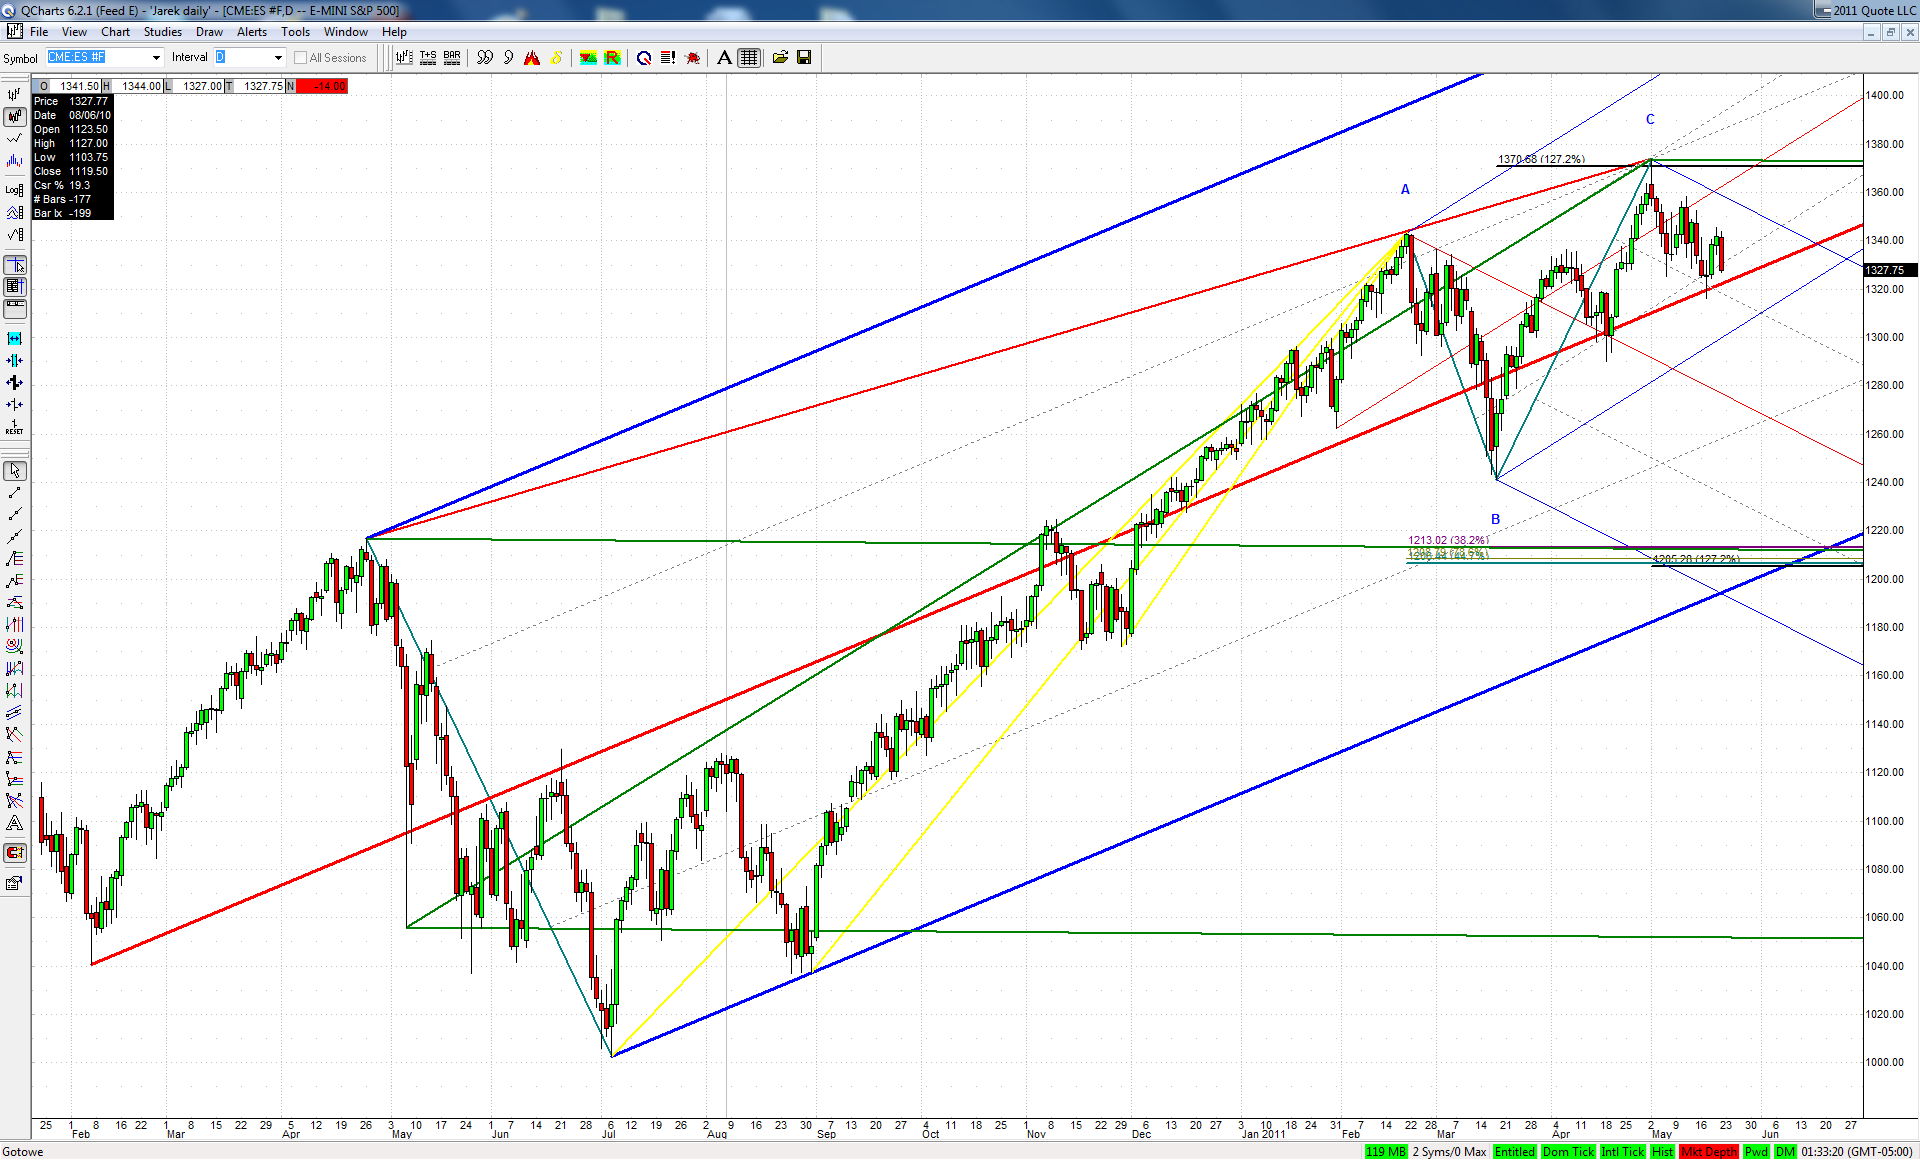
I know this potential drop of 10% in a couple of weeks is hard to conceive for some. But I can't find a better explanation for the corrective nature of the March-May rise
spy 133.87 - 133.23 could project 133.95 - 134.04 into the close if they want to high the 1.128/ 1.27 area
JI
jimkane
Rep: 3,058
Posts: 33,089
3
It does look like they want to run this up off this TL area until the close. Hard to say, given the holiday trading. But, it sure is looking like that in here.
JI
jimkane
Rep: 3,058
Posts: 33,089
2
And if not, this is a great rollover spot here, so watch it closely here for clues.
JI
jimkane
Rep: 3,058
Posts: 33,089
2
(Edited )
KZ off the HOD. Big clue time.
JI
jimkane
Rep: 3,058
Posts: 33,089
1
Last half hour gun for the HOD. I can't imagine they don't get it. I just can't imagine it...
JI
jimkane
Rep: 3,058
Posts: 33,089
1
Right off that frickin' TL area again.
JI
jimkane
Rep: 3,058
Posts: 33,089
1
Yet they check it back hard right off a line...
RA
rat89
Rep: 0
Posts: 7,015
1
right to the kz of this move up too
JI
jimkane
Rep: 3,058
Posts: 33,089
0
Right down to a .447, where it stops dead.
JI
jimkane
Rep: 3,058
Posts: 33,089
1
Oops, I staged that and didn't hit post, and just did now. You had it almost six minutes before I posted...
Okay, see everyone later. I'll try to do those updates on copper and the Swissie like I mentioned in those sections, and get to jarek's question on that being a KT rocking chair pattern failure setup, some time this weekend.