MyPivots
Sign In
JA
jarek
Rep: 94
Posts: 3,474
Here is the update of my longer term ES chart:

Click image for original size
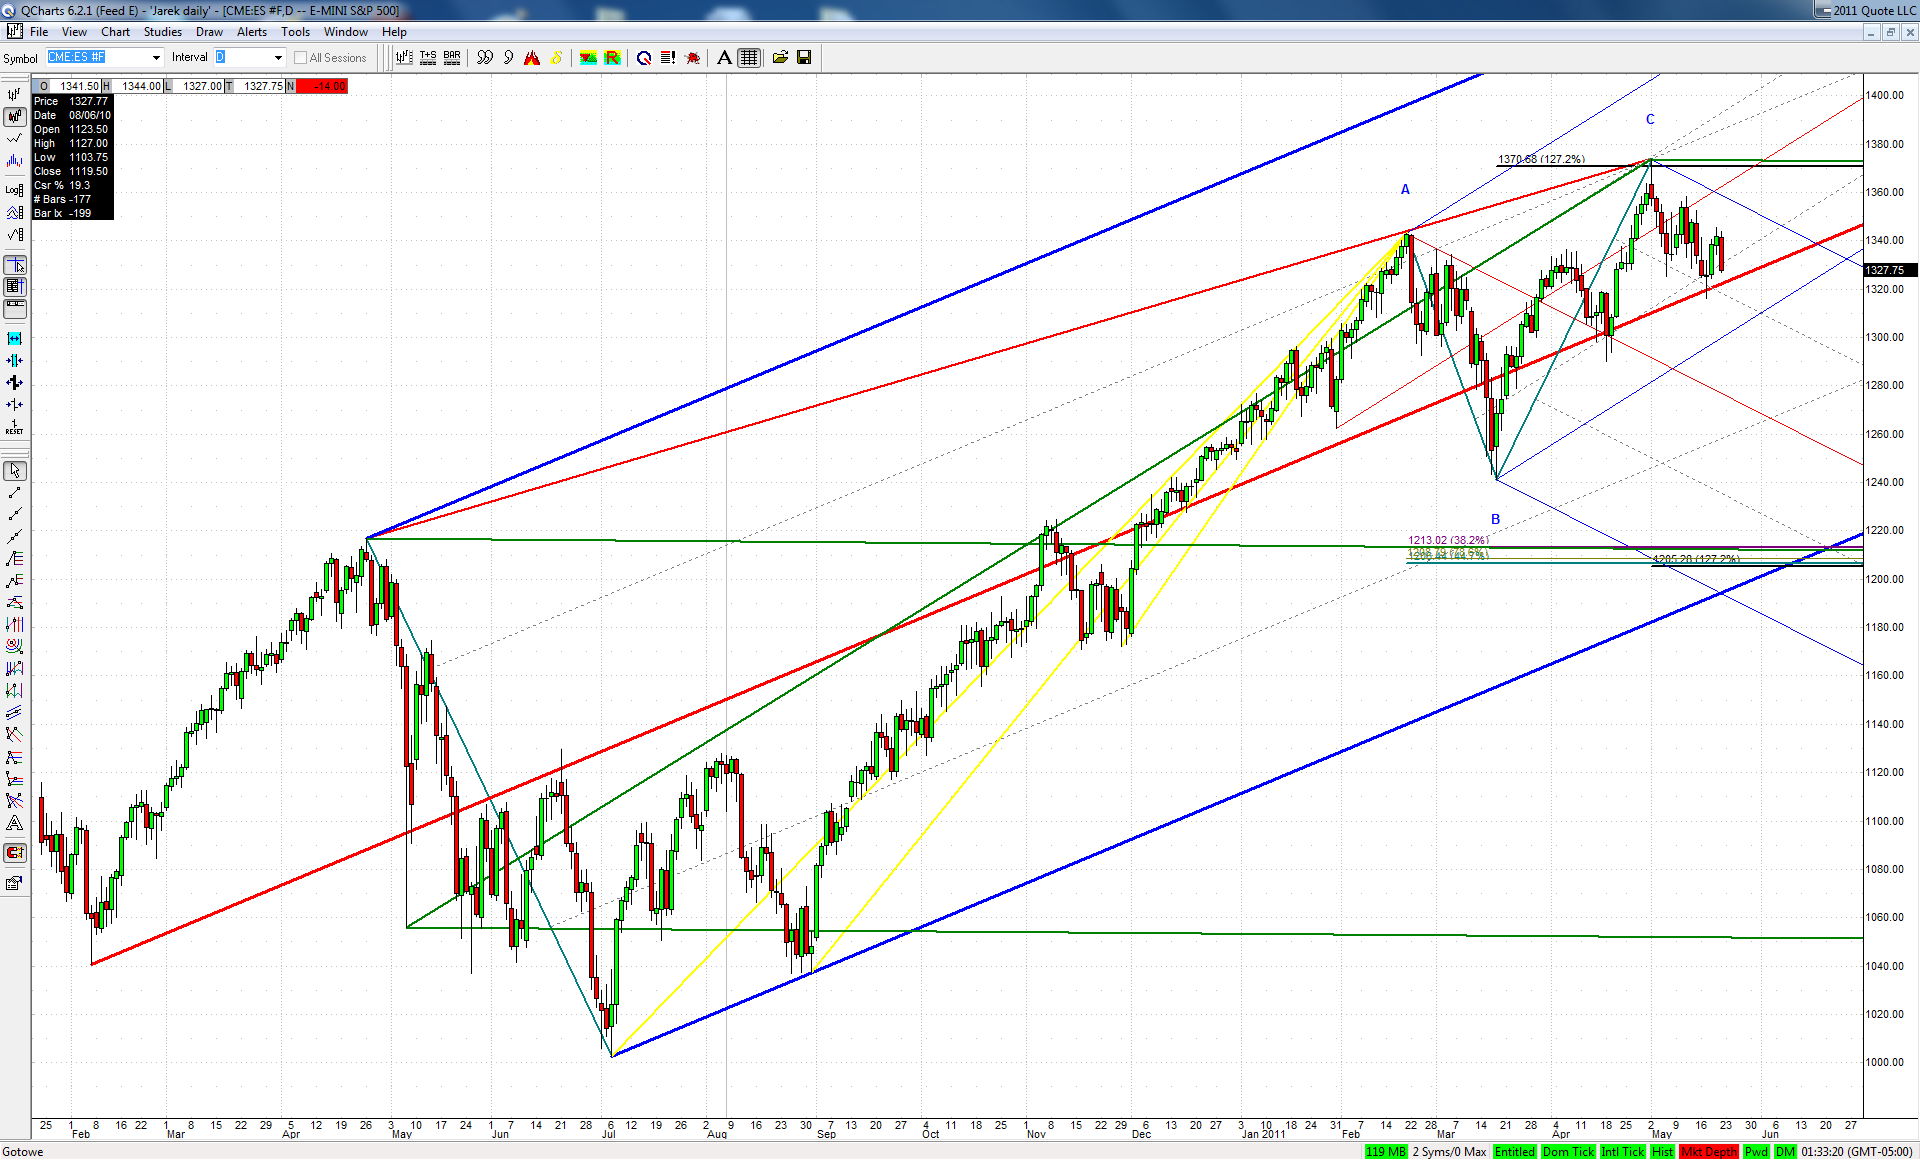

I know this potential drop of 10% in a couple of weeks is hard to conceive for some. But I can't find a better explanation for the corrective nature of the March-May rise
JI
jimkane
Rep: 3,058
Posts: 33,089
Here are my levels on the way down. 19.25, 17.75, 16.00-.50, and 14.50. 16.00-.50 is probably the most intriguing.
JI
jimkane
Rep: 3,058
Posts: 33,089
Honestly, I'm really surprised this is selling. Yes, the volume spike and frenzy on the 1-min was outrageous as all those stops got hammered, but I really thought the odds favored a sell off the primary area before that stop run (although, admittedly, the lines didn't hit tight enough for me to be willing to consider a short off it). I am going to study today's high tonight, since I think I missed something there.
JI
jimkane
Rep: 3,058
Posts: 33,089
18.50 here is my best line in this area. I wonder if 19.25 and 17.75 aren't really the bounds of one area... But, wow, they seem intent on selling this.
JI
jimkane
Rep: 3,058
Posts: 33,089
Here's a change up. Usually, when something happens and I totally expected it, I write this:

Here's my usual look:


Here's my surprised look:


Today, with this selling here, to this degree, I'm more like:

Here's my usual look:


Here's my surprised look:
JI
jimkane
Rep: 3,058
Posts: 33,089
Low 17.50. Second area hit. Best area is that 16.00-.50. 14.00-14.50 also a very strong area.
JI
jimkane
Rep: 3,058
Posts: 33,089
Okay, next area hit. Cutting through them like a hot knife through butter. Amazing selling.
JI
jimkane
Rep: 3,058
Posts: 33,089
Let's see what it does with this much more serious 16 area. Here and the area below are the two for 'trend continuation'. Any drop lower doesn't necessarily imply downtrend continuation on the higher timeframe, as a 'W2' would be deeper than here (but it seems odd to me it didn't bounce higher before a 'W2', see my note on trade management in Marcin's currency area, when I get to it). But, if this is to show strength, that would have to be at one of these two remaining levels. Hard to imagine there could be strength left after that sell-off. Very, very interesting action.
JI
jimkane
Rep: 3,058
Posts: 33,089
I didn't have the work. The area was super-clear. I will follow up on this, with chart, later. I will also add in a little story about some discussions I've had with a long-term student, and how I made the same 'mistake' on this as I had discussed in talking with him. I'm willing to air my 'faux pas', so to speak, here for all to see, to show sometimes I miss things, sometimes I don't have my work done, and in this case, it missed me an awesome potential trade. Check back later for my follow up.

Originally posted by jimkane

Honestly, I'm really surprised this is selling. Yes, the volume spike and frenzy on the 1-min was outrageous as all those stops got hammered, but I really thought the odds favored a sell off the primary area before that stop run (although, admittedly, the lines didn't hit tight enough for me to be willing to consider a short off it). I am going to study today's high tonight, since I think I missed something there.
TX
tx_ches
Rep: -10
Posts: 514
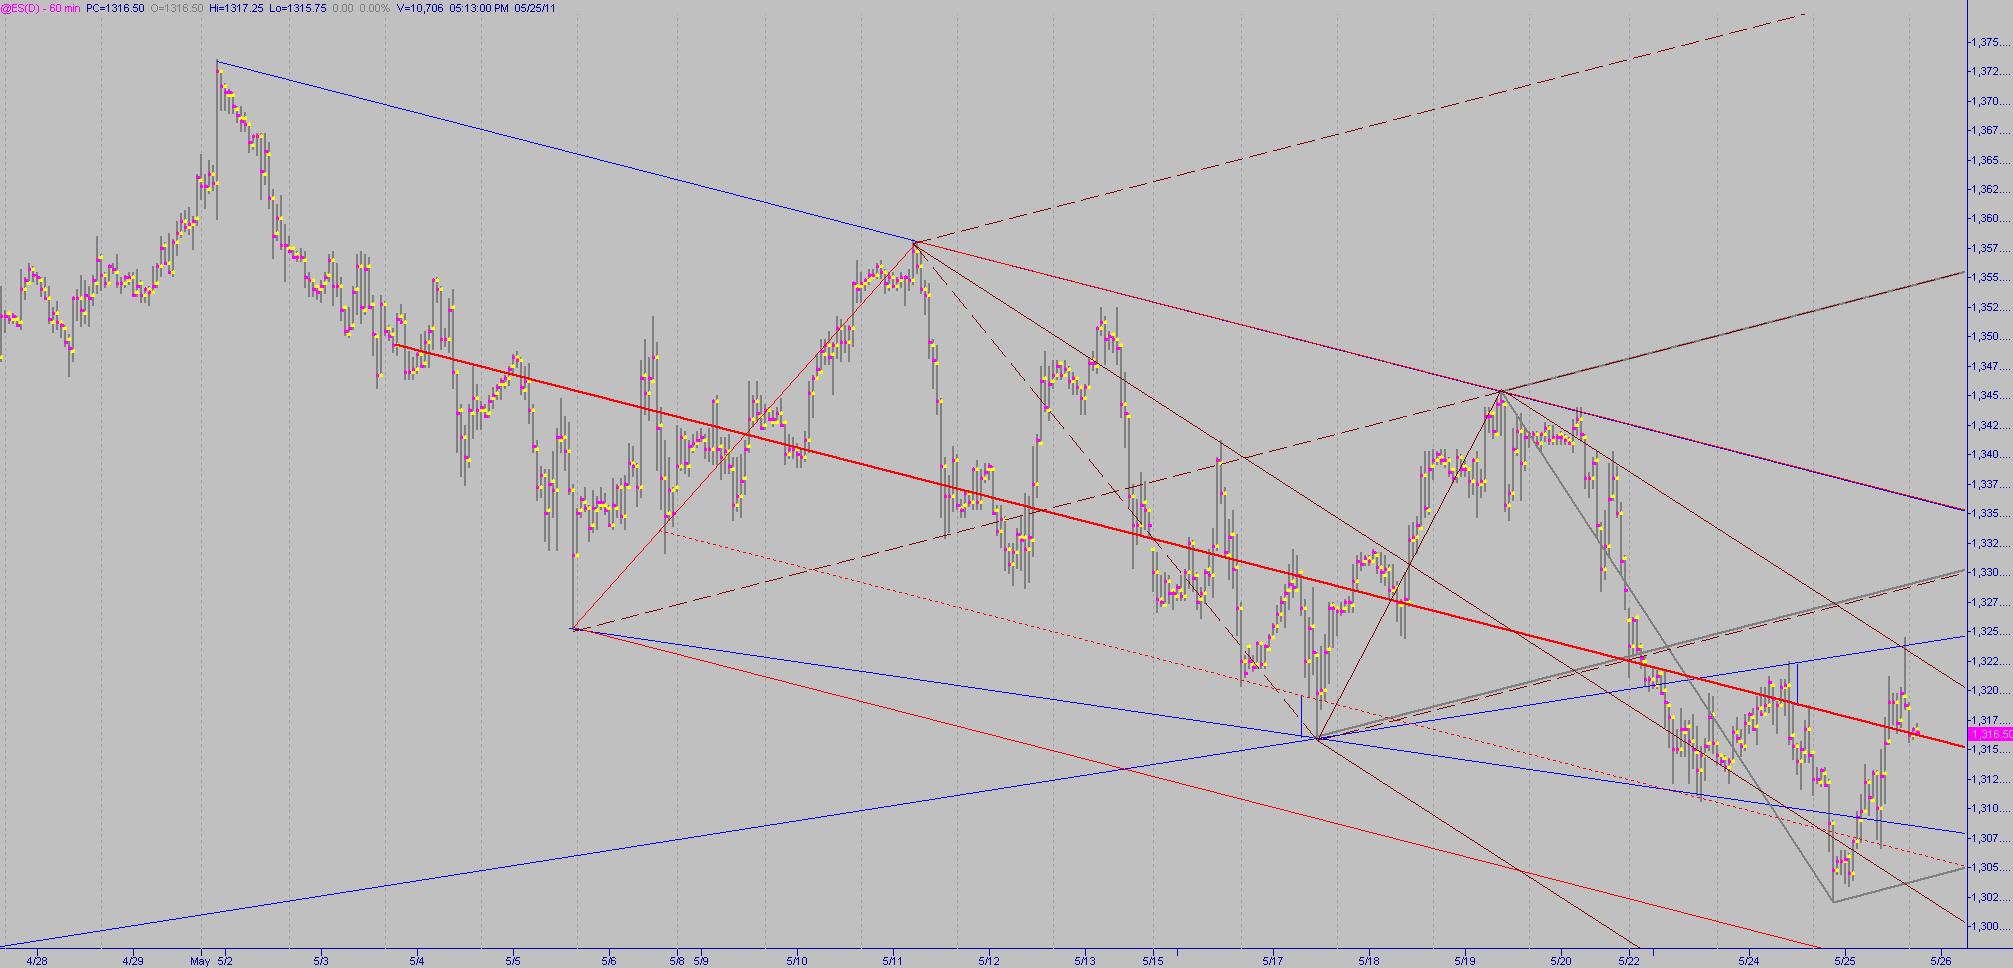
I found the TL that I missed yesterday in Jim's comments.
ES 60 minute

I also found some sets that Jim may or may not have on his chart later.

The upsloping gray set overlaps with the dashed brown set. It doesn't seem to be in play but its overlap is interesting. May be due to the ab=cd at the LOD. And time extension on ab-127 and on bc-190.2

Click image for original size
TX
tx_ches
Rep: -10
Posts: 514
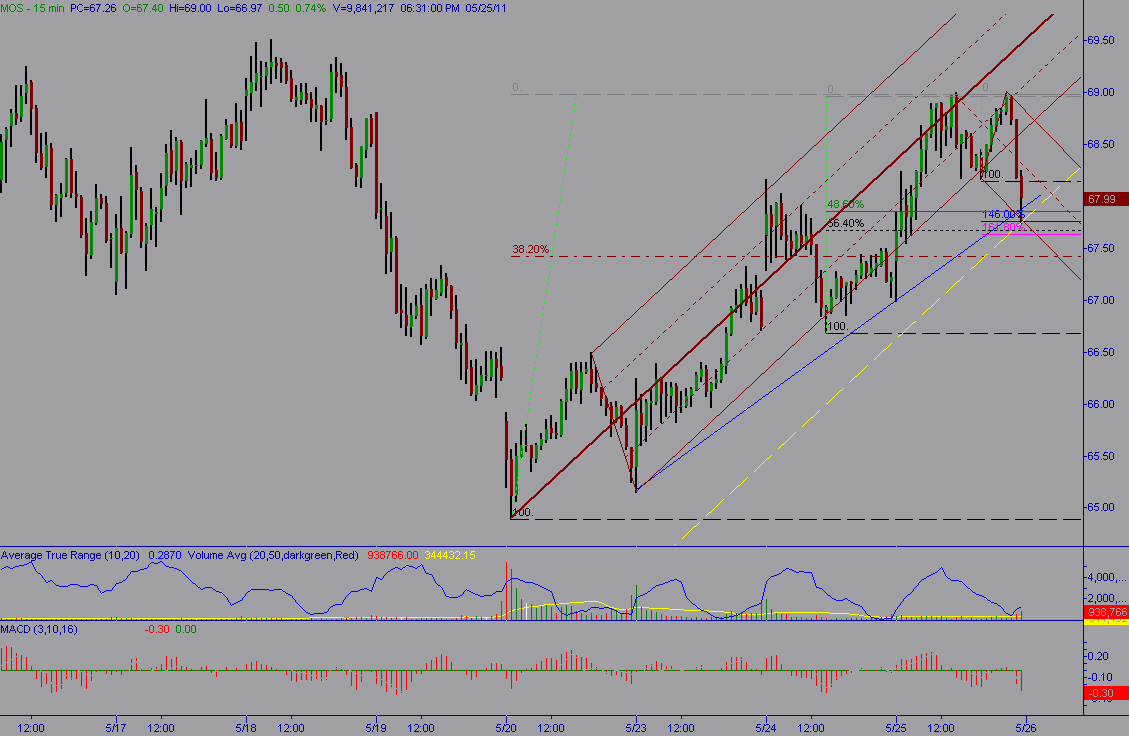
MOS 15 minute.
Might be a bull DT abcd. Something to watch on the open.

Click image for original size
JI
jimkane
Rep: 3,058
Posts: 33,089
Okay, see everyone later. I'll try to do those updates on copper and the Swissie like I mentioned in those sections, and get to jarek's question on that being a KT rocking chair pattern failure setup, some time this weekend.