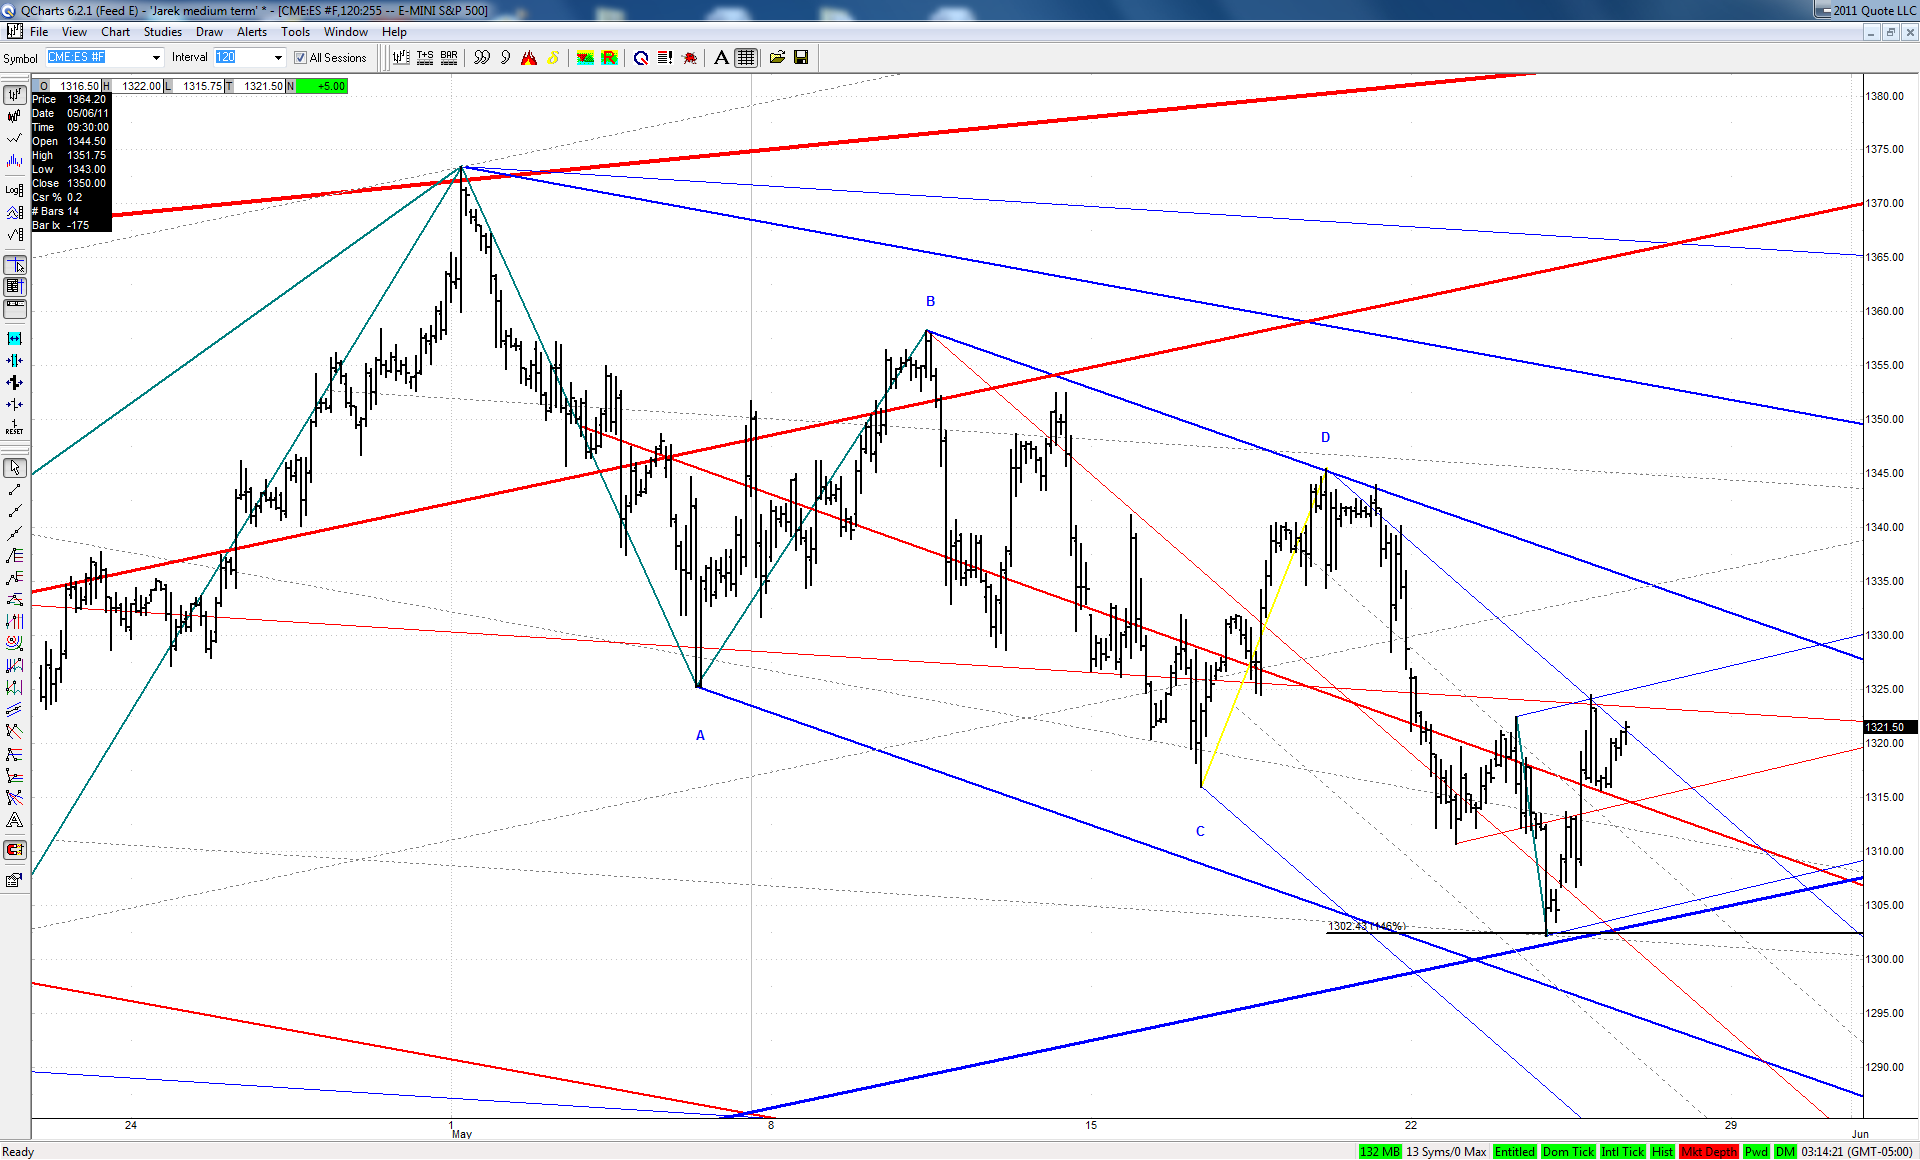
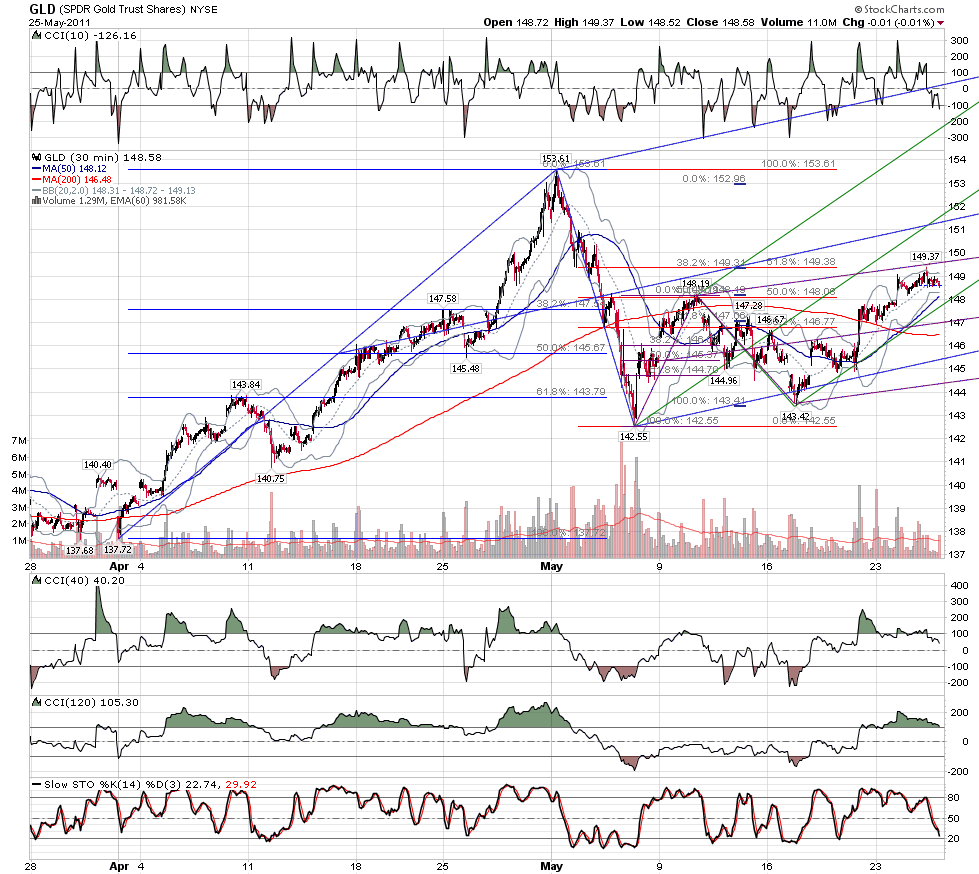
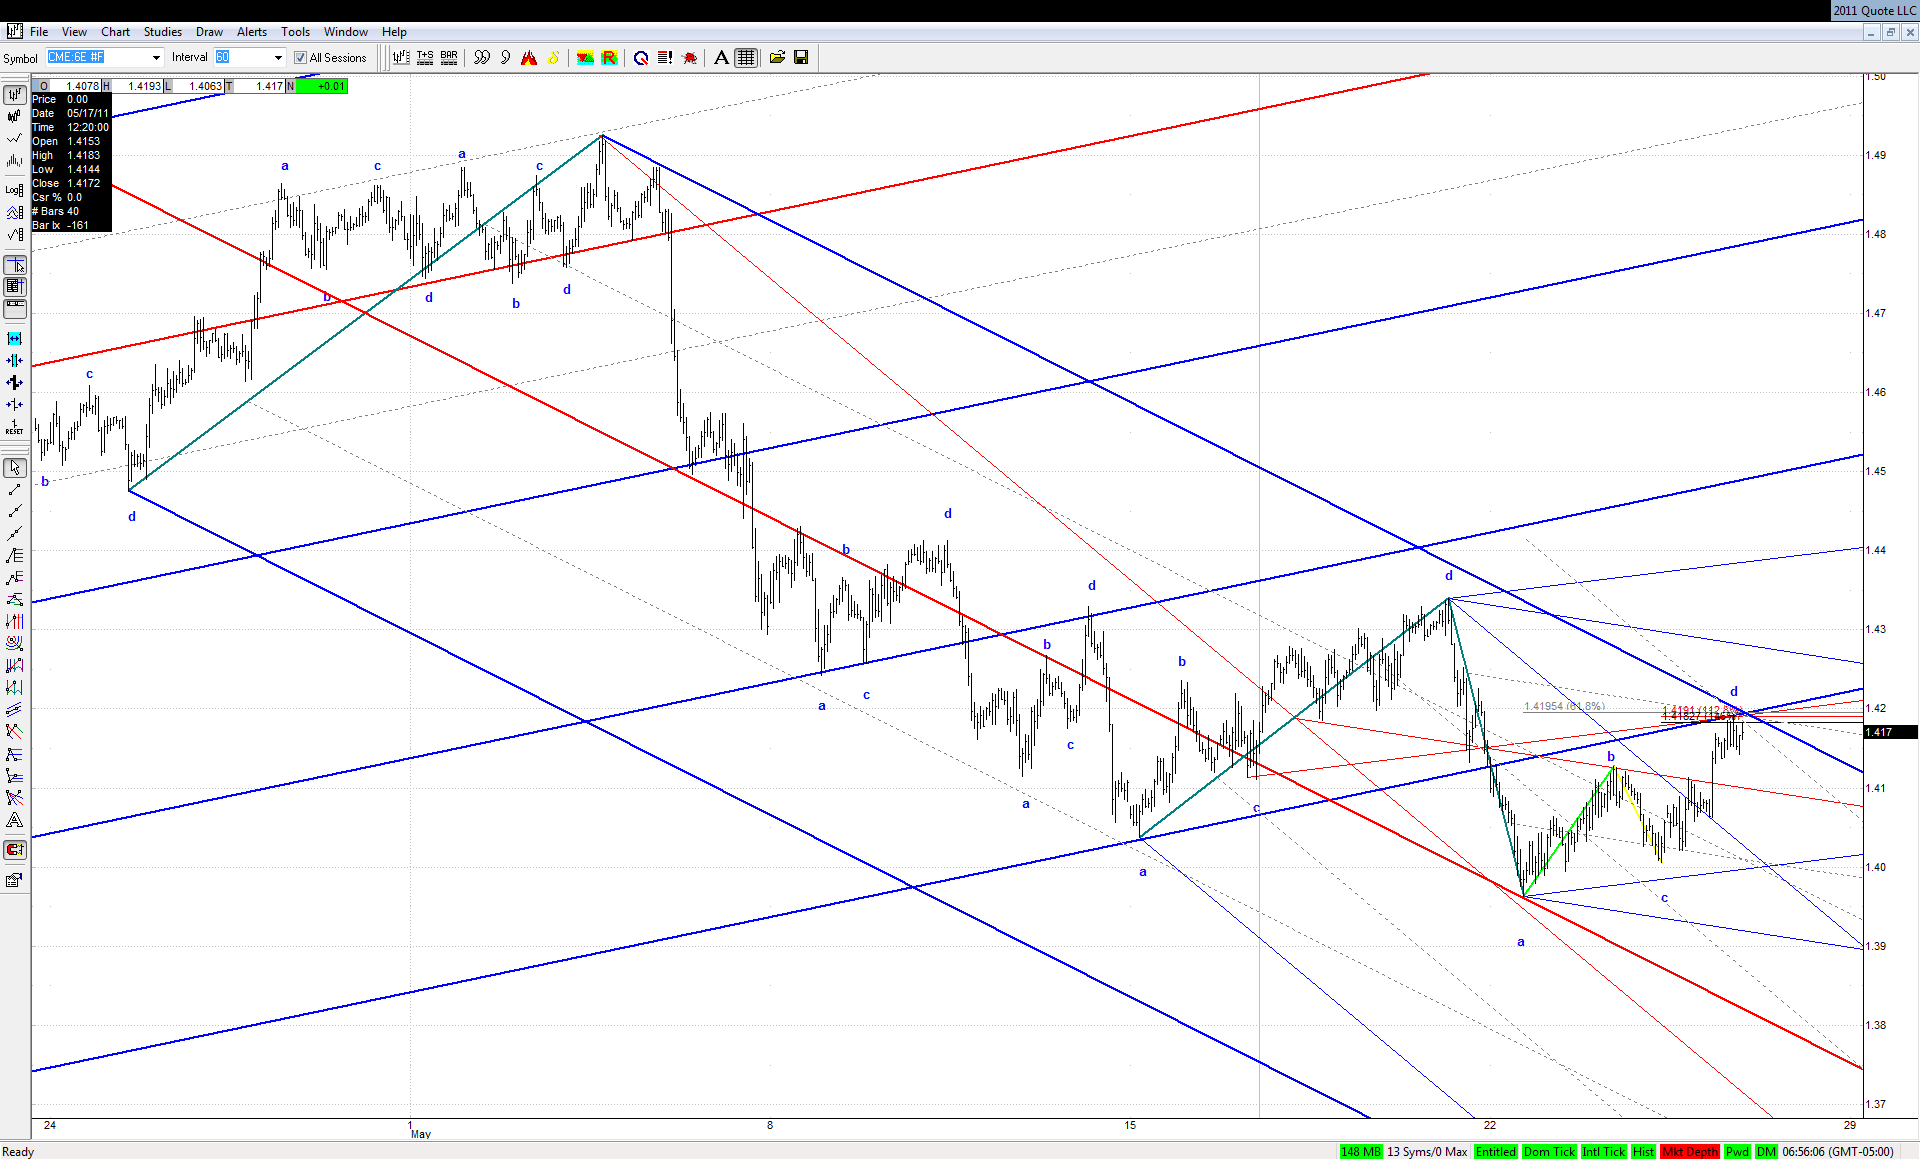
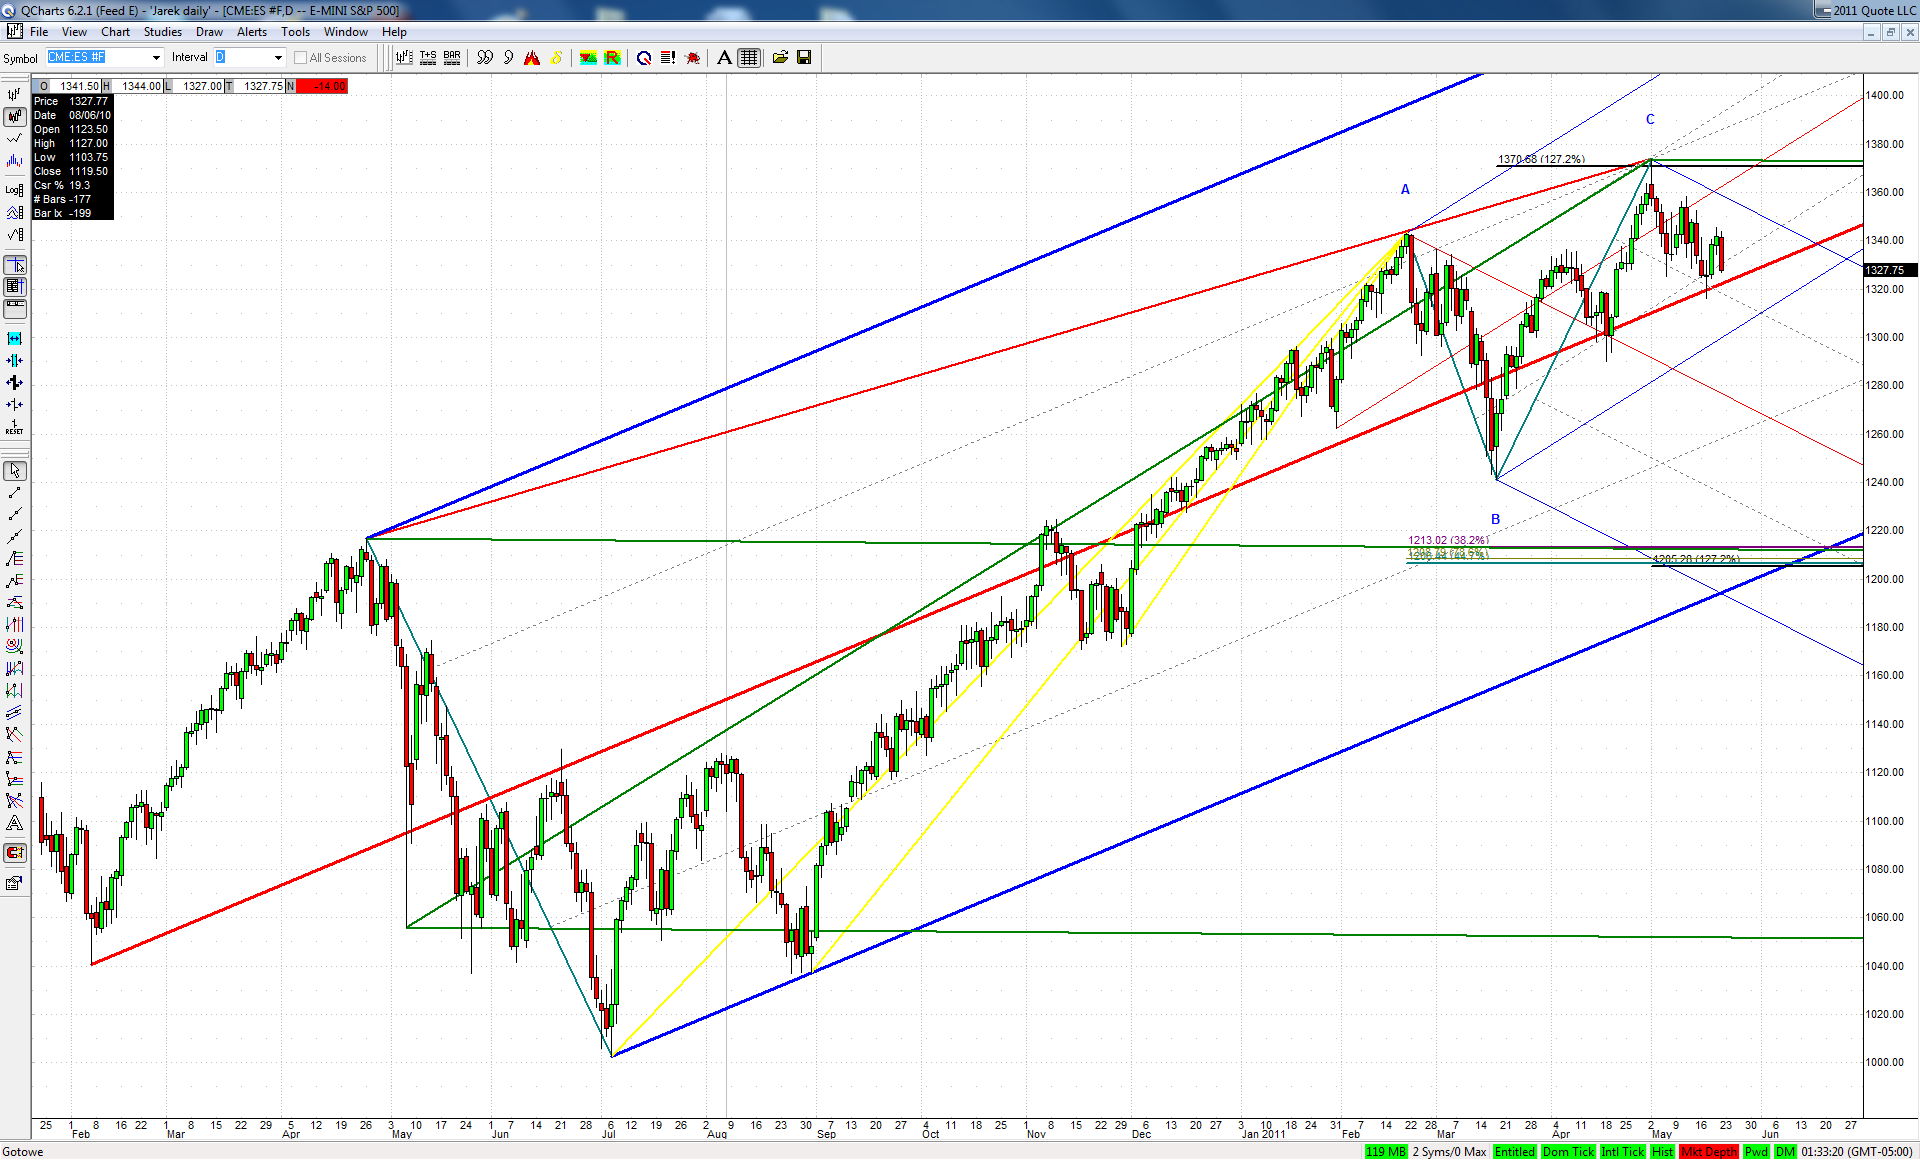
Here is the update of my longer term ES chart:
I know this potential drop of 10% in a couple of weeks is hard to conceive for some. But I can't find a better explanation for the corrective nature of the March-May rise
JI
jimkane
Rep: 3,058
Posts: 33,089
Okay, let me take a shot at this, and try not to make the post a million words, or more. Here's the very brief story about the discussion with my one student. Basically, to sum it up, we talked about how critical it was, to use this methodology (and many others), to come to the table every day with your work done. Areas clearly laid out, scenarios in mind, just all around prepared. This is a methodology that is work based. Some aren't. This one is.
Most of the time, I feel, I have my work done, and done properly, as I define it. I thought I had done that today. I didn't understand why I couldn't get things to line up for that first area. I could see some things there, but no spectacular confluence. Hence, I was very wary about shorting against it. Then the big burst up, the stop run, and into an area I didn't have any reason to sell against. So, I sat there and watched it get pommeled, just crushed. I couldn't understand why it would sell so hard and it wasn't a primary area.
Now, I am not making any claims, just voicing an opinion, but in that opinion I rarely get taken by surprise by 'big' moves that don't come from areas I might expect such a move. I'm not saying I catch them all (far, far from it), since they require entry triggers, adequate 'context', hitting right into the area, preferably price action I like, and I have to be there, ready to go, and do the right thing at the right time, and so on. That leaves trading reality as far as moves caught. But, I am rarely surprised by a move 'out of nowhere'.
So, when I took a blank chart and did a fresh workup on this one, not an after-the-fact I know something is there so let me curve fit some work, but a fresh, do my usual routine workup, I almost puked. Give me a break, how could I not have this work, not have been ready? Easy. I'm watching too much, sleeping too little, and battling health issues that have me far from alert and strong all the time. That's just reality. But, bottom line, I didn't have the work done. Or done properly. I cost me a great potential trade.
I'd like to feel that I don't often miss things. Given the posts I make in here, I think I've shown most of the time I don't. It may be partly because I have some great tools, but I feel it is even more so because I work so frickin' hard all the time, doing the work, double checking it, reviewing it, and so on. I come to the table ready to go, work in hand. I thought I had the work today, but I didn't clean up and review my 120-min chart the way I should have. I dropped the ball, totally. I was not a 'consummate professional' today. I wasn't ready...
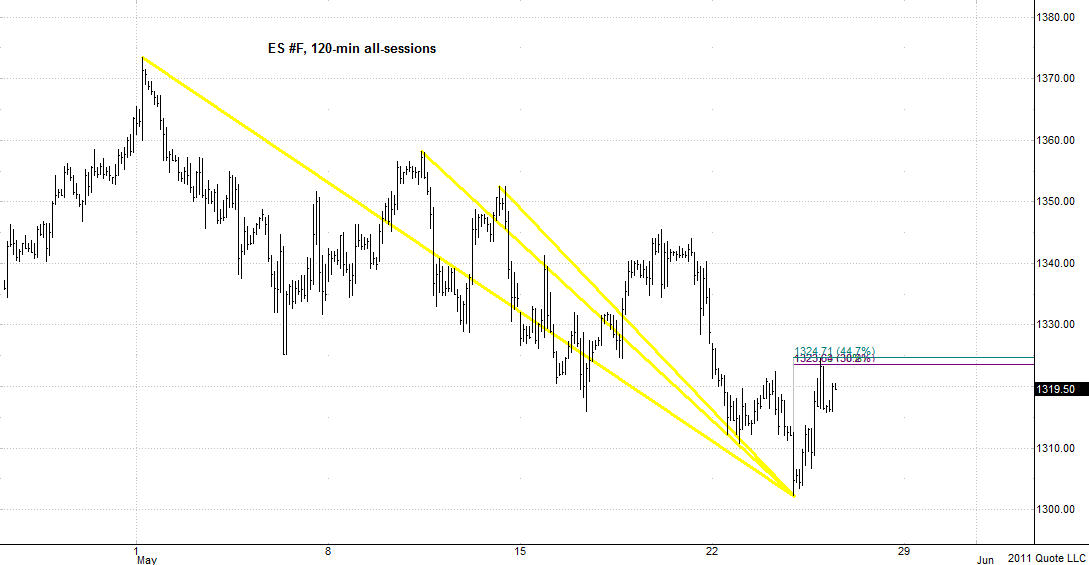
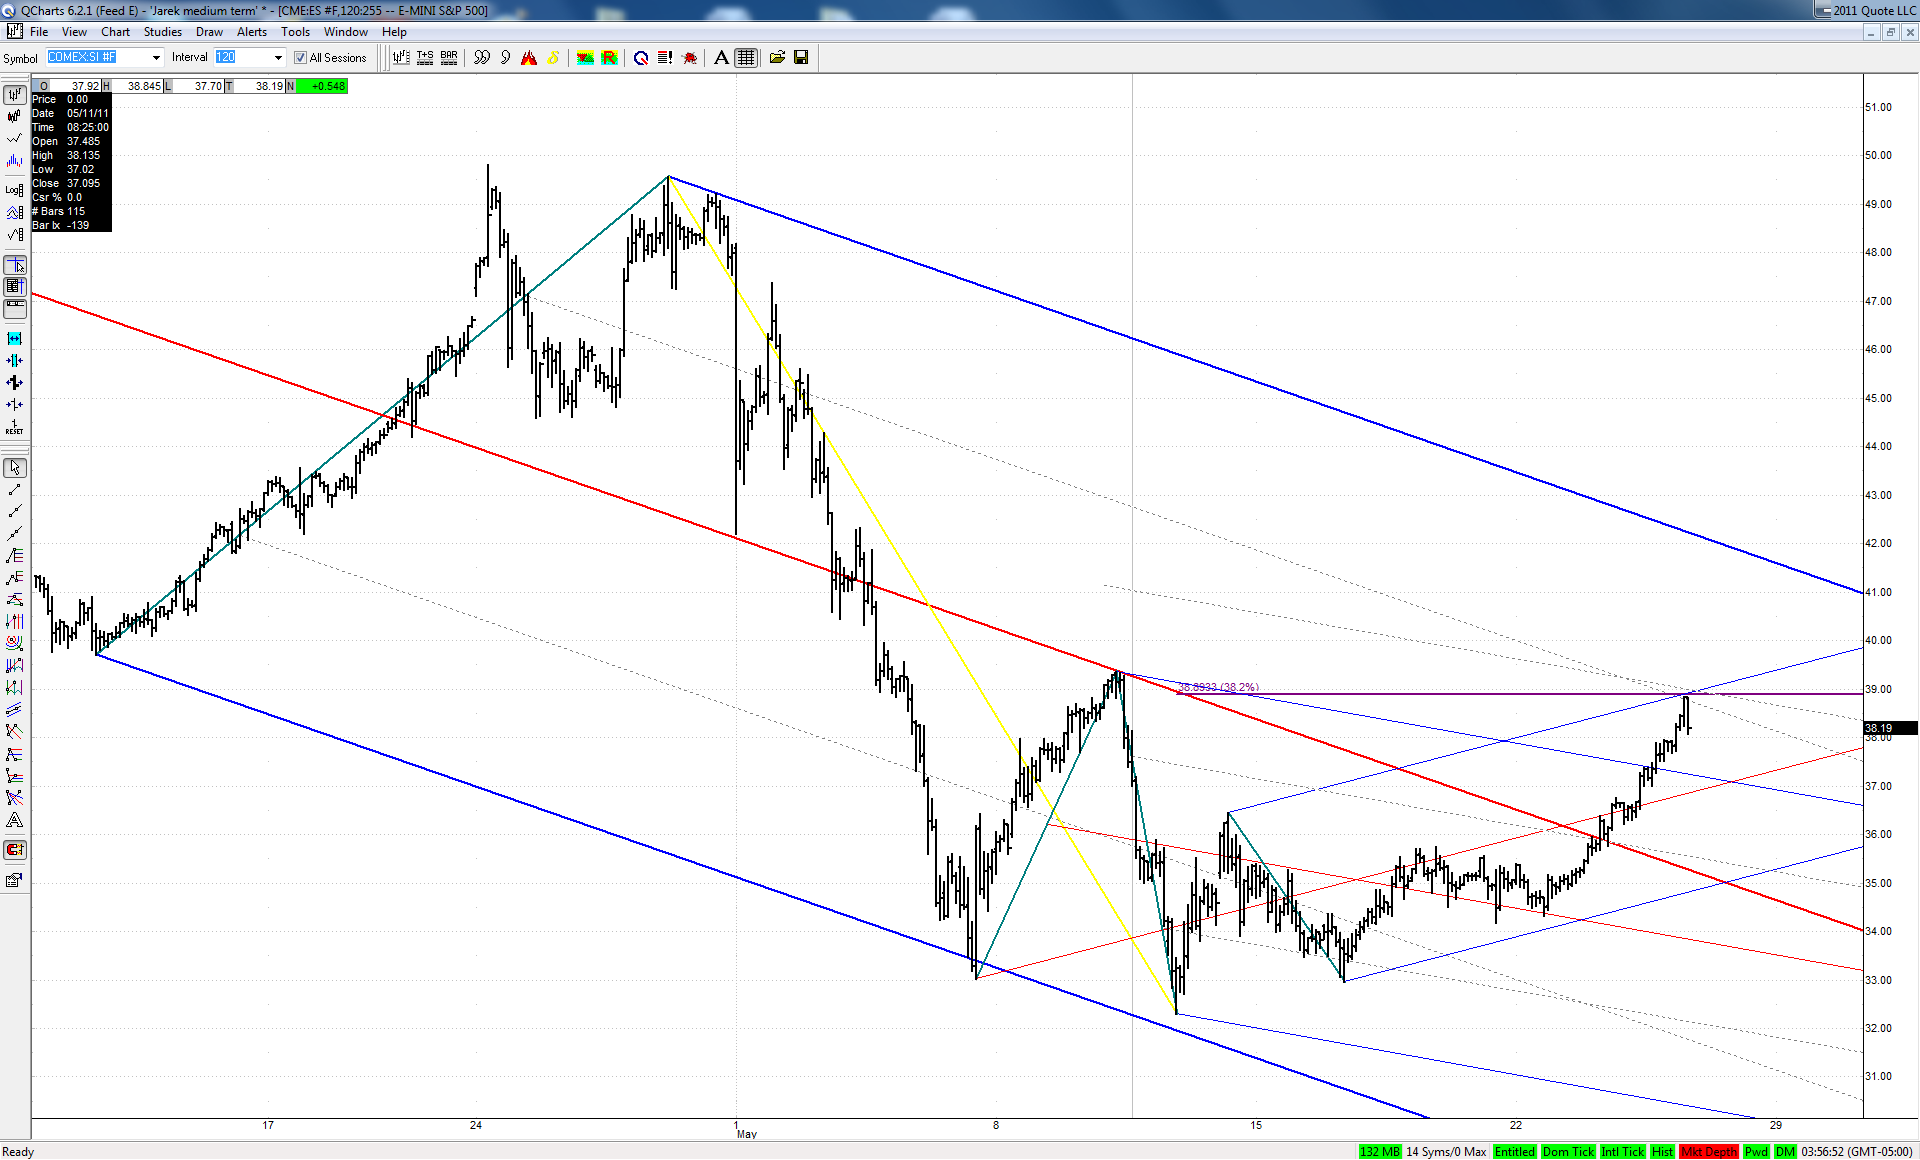
With all that said, now that everyone can see the 'human' side of me, let's look at some charts, and see how easy this one really was, in my opinion. Let's start with a 120-min all-sessions ES chart.
Three major key swing points, and what do they show? A .300, .382, and .447 overlap. I wait and wait and wait for this to happen. When I see it, I salivate. But, I missed it today. It was on my chart, but my chart had too much on it, and I could only see the levels, not what they were, or their significance. My mistake. If the 'context' is good, this alone is enough to trade against.
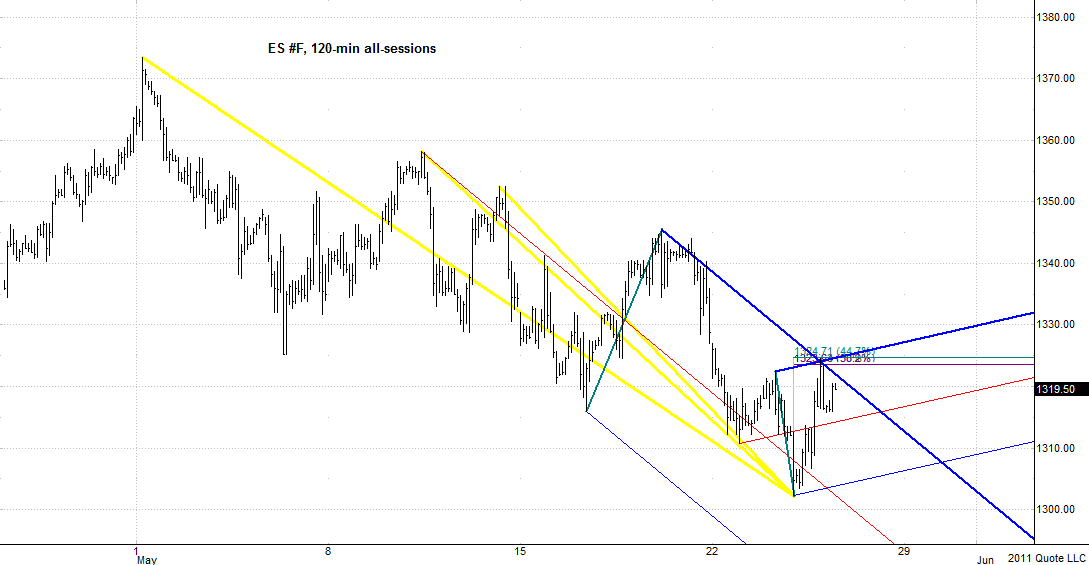
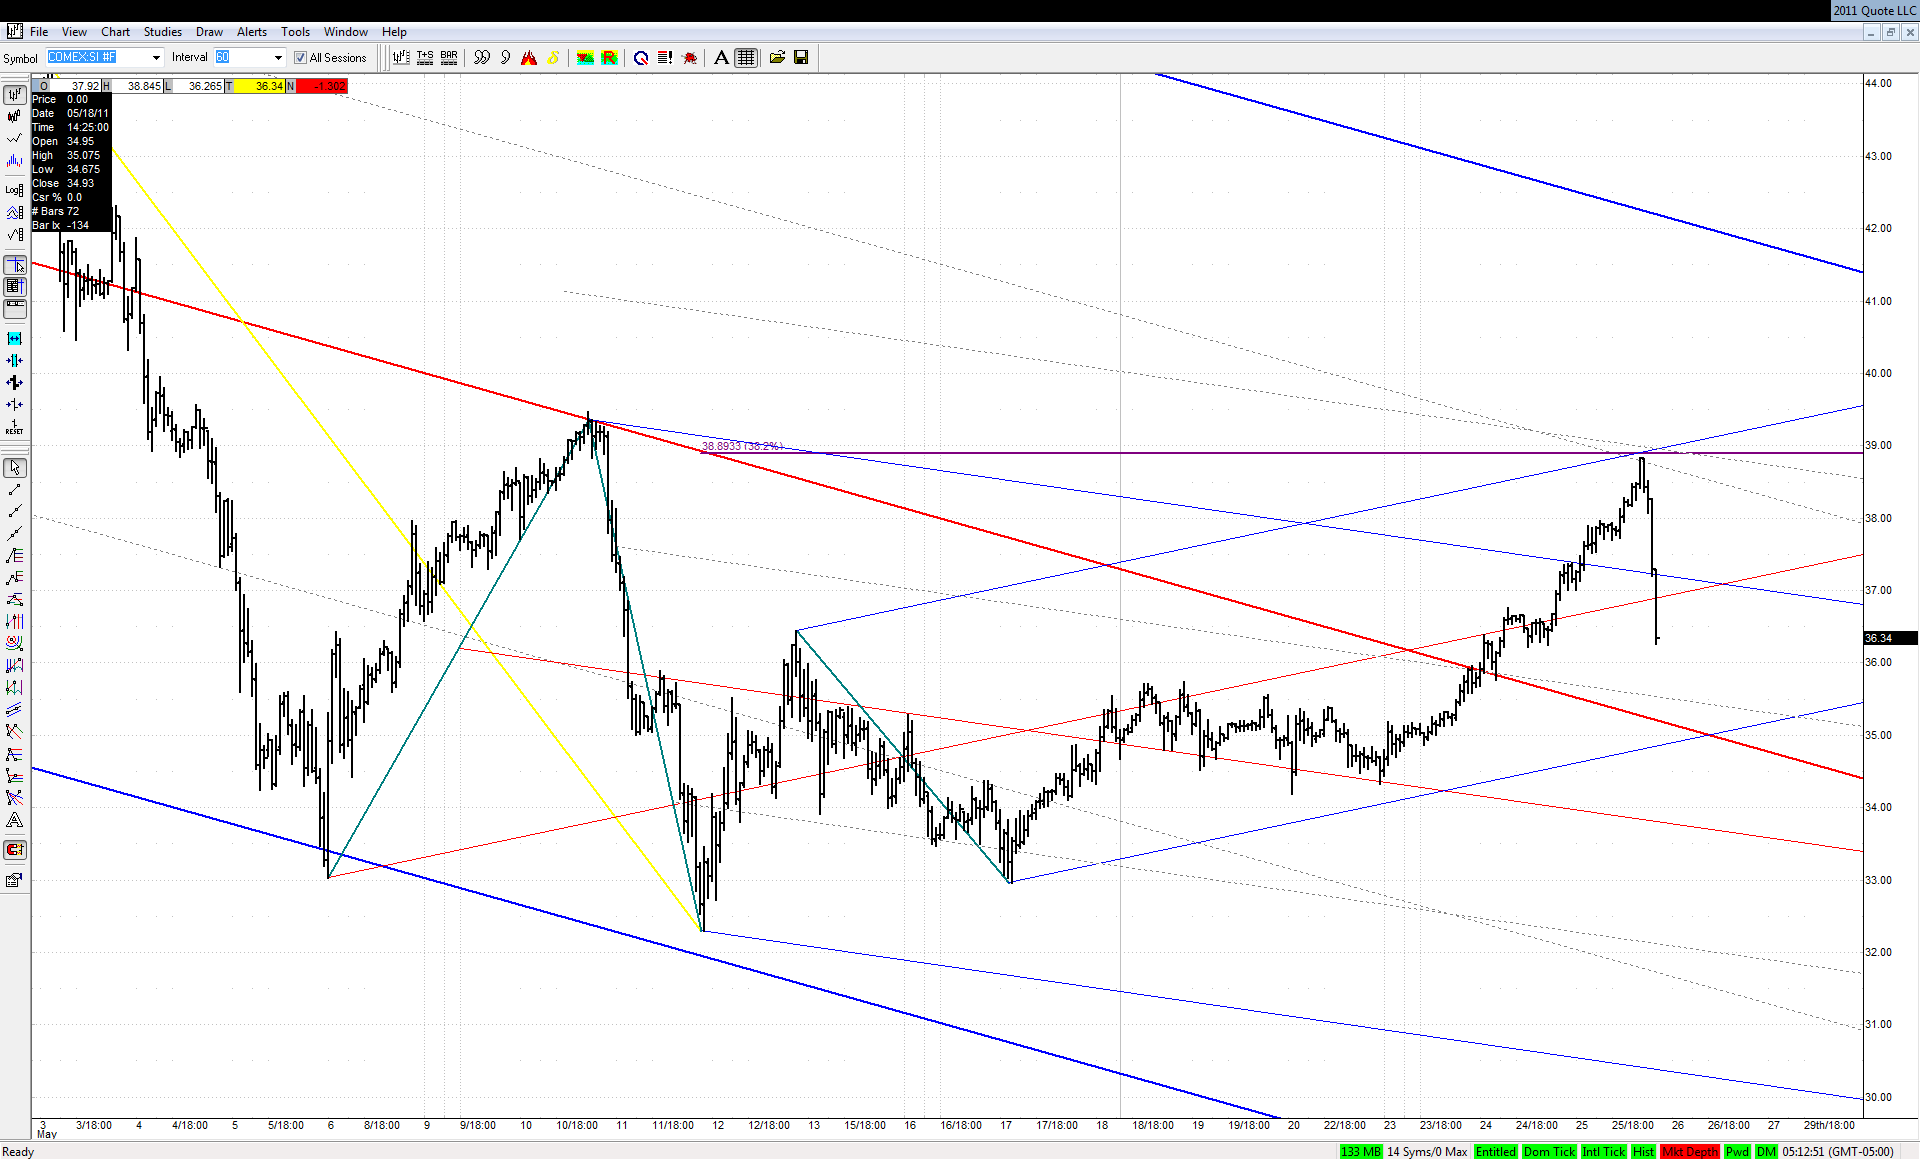
Let me add on the set tx showed, and another obvious standard set.
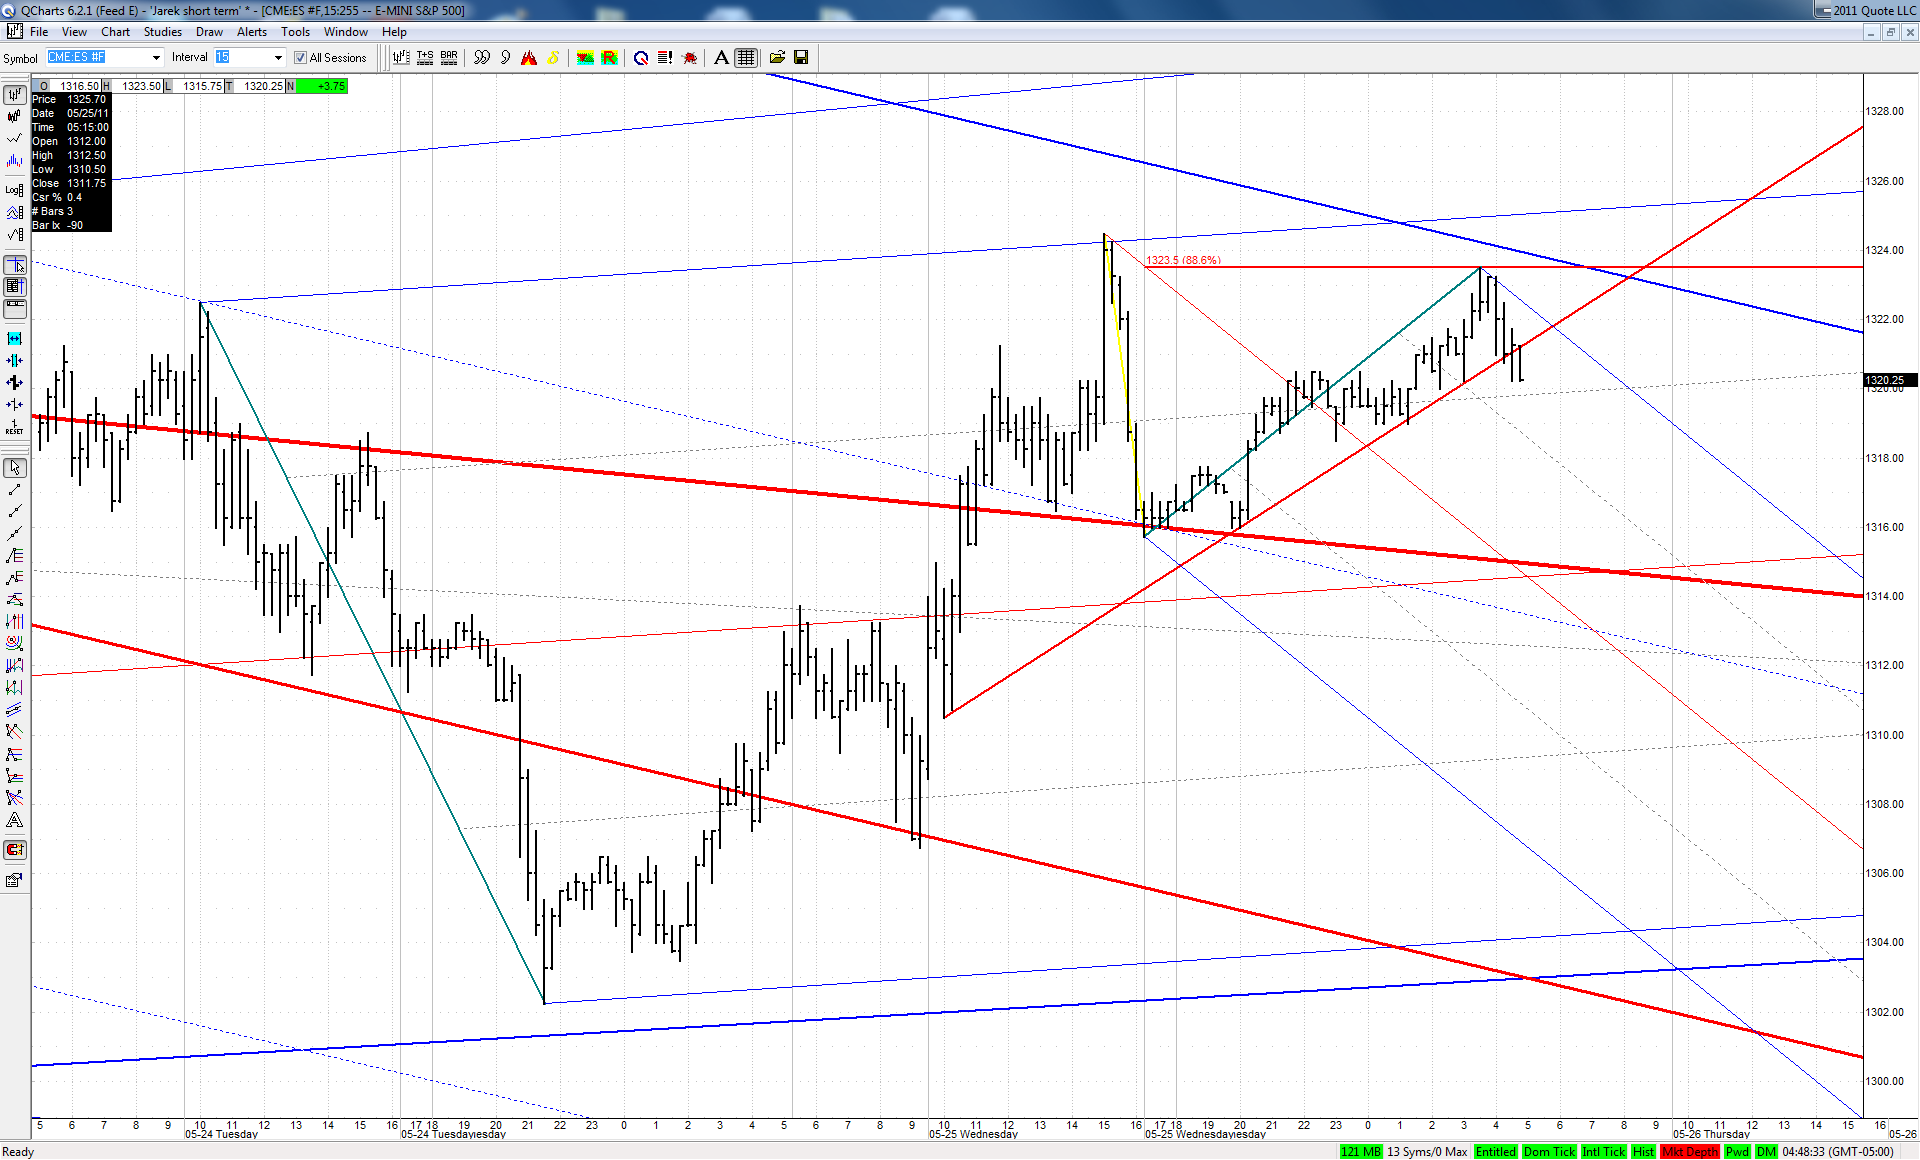
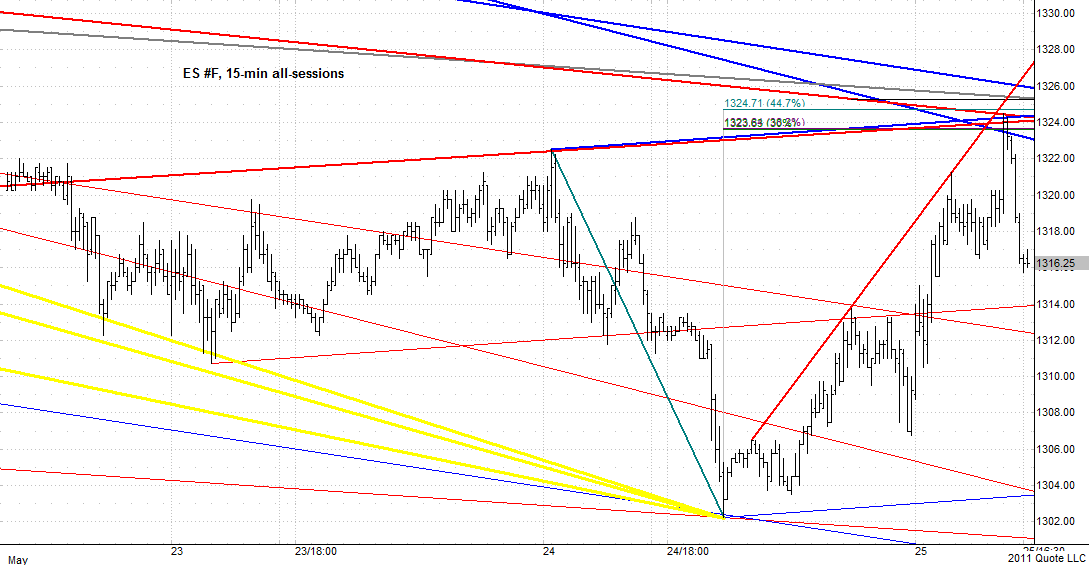
With this, I surely have enough to trade against. I've added no other fibs on there, done no other work. But I know this is the spot. Let me add on a slew of other things, and drop to the 15-min chart. I know everything I've done here will not be clear, but I'm on to three charts already instead of only one that I expected, and a lot more writing. So, do your best to recreate the lines, and we'll leave it at that.
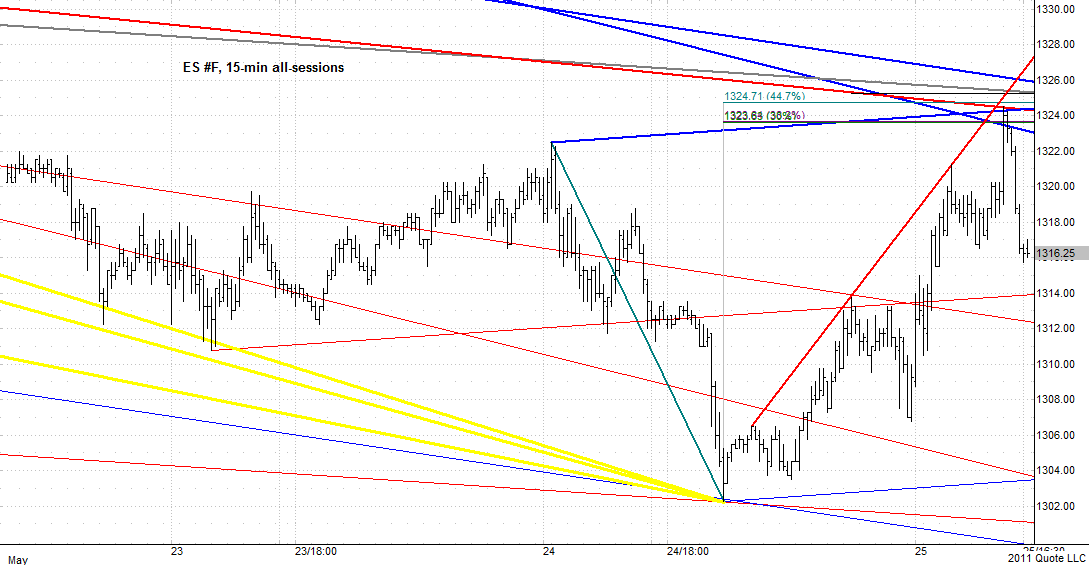
The additional blue line is another set I added on. The gray line is a line from a very big higher timeframe set, a very key set and approach I use. The red line is a sliding parallel for a TL. I also added on a SL of sorts. I had a slew of other fibs coming in together in here, like a 1.128 stop run, and just a bunch of others. I wound up deleting them all off for clarity. Everyone can do the work and find the grouping, it was just spectacular. But that's all supporting work for what we see here.
There are at least five key lines coming together here with a .300/.382/.447 convergence off primary swing points. Nothing forced here, just a super-clear area jumping off the chart at me. The chart I didn't have in advance, like I usually do. A clear chart, like I usually have. If I had had this chart I would have not even thought about a short at the first area, I would likely have been hot to get long on the last pullback that rushed it up, and I would have been very hot to short it.
Why so hot? Not only was the area something else, but recall the discussion from yesterday. They ran it up so hard it was terrifying to watch. Who would short that rocket ship? Into an area like this, with that insane over 33K 1-min volume climax, I would have. This was the same gift as yesterday. If I had only done the work.
Kane Trading slogan: "For those who want to do the work." Read it, learn it, live it. Jim included.
Charts courtesy QCharts.
Most of the time, I feel, I have my work done, and done properly, as I define it. I thought I had done that today. I didn't understand why I couldn't get things to line up for that first area. I could see some things there, but no spectacular confluence. Hence, I was very wary about shorting against it. Then the big burst up, the stop run, and into an area I didn't have any reason to sell against. So, I sat there and watched it get pommeled, just crushed. I couldn't understand why it would sell so hard and it wasn't a primary area.
Now, I am not making any claims, just voicing an opinion, but in that opinion I rarely get taken by surprise by 'big' moves that don't come from areas I might expect such a move. I'm not saying I catch them all (far, far from it), since they require entry triggers, adequate 'context', hitting right into the area, preferably price action I like, and I have to be there, ready to go, and do the right thing at the right time, and so on. That leaves trading reality as far as moves caught. But, I am rarely surprised by a move 'out of nowhere'.
So, when I took a blank chart and did a fresh workup on this one, not an after-the-fact I know something is there so let me curve fit some work, but a fresh, do my usual routine workup, I almost puked. Give me a break, how could I not have this work, not have been ready? Easy. I'm watching too much, sleeping too little, and battling health issues that have me far from alert and strong all the time. That's just reality. But, bottom line, I didn't have the work done. Or done properly. I cost me a great potential trade.
I'd like to feel that I don't often miss things. Given the posts I make in here, I think I've shown most of the time I don't. It may be partly because I have some great tools, but I feel it is even more so because I work so frickin' hard all the time, doing the work, double checking it, reviewing it, and so on. I come to the table ready to go, work in hand. I thought I had the work today, but I didn't clean up and review my 120-min chart the way I should have. I dropped the ball, totally. I was not a 'consummate professional' today. I wasn't ready...
With all that said, now that everyone can see the 'human' side of me, let's look at some charts, and see how easy this one really was, in my opinion. Let's start with a 120-min all-sessions ES chart.
Three major key swing points, and what do they show? A .300, .382, and .447 overlap. I wait and wait and wait for this to happen. When I see it, I salivate. But, I missed it today. It was on my chart, but my chart had too much on it, and I could only see the levels, not what they were, or their significance. My mistake. If the 'context' is good, this alone is enough to trade against.
Let me add on the set tx showed, and another obvious standard set.
With this, I surely have enough to trade against. I've added no other fibs on there, done no other work. But I know this is the spot. Let me add on a slew of other things, and drop to the 15-min chart. I know everything I've done here will not be clear, but I'm on to three charts already instead of only one that I expected, and a lot more writing. So, do your best to recreate the lines, and we'll leave it at that.
The additional blue line is another set I added on. The gray line is a line from a very big higher timeframe set, a very key set and approach I use. The red line is a sliding parallel for a TL. I also added on a SL of sorts. I had a slew of other fibs coming in together in here, like a 1.128 stop run, and just a bunch of others. I wound up deleting them all off for clarity. Everyone can do the work and find the grouping, it was just spectacular. But that's all supporting work for what we see here.
There are at least five key lines coming together here with a .300/.382/.447 convergence off primary swing points. Nothing forced here, just a super-clear area jumping off the chart at me. The chart I didn't have in advance, like I usually do. A clear chart, like I usually have. If I had had this chart I would have not even thought about a short at the first area, I would likely have been hot to get long on the last pullback that rushed it up, and I would have been very hot to short it.
Why so hot? Not only was the area something else, but recall the discussion from yesterday. They ran it up so hard it was terrifying to watch. Who would short that rocket ship? Into an area like this, with that insane over 33K 1-min volume climax, I would have. This was the same gift as yesterday. If I had only done the work.
Kane Trading slogan: "For those who want to do the work." Read it, learn it, live it. Jim included.
Charts courtesy QCharts.
MA
MarcinO
Rep: 67
Posts: 5,506
Knowing how busy you are I really appreciate that you placed all those charts with such an extensive description. For beginners like me brief posts are often not enough to grasp your idea which of course results from my lack of experience. With such charts from time to time it is much easier to understand your short commentaries placed in real time of price action.
Thanks a lot!
Thanks a lot!
Originally posted by jimkane
Oops, and I forgot to add that awesome backtested TL, too. What an area. Here it is. Notice how it tracks that one set's upper //.