MyPivots
Sign In
JA
jarek
Rep: 94
Posts: 3,474
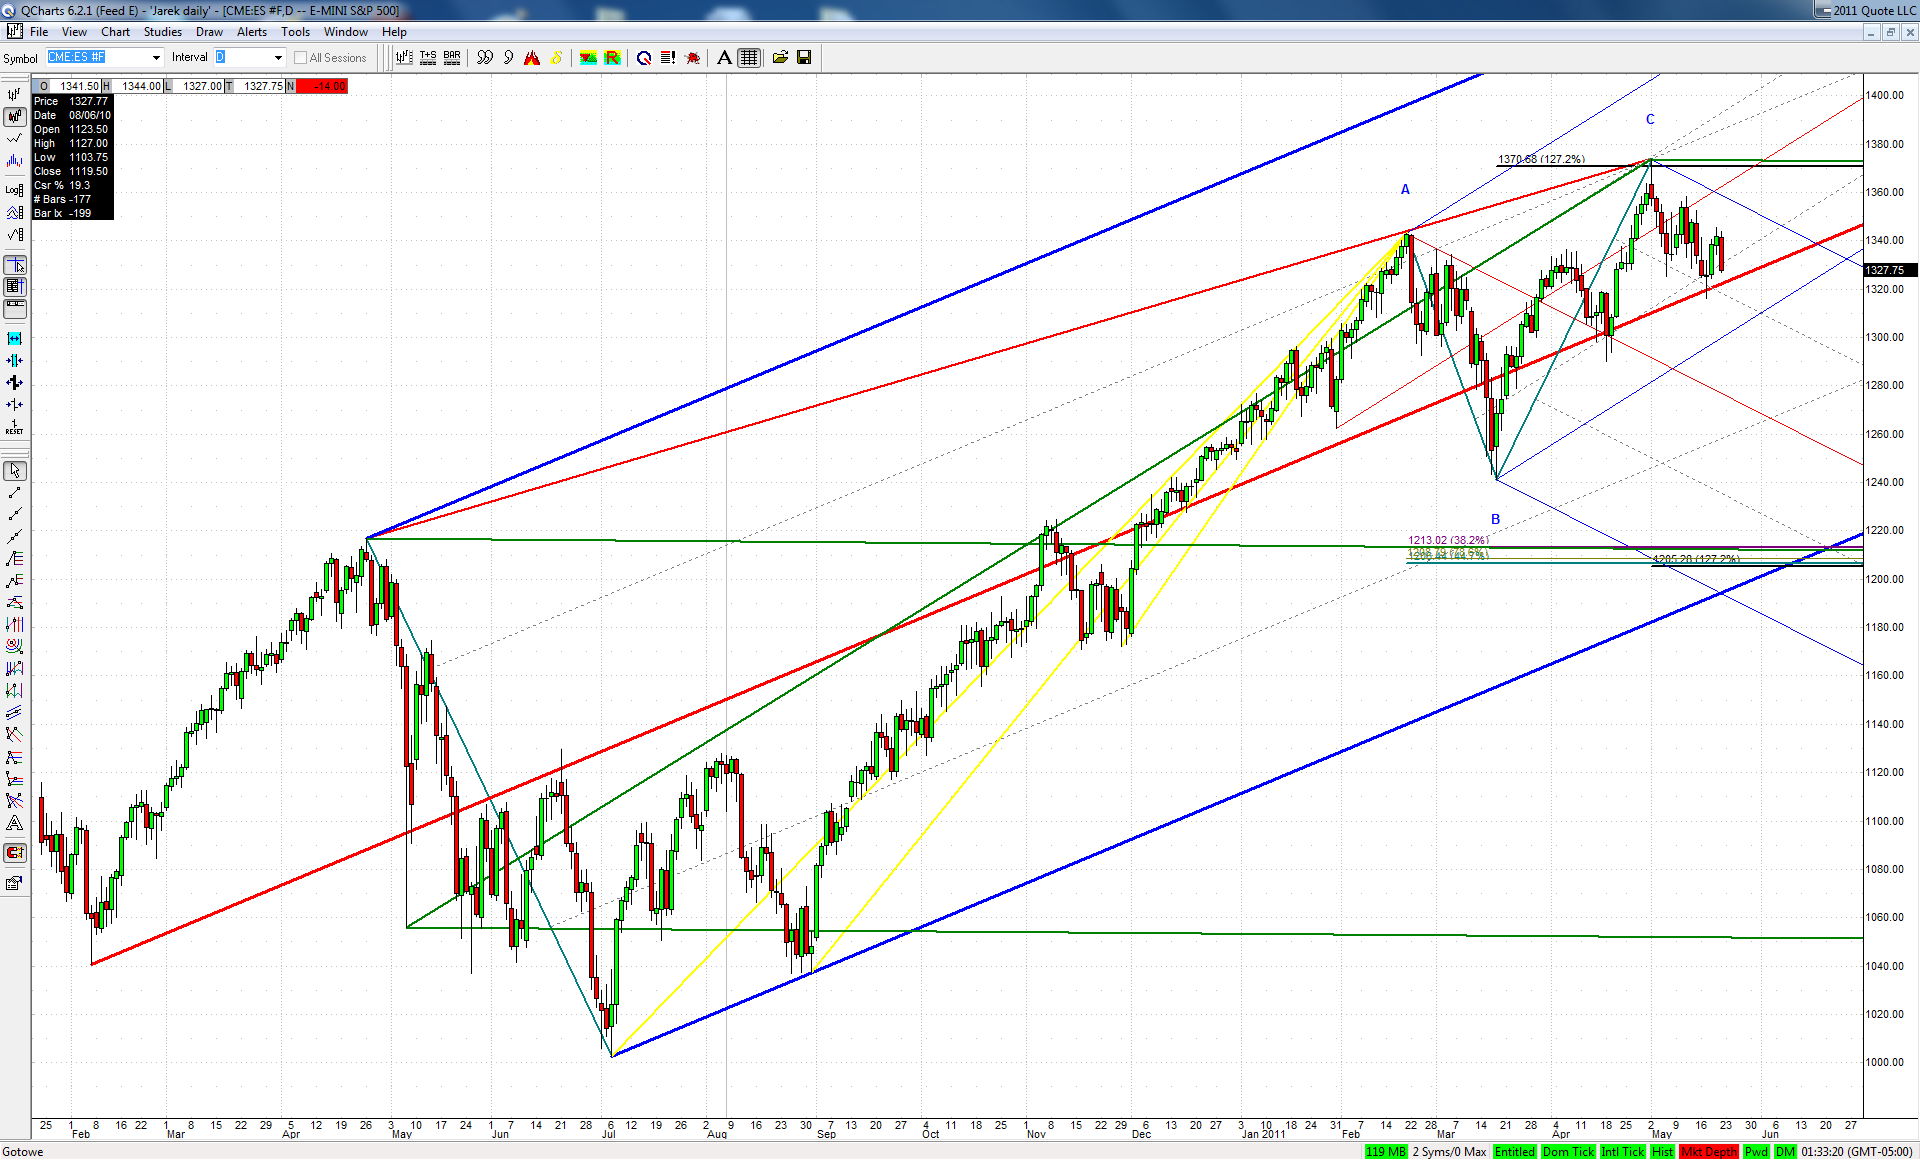
Here is the update of my longer term ES chart:

Click image for original size


I know this potential drop of 10% in a couple of weeks is hard to conceive for some. But I can't find a better explanation for the corrective nature of the March-May rise
JI
jimkane
Rep: 3,058
Posts: 33,089
First area here at 15.25 to be cautious with.
RA
rat89
Rep: 0
Posts: 7,015
Click image for original size

Click image for original size

Click image for original size
JI
jimkane
Rep: 3,058
Posts: 33,089
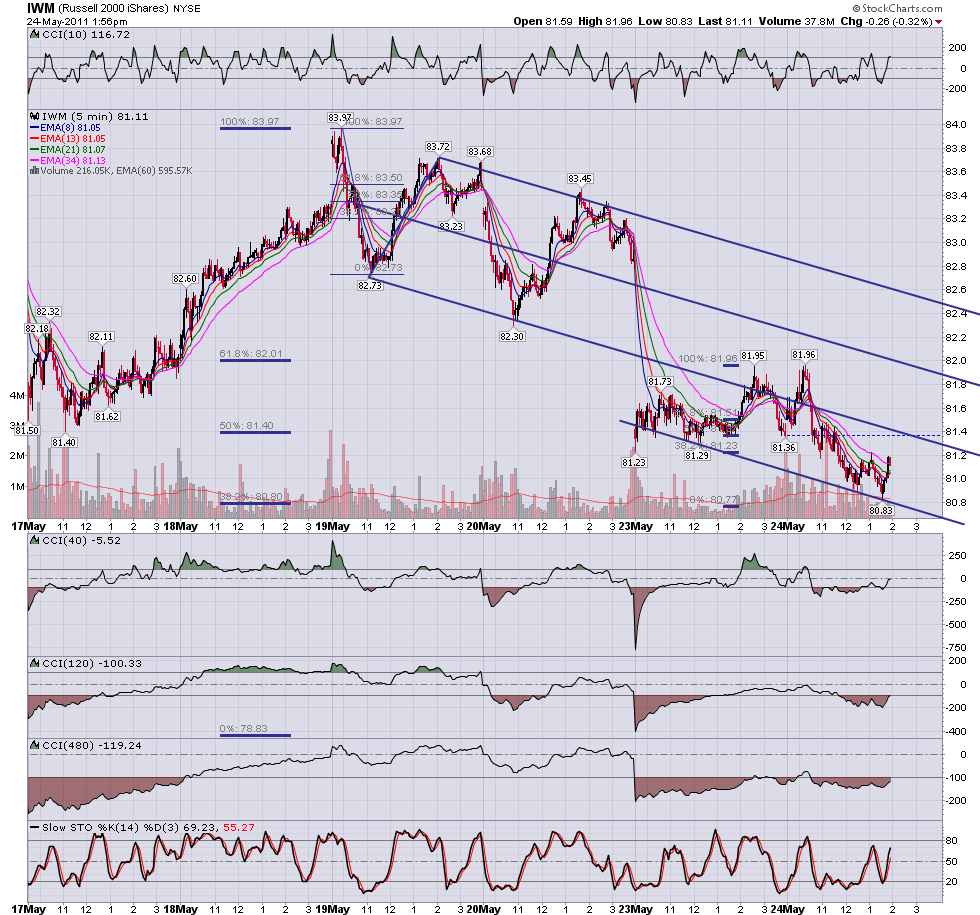
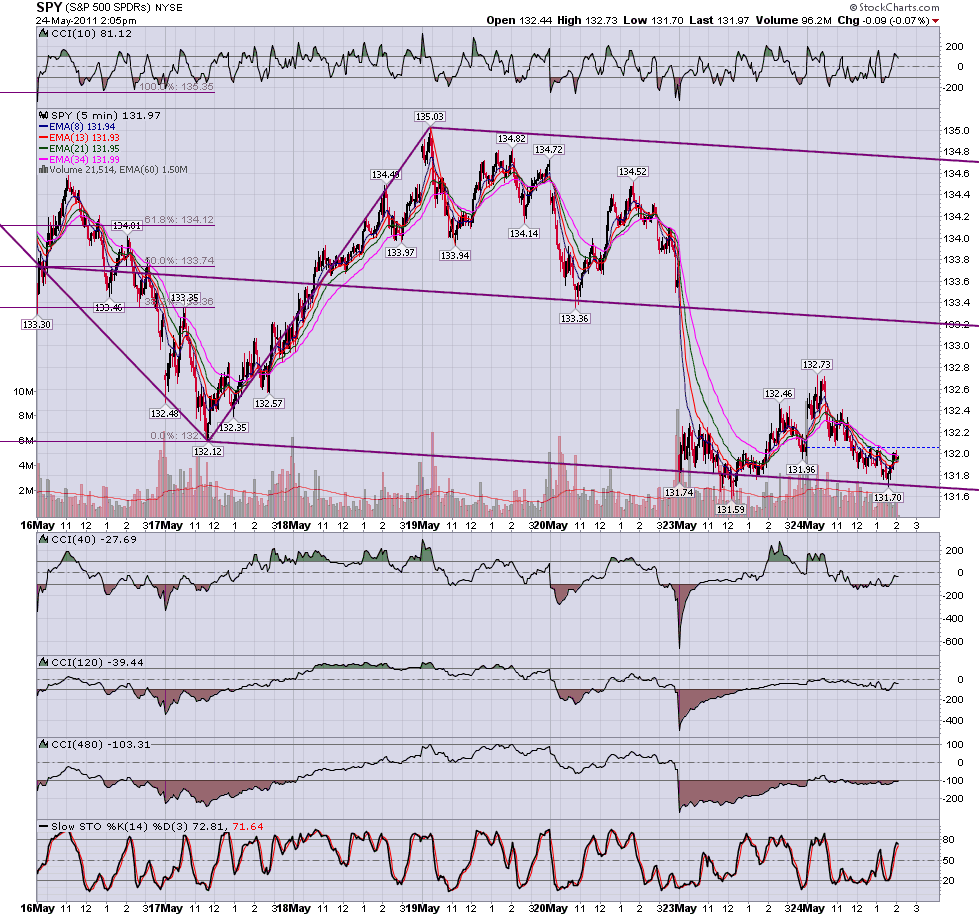
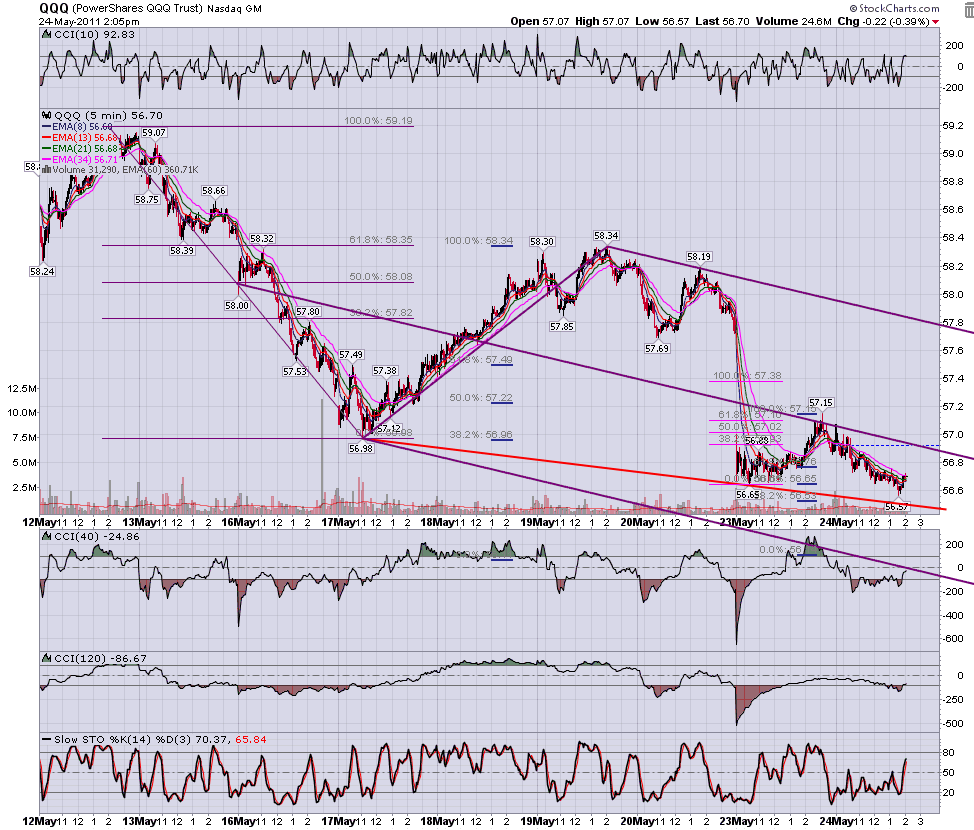
Notice the reaction? Right back in to the .382, which stops it dead, and then back up. Now, that's a clue, right?
JI
jimkane
Rep: 3,058
Posts: 33,089
Now watch here and see if this was one last push, or if this is a trend move.
JI
jimkane
Rep: 3,058
Posts: 33,089
I think the latter is more likely.
JI
jimkane
Rep: 3,058
Posts: 33,089
But note the KZ off the HOD coming in here...
JI
jimkane
Rep: 3,058
Posts: 33,089
CL going nuts again.
JI
jimkane
Rep: 3,058
Posts: 33,089
ES acting all strong into the key KZ. Most of the time that means...
JI
jimkane
Rep: 3,058
Posts: 33,089
Once this KZ is breached I'm watching 18-19 next. But it looks like they want the HOD the way this is acting.
JI
jimkane
Rep: 3,058
Posts: 33,089
Crude is insane!
JI
jimkane
Rep: 3,058
Posts: 33,089
Okay, see everyone later. I'll try to do those updates on copper and the Swissie like I mentioned in those sections, and get to jarek's question on that being a KT rocking chair pattern failure setup, some time this weekend.