MyPivots
Sign In
JA
jarek
Rep: 94
Posts: 3,474
Here is the update of my longer term ES chart:

Click image for original size
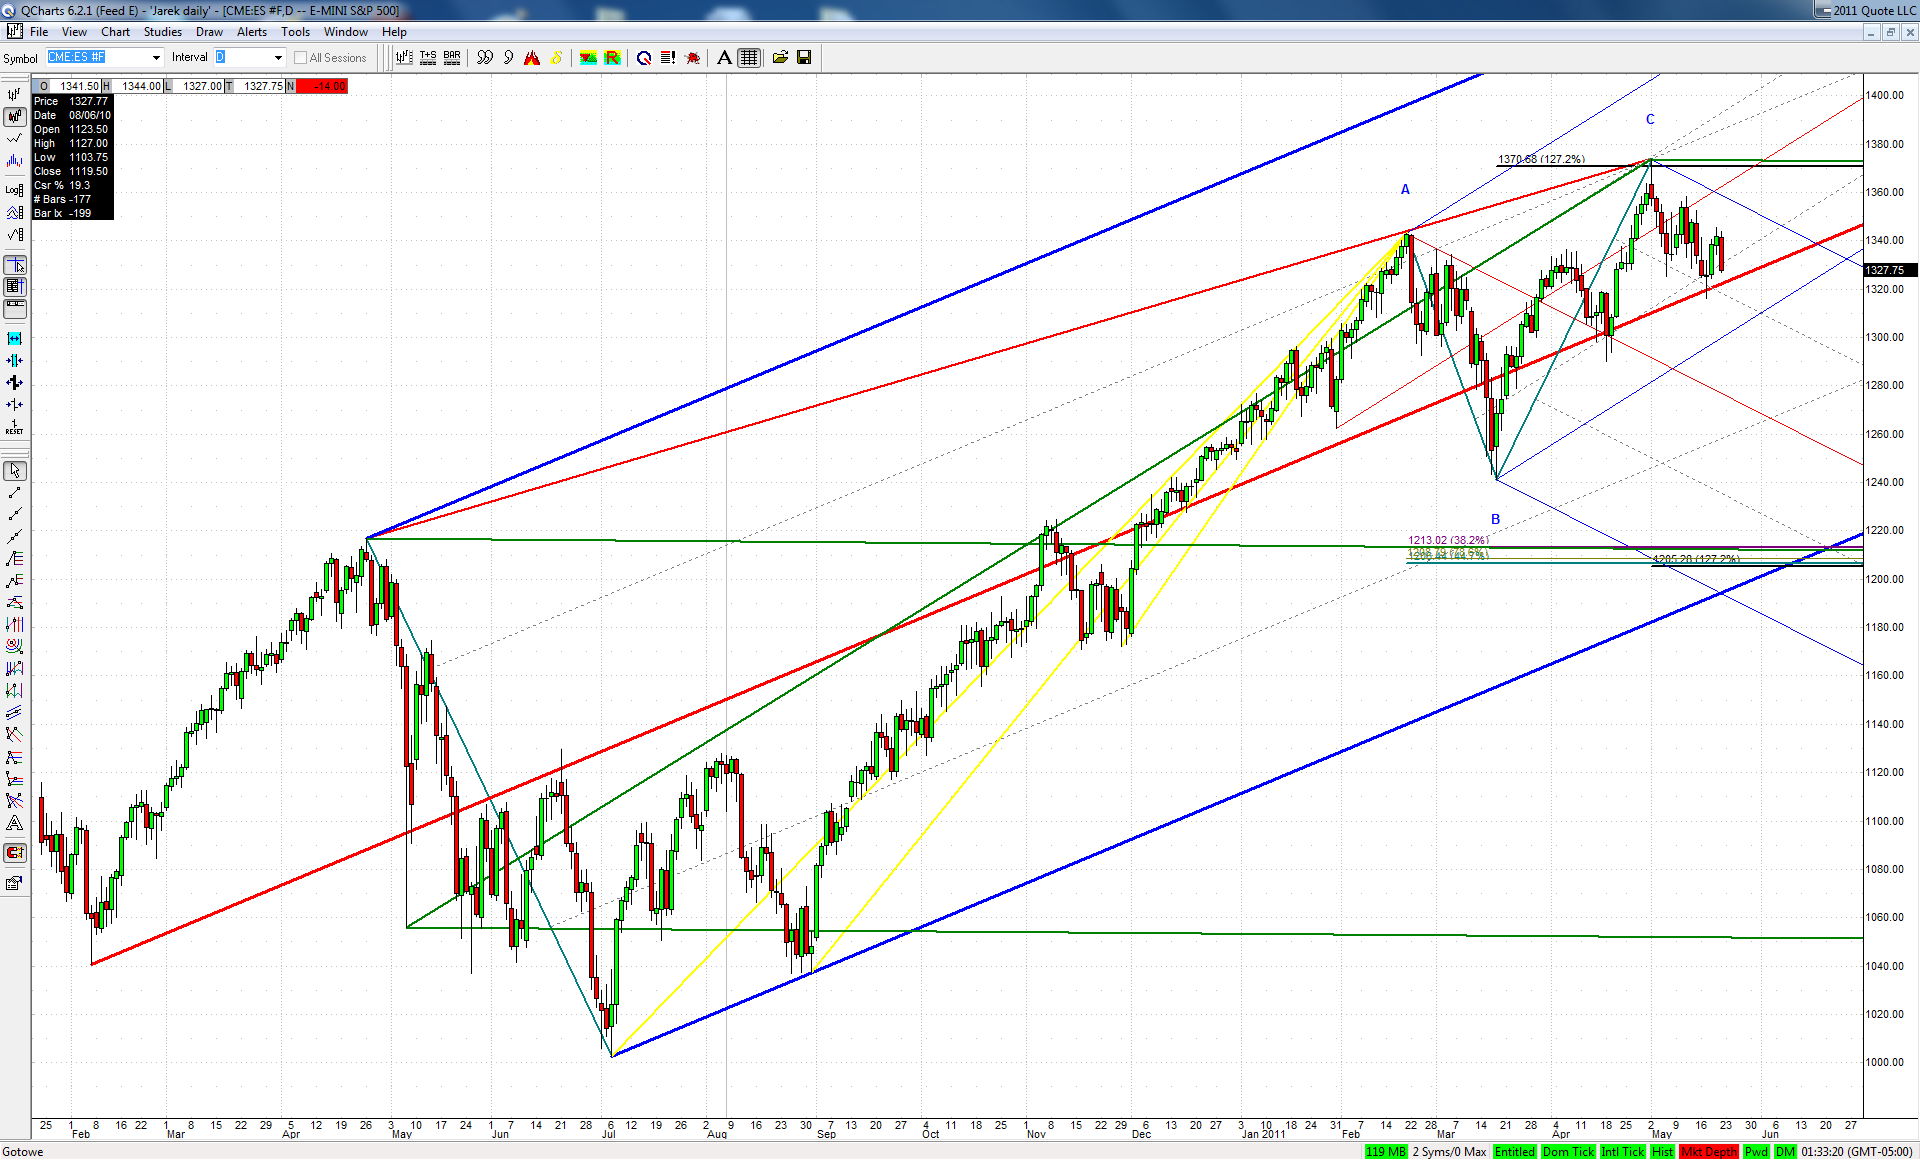

I know this potential drop of 10% in a couple of weeks is hard to conceive for some. But I can't find a better explanation for the corrective nature of the March-May rise
RA
rat89
Rep: 0
Posts: 7,015
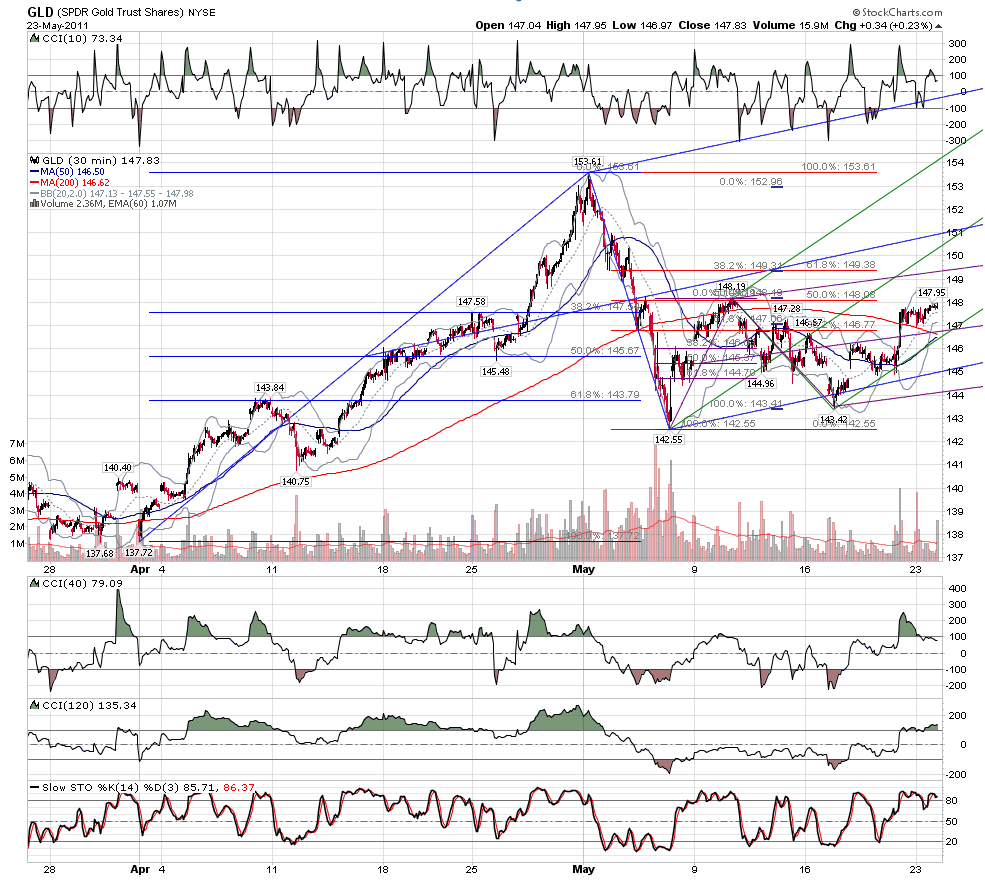
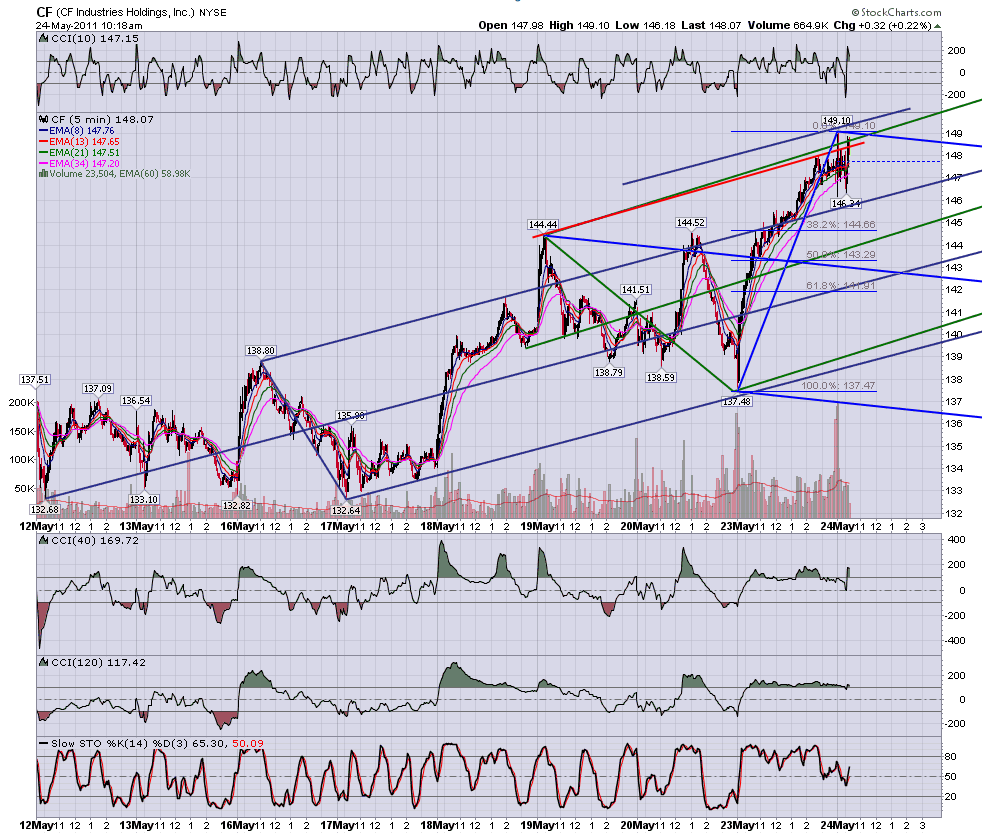
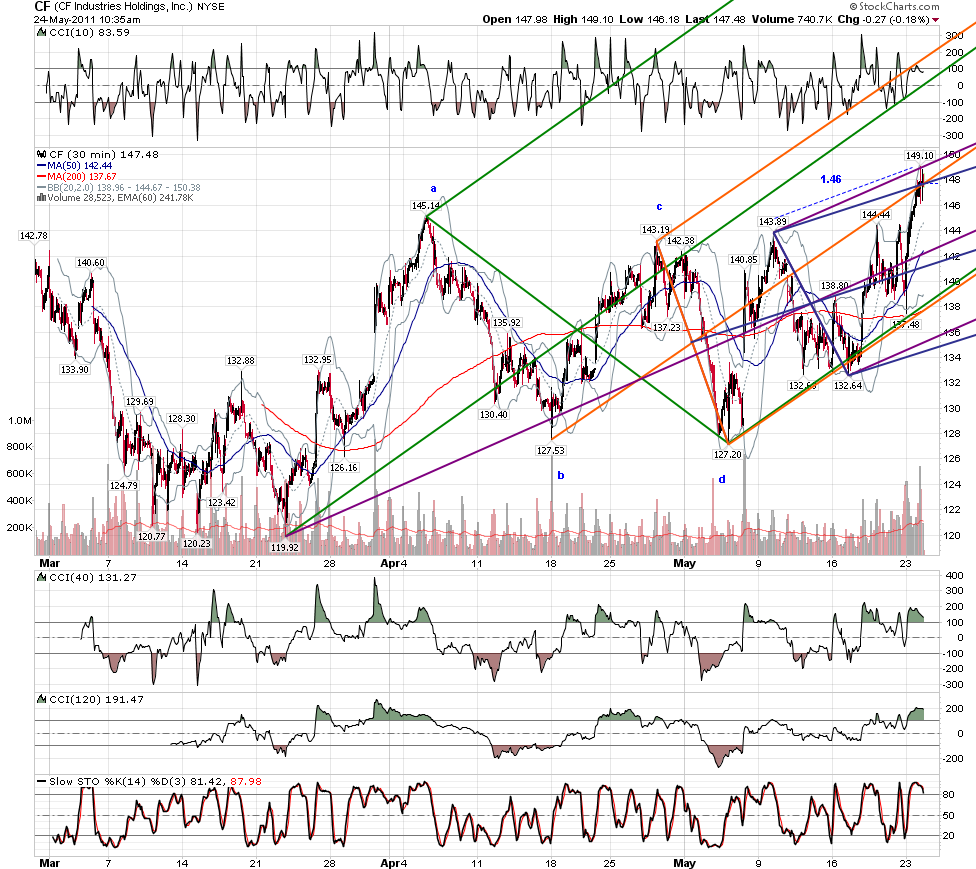
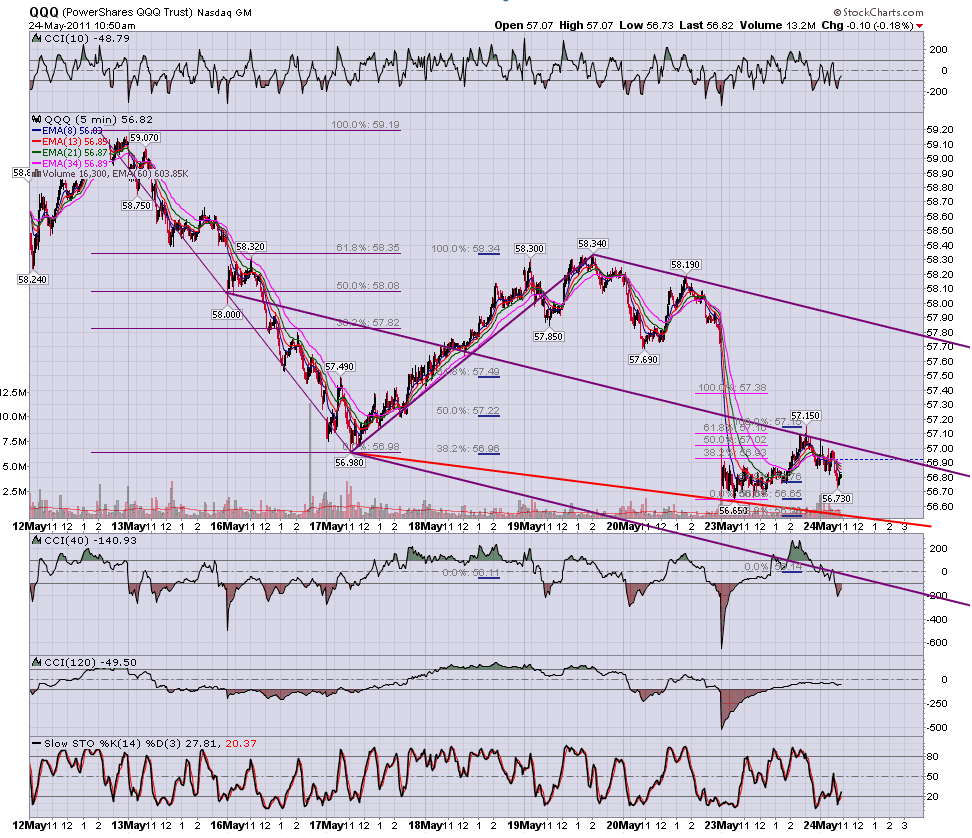
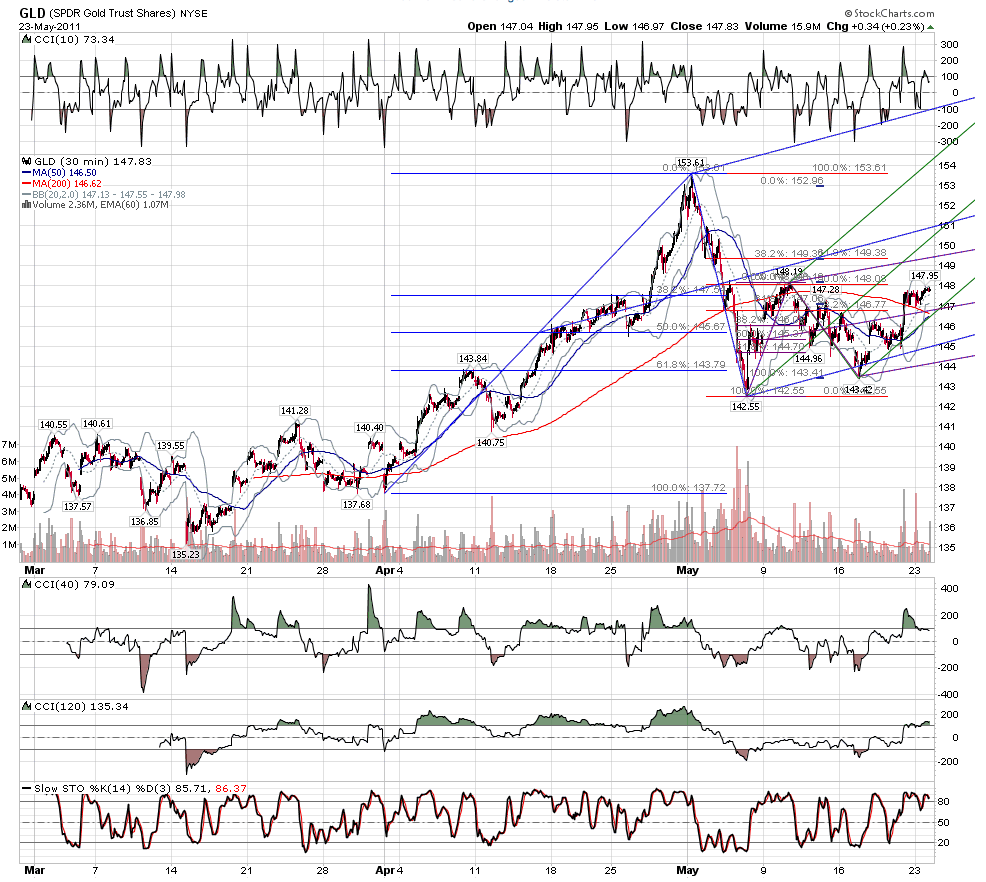
kind of a stretch on 886 at the last low...watching 149.48 - 150.13 area

Click image for original size

Click image for original size
RA
rat89
Rep: 0
Posts: 7,015
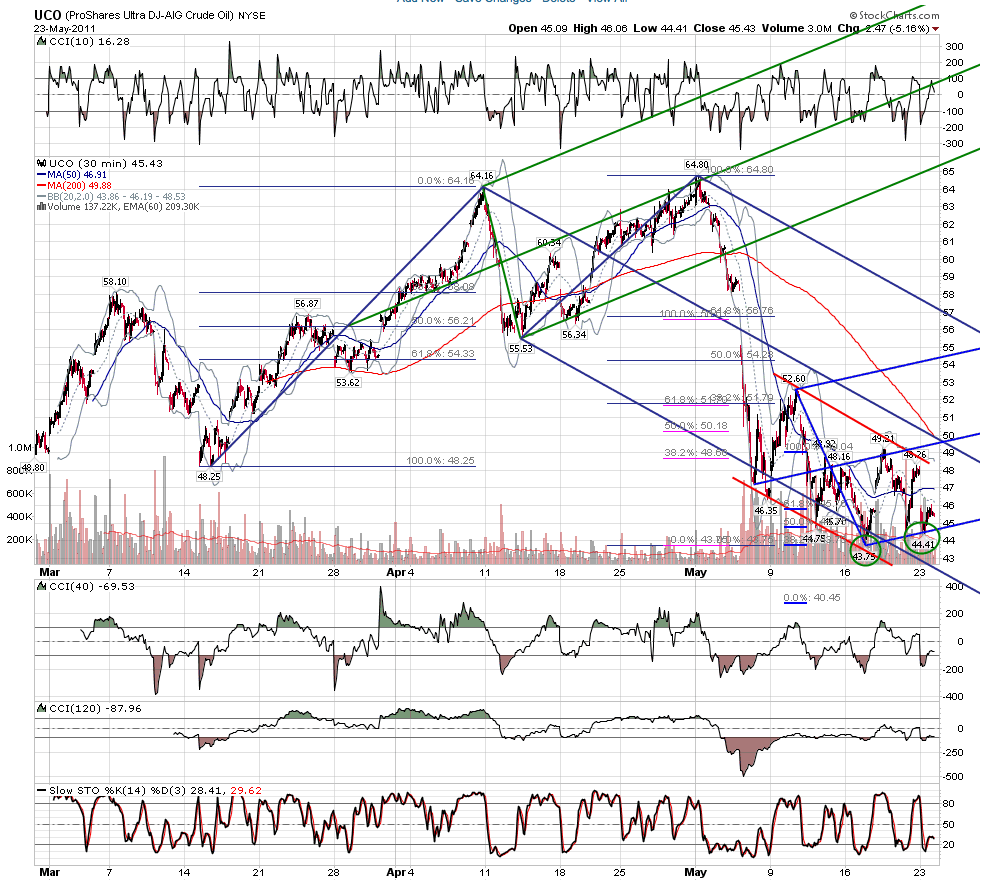
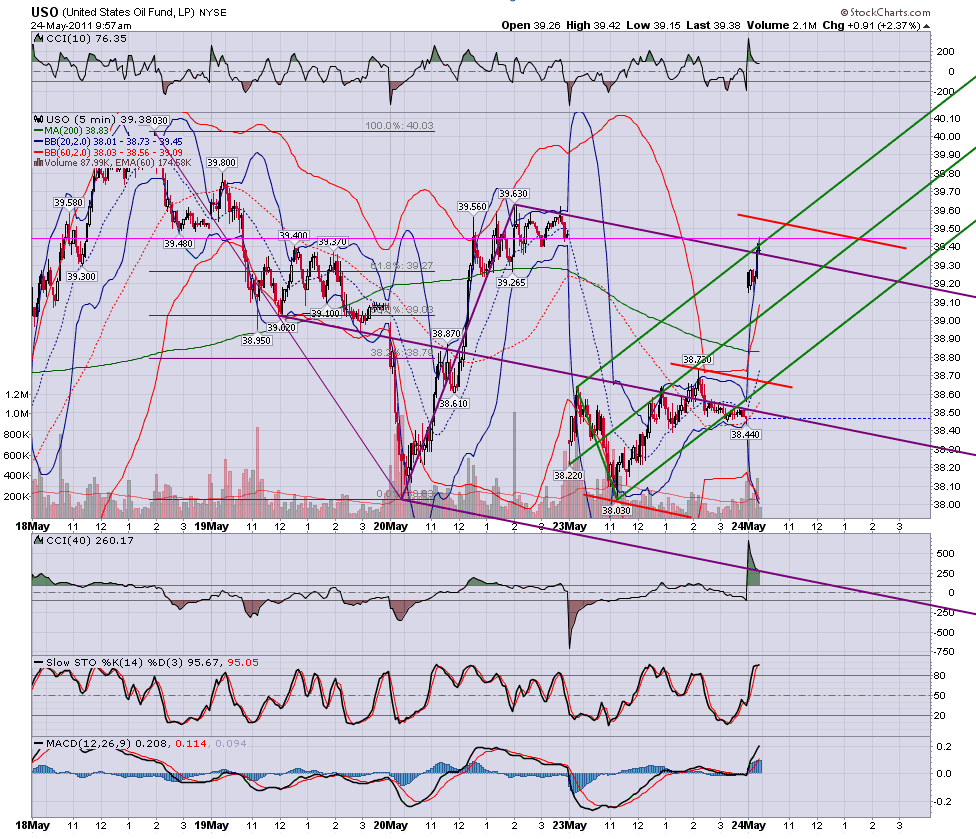
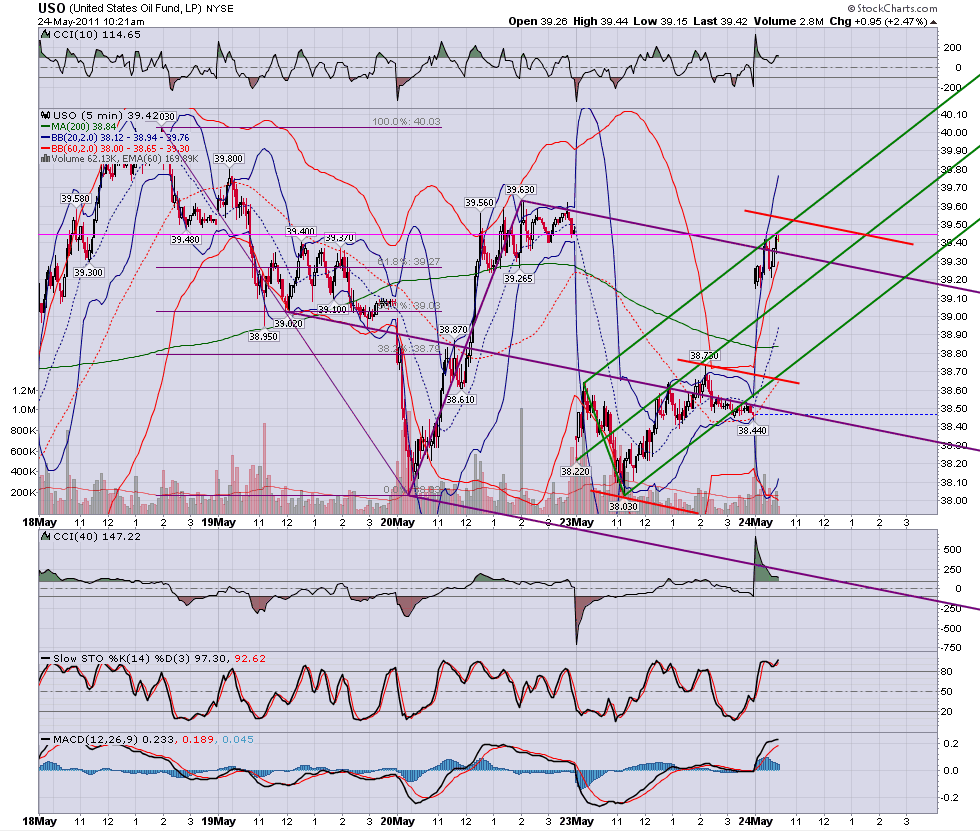
1.27 followed by 886


Click image for original size
RA
rat89
Rep: 0
Posts: 7,015
Click image for original size
RA
rat89
Rep: 0
Posts: 7,015
Click image for original size
AL
albert
Rep: 99
Posts: 3,094
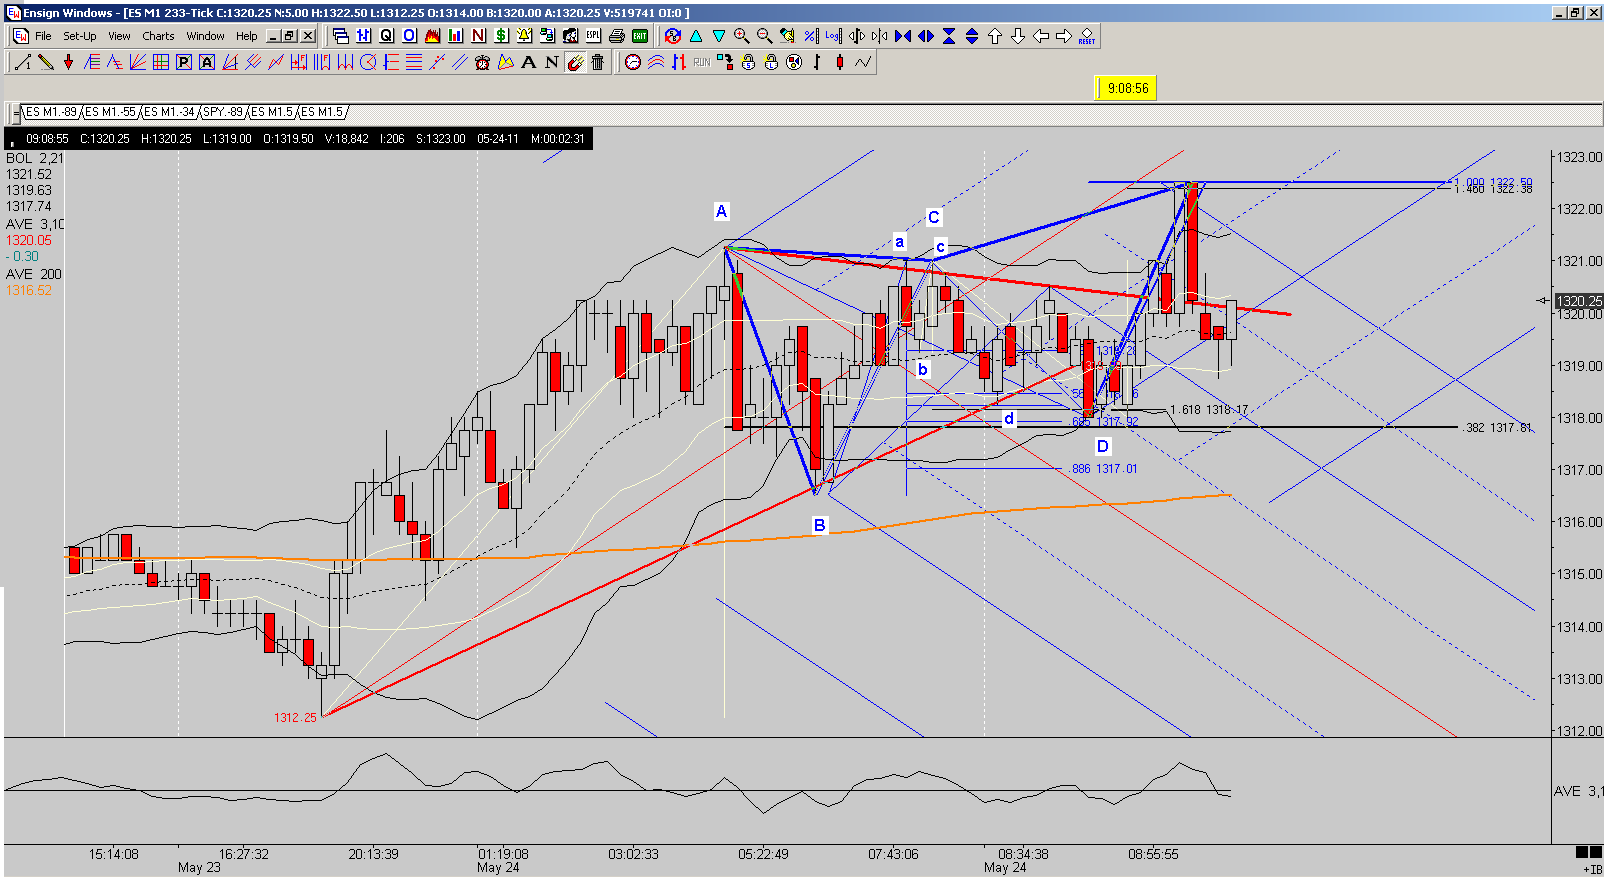
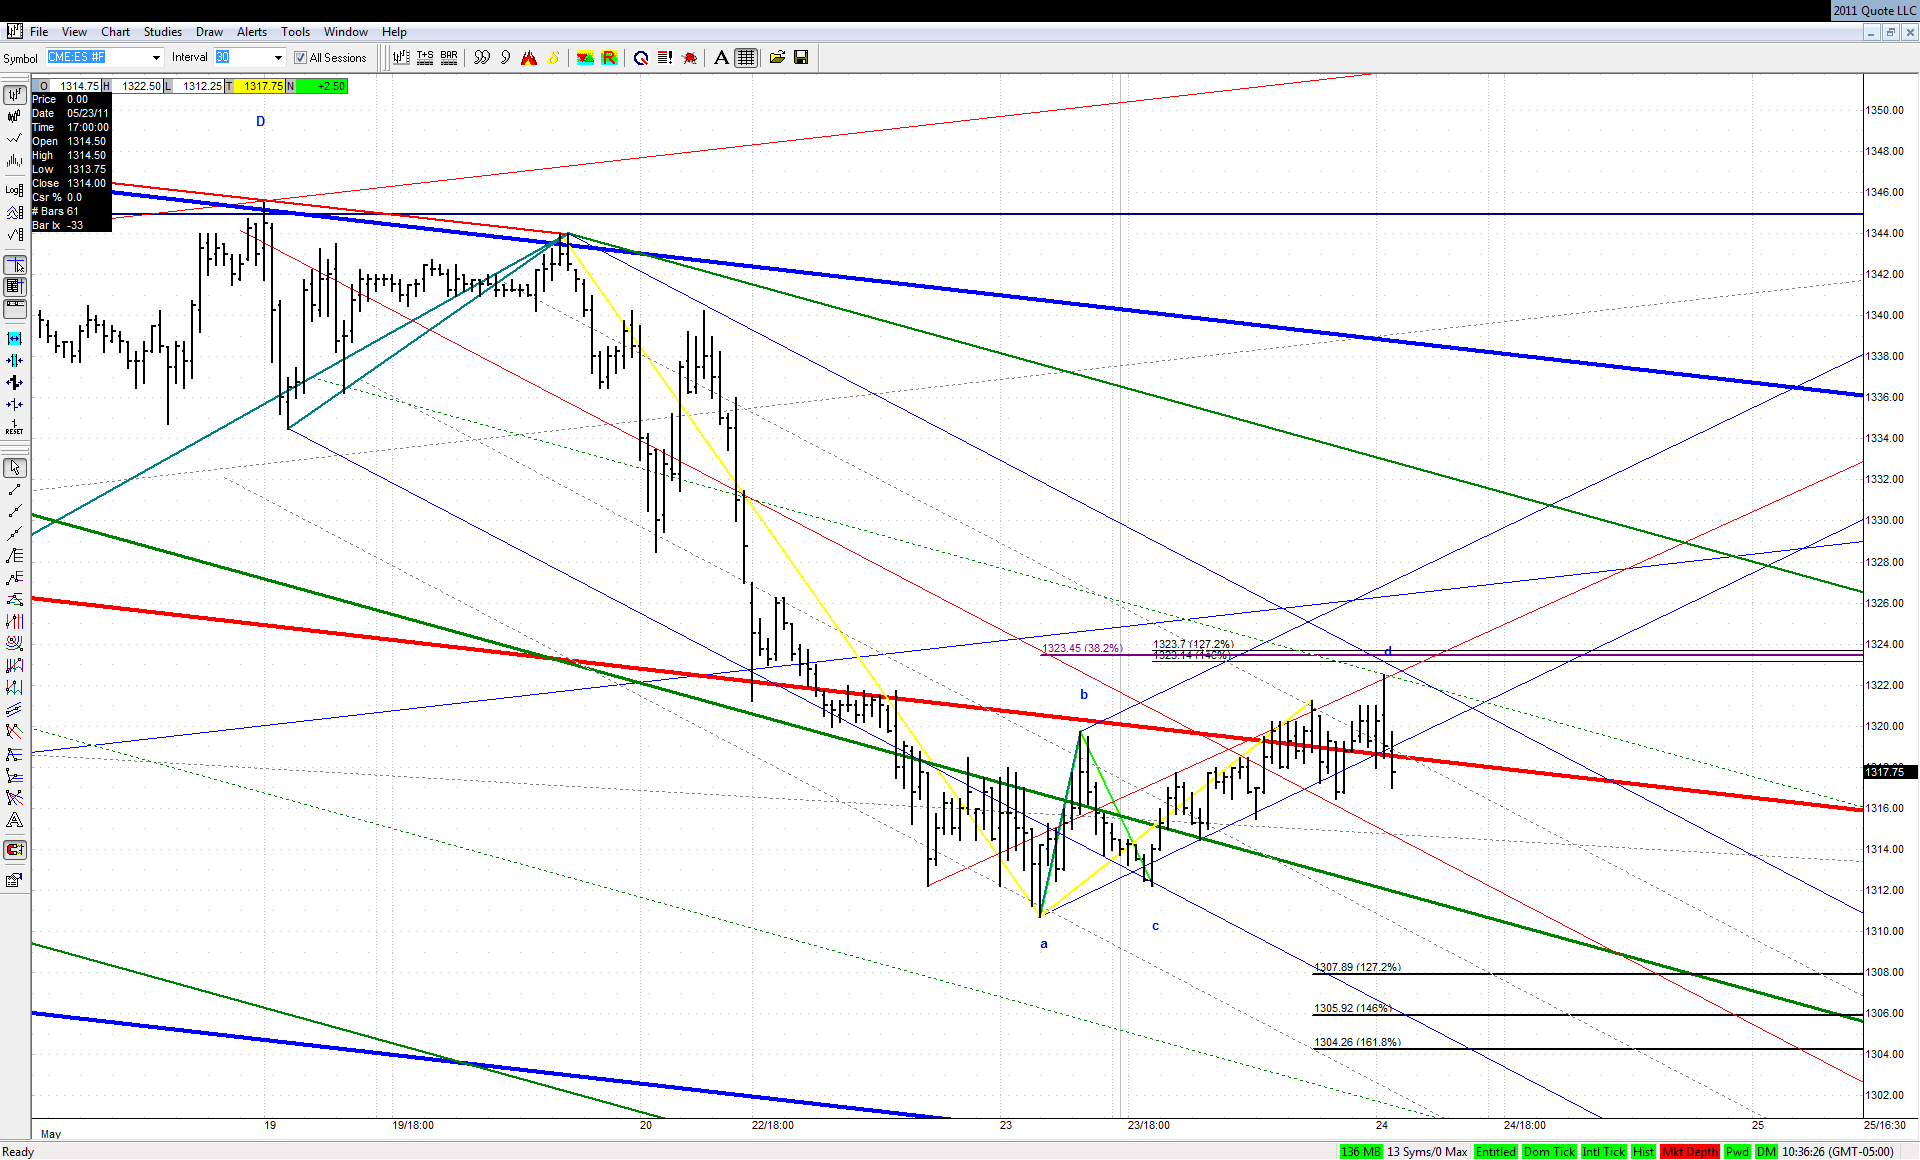
Kane 4 PCP completing at 0.382 fibo. Also a smaller Kane DT ABCD completing at 1.618 fibo in CD leg of Kane 4 PCP.

Good Trading,

Al Kamego
Click image for original size
RA
rat89
Rep: 0
Posts: 7,015
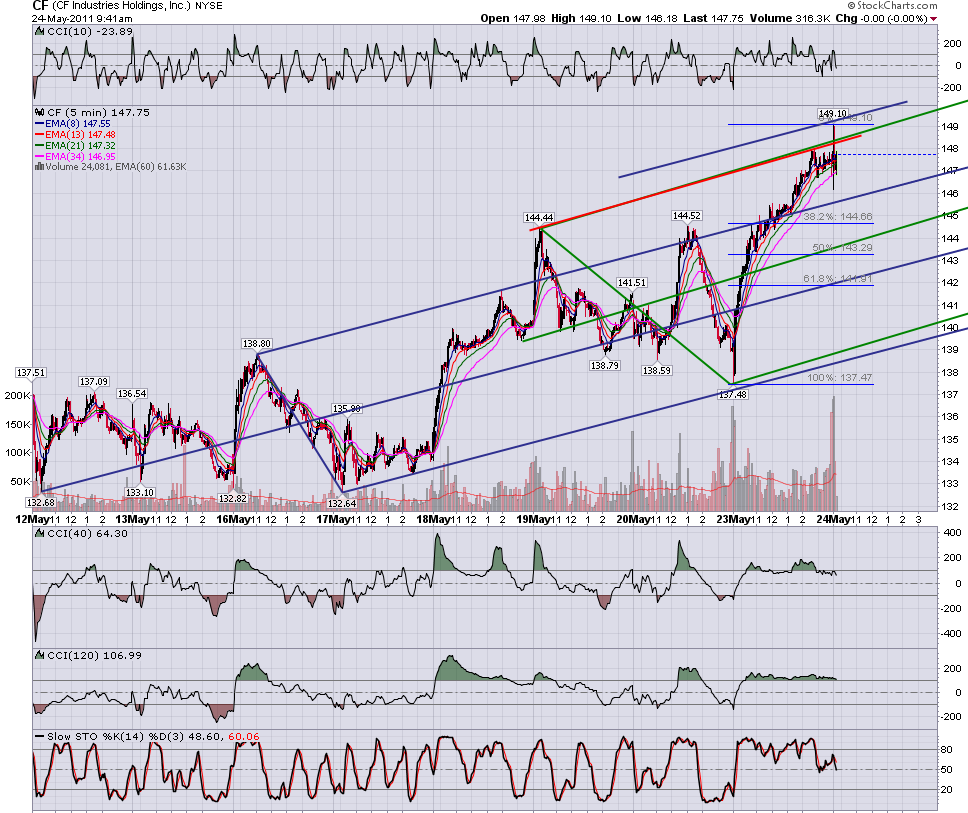
886


Click image for original size
RA
rat89
Rep: 0
Posts: 7,015
Click image for original size

Click image for original size
JA
jarek
Rep: 94
Posts: 3,474
Originally posted by jarek

Maybe to cure myself a bit I'll start to show bullish setups...
I see only bearish ones in ES at the moment...

Click image for original size
AL
albert
Rep: 99
Posts: 3,094
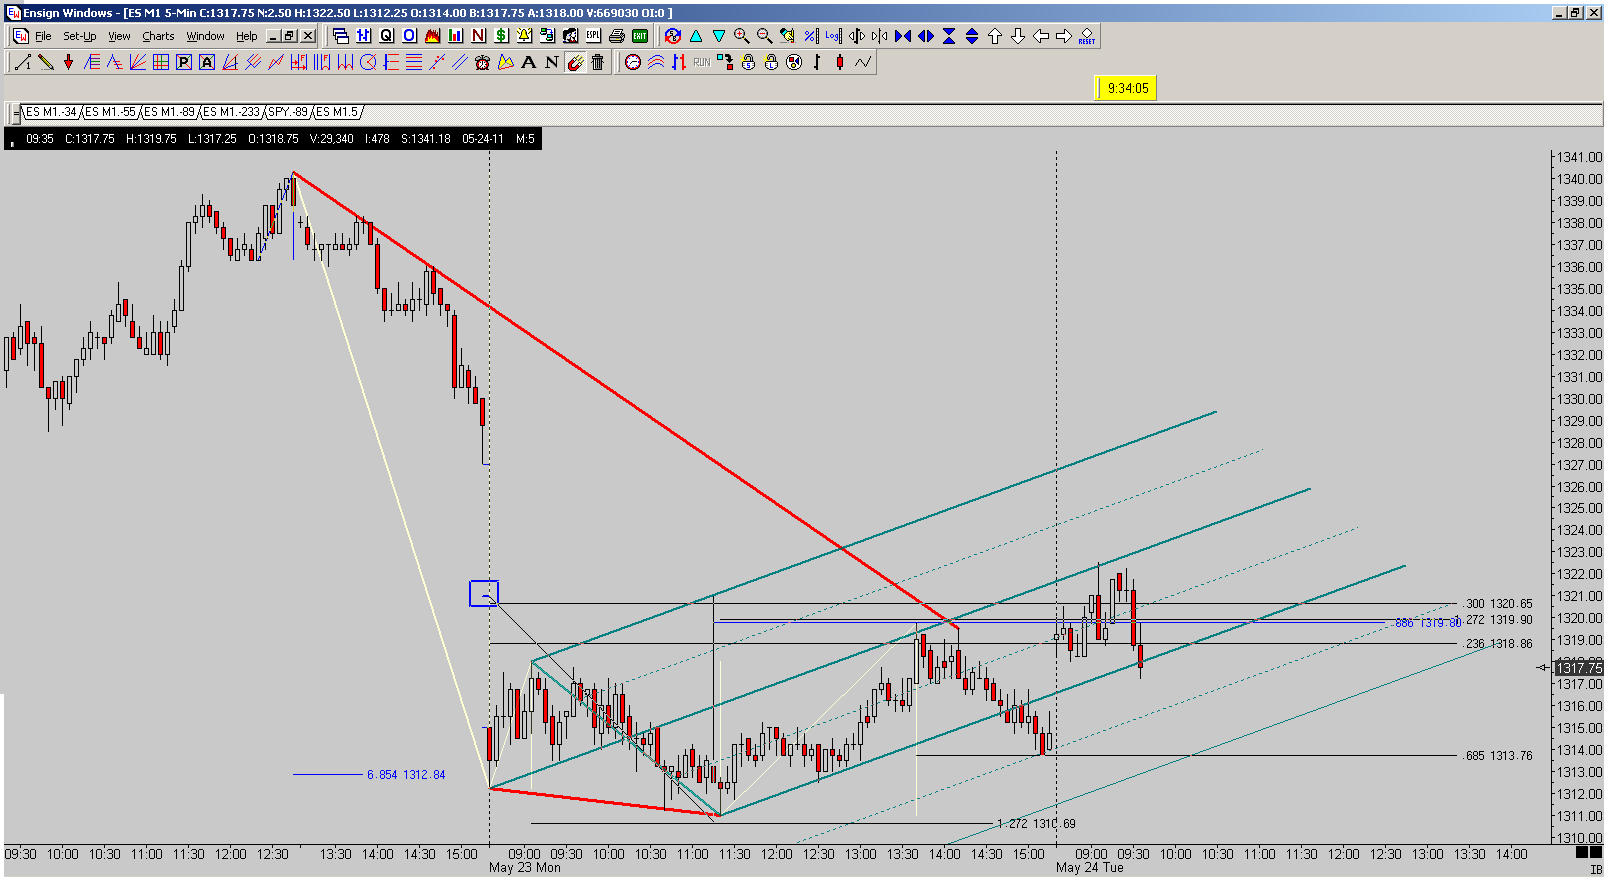
0.886 fibo on gap on 5 coinciding with trend line and Point D of Kane EXP ABCD.

Good Trading,

Al Kamego
Click image for original size
RA
rat89
Rep: 0
Posts: 7,015
heck if I know


Click image for original size
JI
jimkane
Rep: 3,058
Posts: 33,089
Okay, see everyone later. I'll try to do those updates on copper and the Swissie like I mentioned in those sections, and get to jarek's question on that being a KT rocking chair pattern failure setup, some time this weekend.