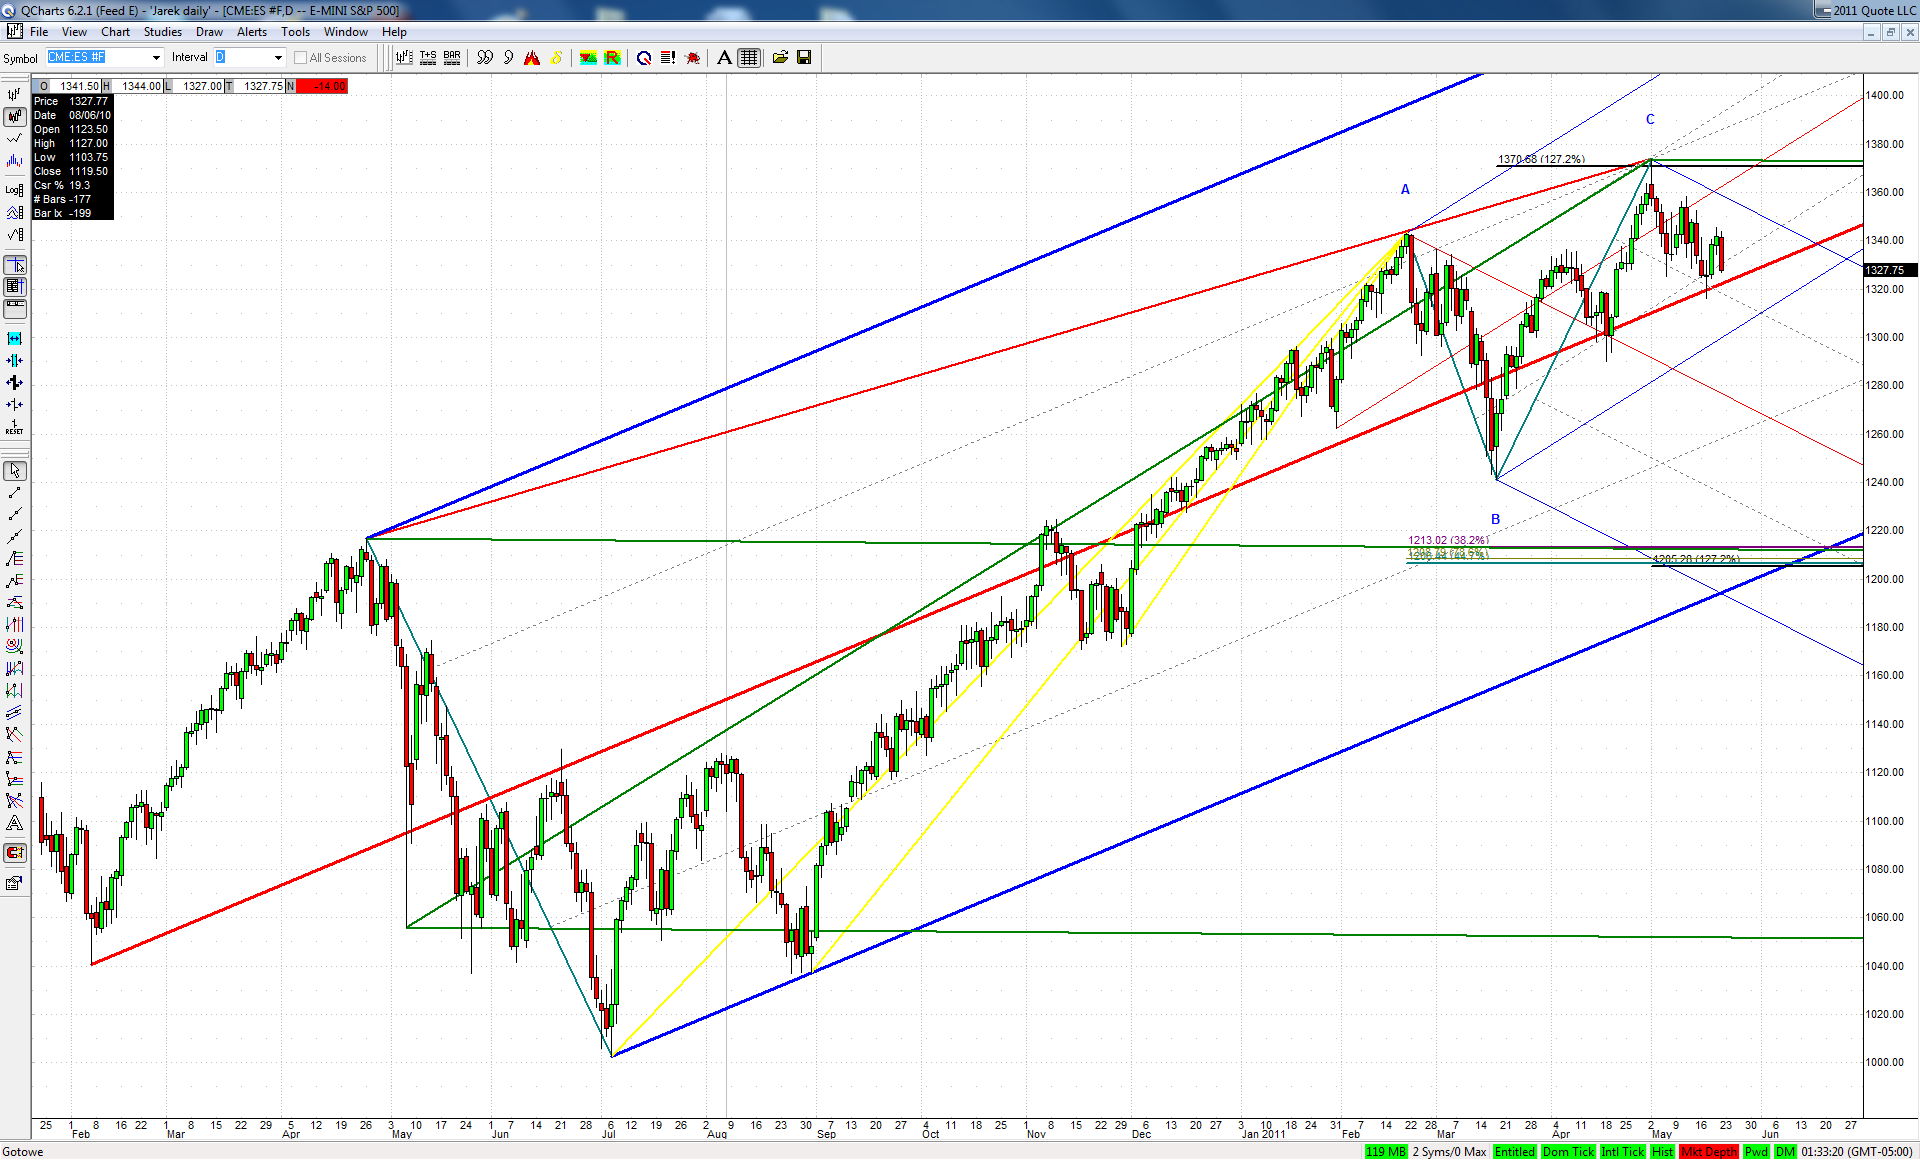
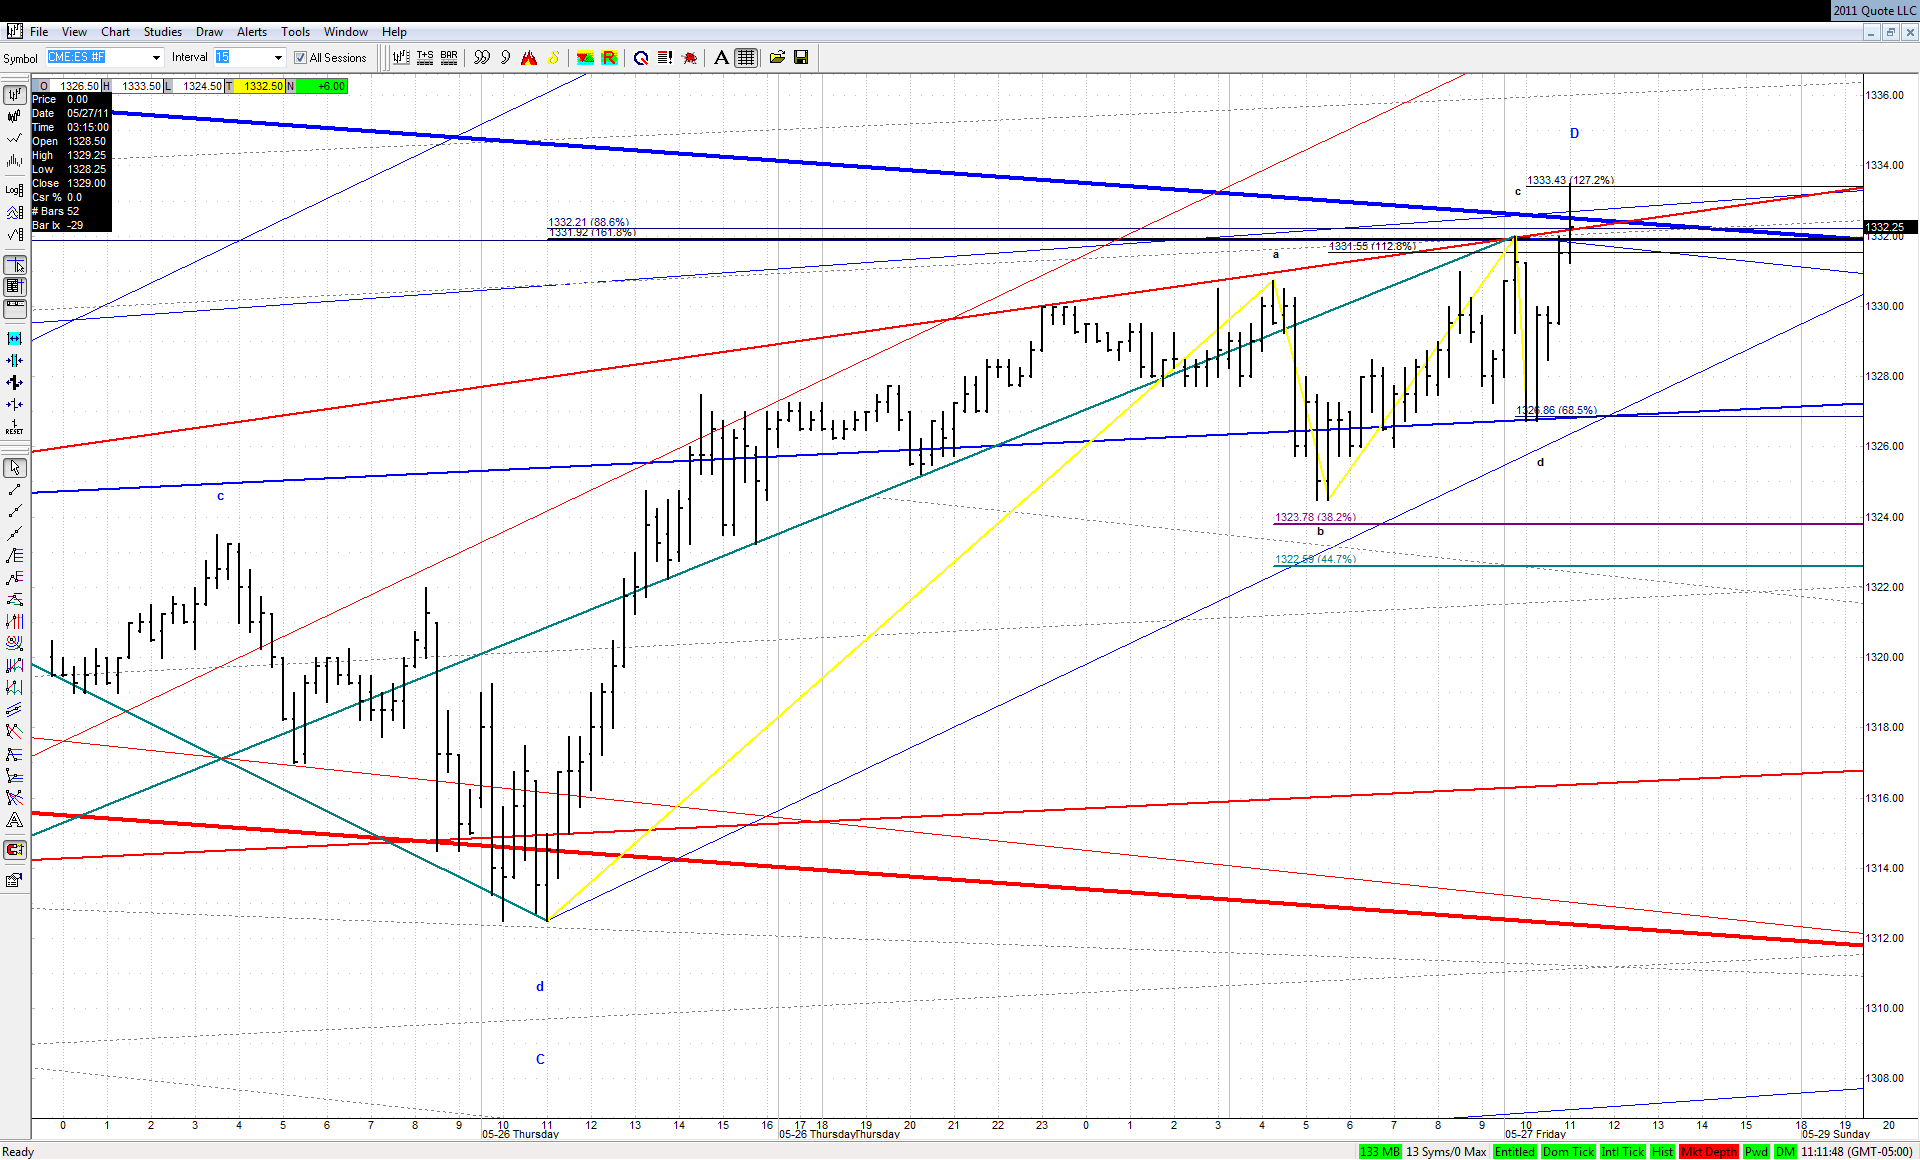
Here is the update of my longer term ES chart:
I know this potential drop of 10% in a couple of weeks is hard to conceive for some. But I can't find a better explanation for the corrective nature of the March-May rise
RA
rat89
Rep: 0
Posts: 7,015
you too jarek...great charts! they really want it up
Originally posted by jarek
That would be it for me today. Good trading and have a great weekend!
JI
jimkane
Rep: 3,058
Posts: 33,089
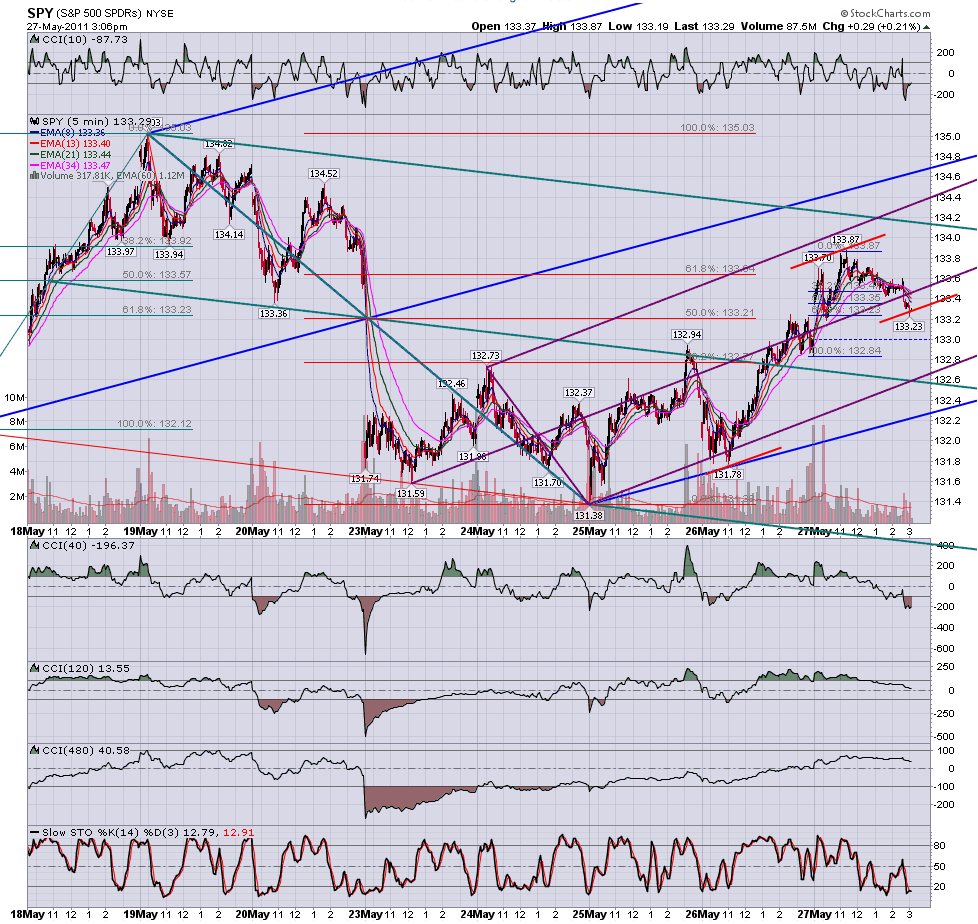
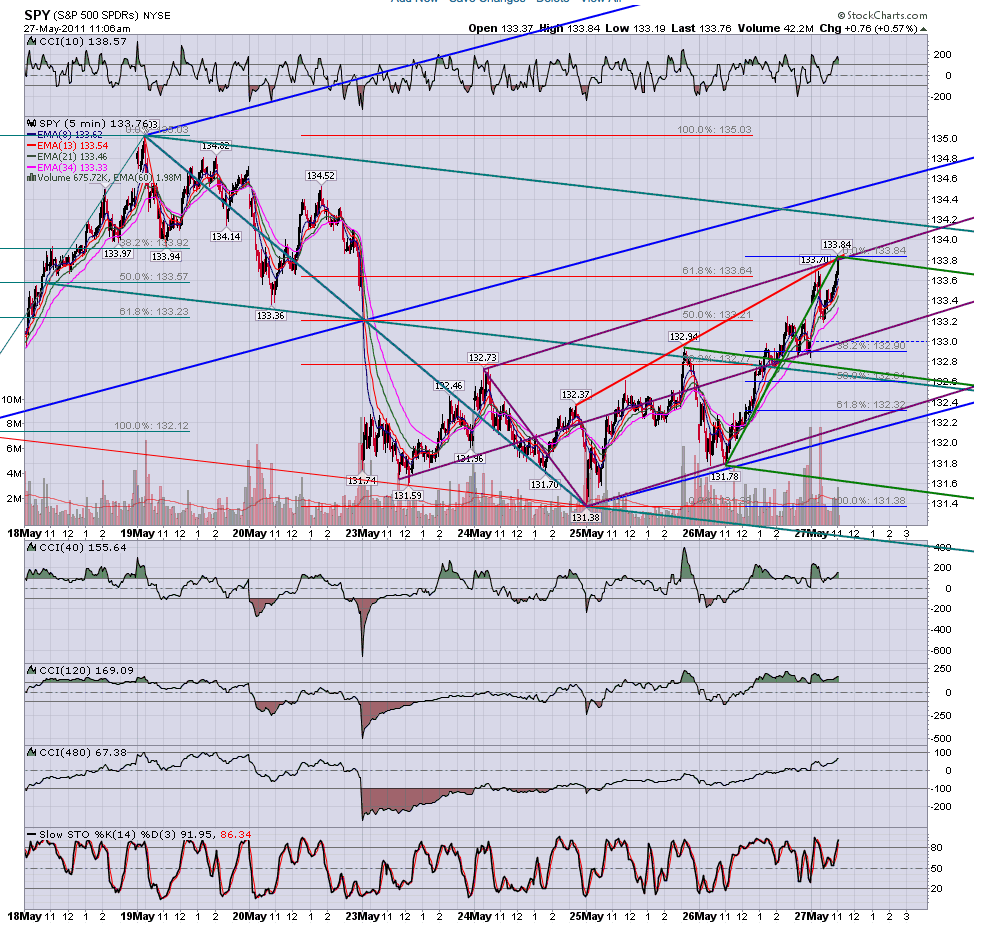
HOD was 33.75. I guess that's close enough, eh? Came right off it, but in this pre-holiday slow chop, it's hard to tell how serious this is because the volume is so light. All that grind, all that time, and it managed to drop a whole 6.00 points (but it is looking weaker now). Wow-ee. I thought it was worth a shot, but it is a real snoozefest. Keep in mind the possible 'W3' scenario. But, it did shoot right for the area, as I said I thought it would, and it did 'see' it. So far it looks like the 'W3' is still a strong possibility, given the inability for this to sell impulsively. But, it is light holiday trading...
Originally posted by jimkane
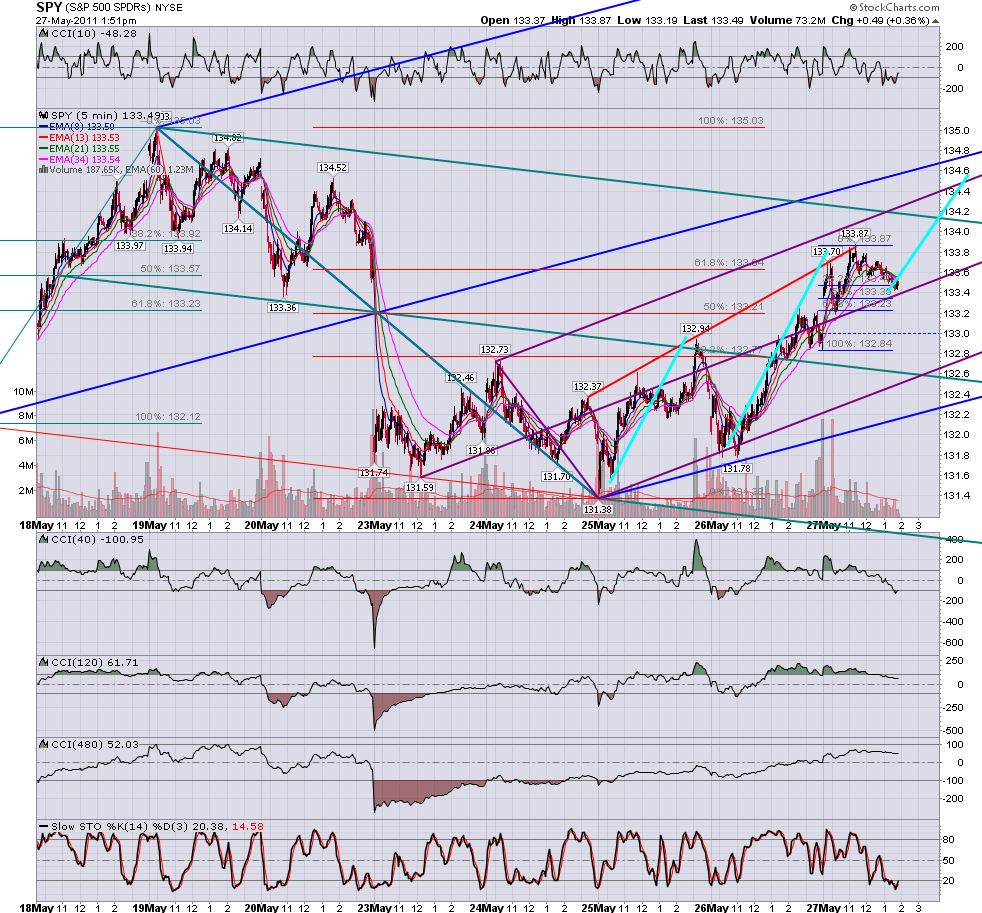
My next bigger key area is around 34-36. I'll refine this later if it does head up that-a-ways. What I don't like about that area is it is a very, very, very obvious area that has been tested many times (the TL), and it would do it with an ABCD. Too obvious. Makes me think if it got there it would be a 'W3'.
JI
jimkane
Rep: 3,058
Posts: 33,089
Note that very same TL that was broken above has been 'tested' many times now from above, and guess what?, it's right back on it here. Time to see how serious this HOD area is. Too bad it's the last hour of holiday trading. Now, how will they game it to set it up for Sunday night???