Merged Profile
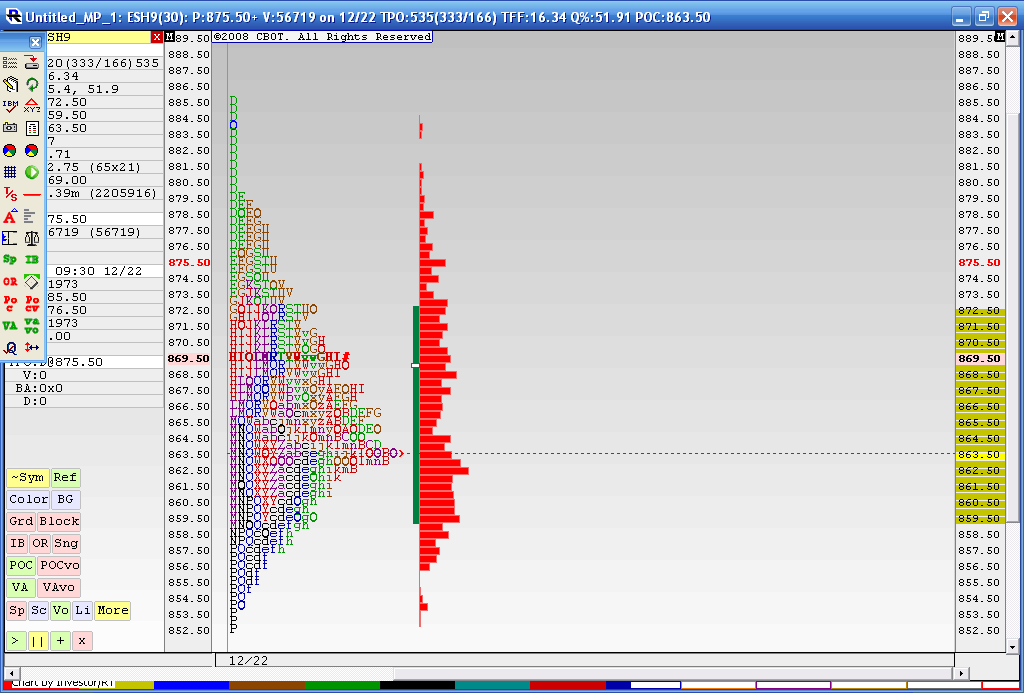
Below is the result from a 4 day merged profile as this is where we most recently have consolidated during holiday trade. The Value area high of this merge is 872.50 and the Value area low is 59.50. You may also notice that the 863.50 price has had the most trade through so far. This chart doesn't include today's trading. I think that 59.50 - 63.50 is the area we need to beat for any upside to take hold as we have the Va low and that Volume node. Current overnight high is 73.50 so it was fairly close to the merged VA high of 72.50.
In today's trading we have single prints created to the downside and through that high volume node. I'm skeptical because of the holidays and low volume but as most know we will trend many times after consolidations. I'm not sure if this counts. Anyway it's been fun firing up the old MP software for a change.
To make a long story longer: That 859.50 - 863.50 is the critical zone to watch.
Click image for original size
Bruce I read this everyday with great interest
quote:This is good stuff, keep up the good work
Originally posted by BruceM
what I am showing below is a 4 day merged profile of last week and Fridays trading. You can see how on Friday we opened right into an area of low volume ( The "I" period)from the Monday - Thursday range and tried to get into the Value area of the composite. WE sold off very hard from here down into the 890 area and lower which was the full weekly projection. That 909 - 910 is a key area. You may also remember that zone from the begining of this thread. That 895 - 898 will be another for any rally to overtake. Here is the chart.....is anyone actually reading these?
Bruce
Click image for original size

Monthly projections based on the first five days of January target 871 and then 848...I'm using 941 and 894 for the Monthly IB high and low
a close up of how they are trying to fill in the cleavage I've been mentioning....The left composite is all of December...on the right is all of January excluding today. We are trading down into the 873 level today...so far
Click image for original size
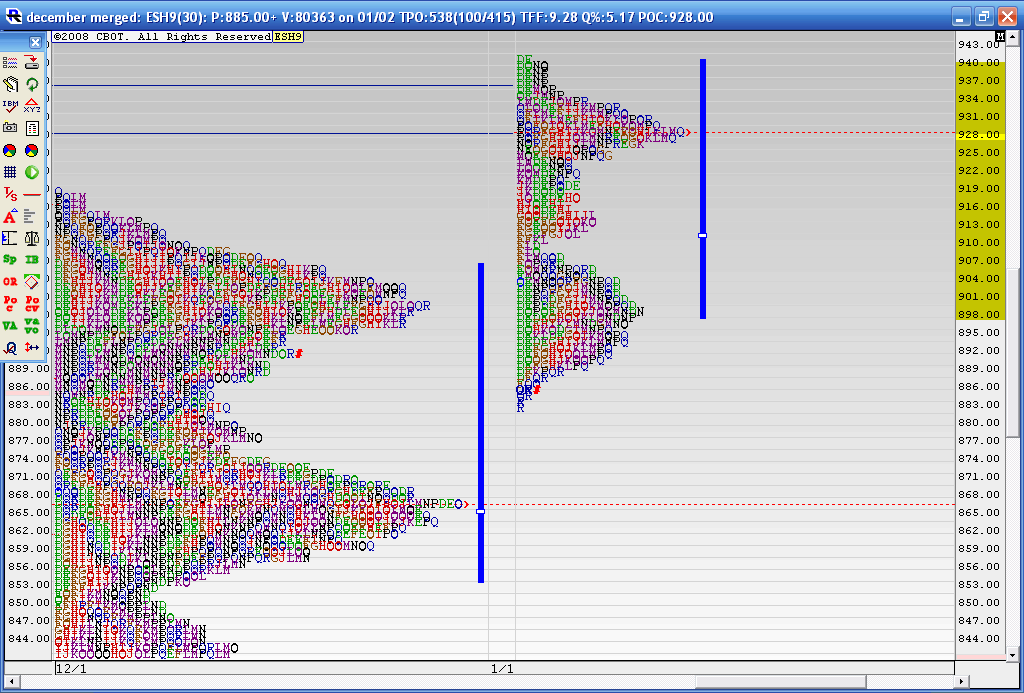
the 64 - 66 is the other "boob" . the longest line of prices from December...I don't expect prices to just bust right through so longs would be prefered against that area
here is the progress we are making in "filling" in the cleavage..e
Click image for original size
glad you folks are on board and thanks for coming on the journey....I think if we can hold that low of today and not get a daily close below that tomorrow then we are ready to go back into the 897 - 910 area this week....I'm going to assume that we still need to spend some time filling in this void in prices and that will take time.....I see no reason why they shouldn't want to start getting trades and volume into the 83 area on tuesday...then we will watch the direction of the Monday and tuesday range to help with direction
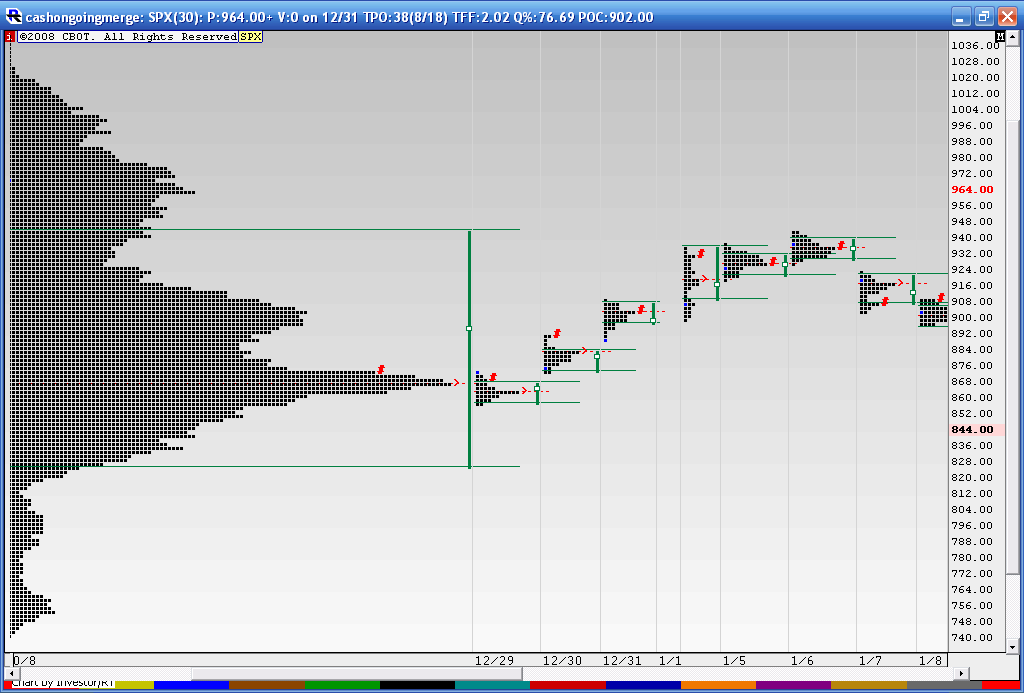
The MOnday -Tuesday range has now been established so we can form some additional targets.....ON the downside we get
844
830
on the upside is 900 and 914
The monthly has a lower target of 848 so if we see prices in the 844 - 848 it may get interesting..
I'm leaning towards the upside breakout though as we have tried to break down the last two days below the longer term composites high volume node and we haven't been able to do it. The last two days have formed a lower case "b" which many times is a clue to higher prices. We have a weekly pivot up at 903 which is close to the first upper target of 900 and the Developing value area low is up there too. And lots of single prints begin up there.. The 914 is also in an area of higher volume. O/N the way up I'll be watching the 882 area too as we have single prints and the Value area high of Monday...
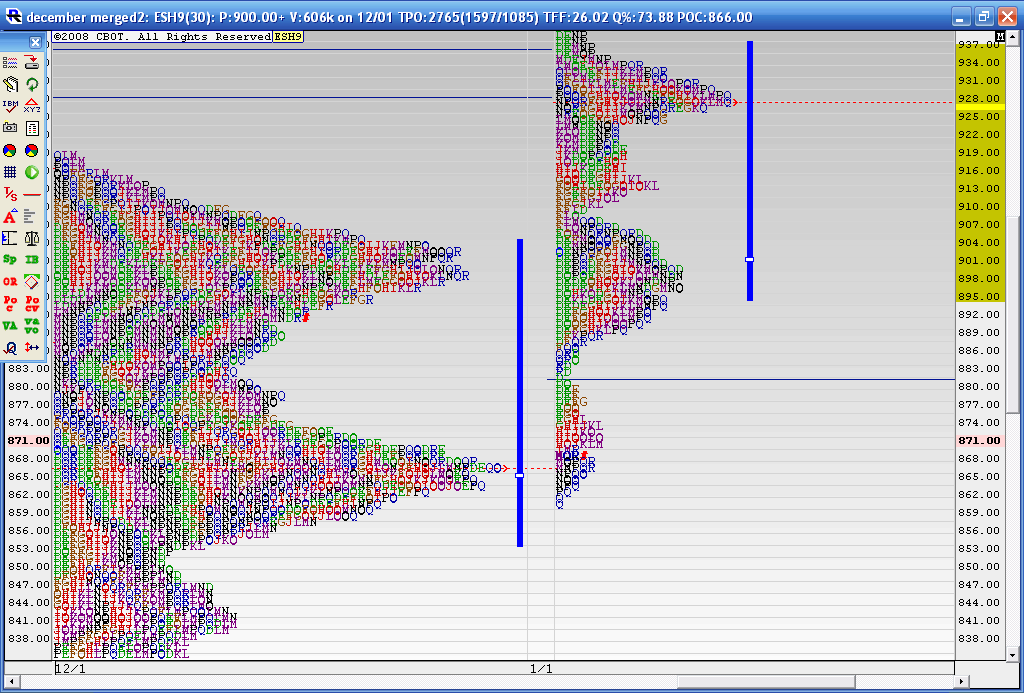
A picture sums up a lot better then my feeble explaination for higher prices.......this below chart shows all of December and then the right composite is all of January so far......not the low volume area that seems to have the 882 area as it's center...I think we will need to spend some time to the upside and fill this in..
844
830
on the upside is 900 and 914
The monthly has a lower target of 848 so if we see prices in the 844 - 848 it may get interesting..
I'm leaning towards the upside breakout though as we have tried to break down the last two days below the longer term composites high volume node and we haven't been able to do it. The last two days have formed a lower case "b" which many times is a clue to higher prices. We have a weekly pivot up at 903 which is close to the first upper target of 900 and the Developing value area low is up there too. And lots of single prints begin up there.. The 914 is also in an area of higher volume. O/N the way up I'll be watching the 882 area too as we have single prints and the Value area high of Monday...
A picture sums up a lot better then my feeble explaination for higher prices.......this below chart shows all of December and then the right composite is all of January so far......not the low volume area that seems to have the 882 area as it's center...I think we will need to spend some time to the upside and fill this in..
Click image for original size
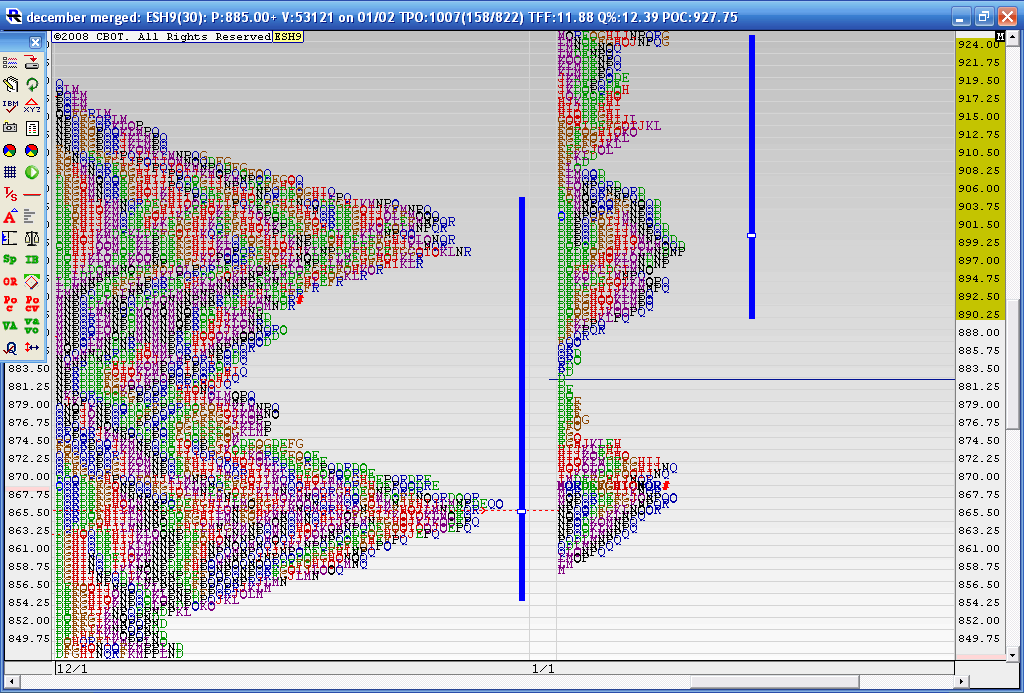
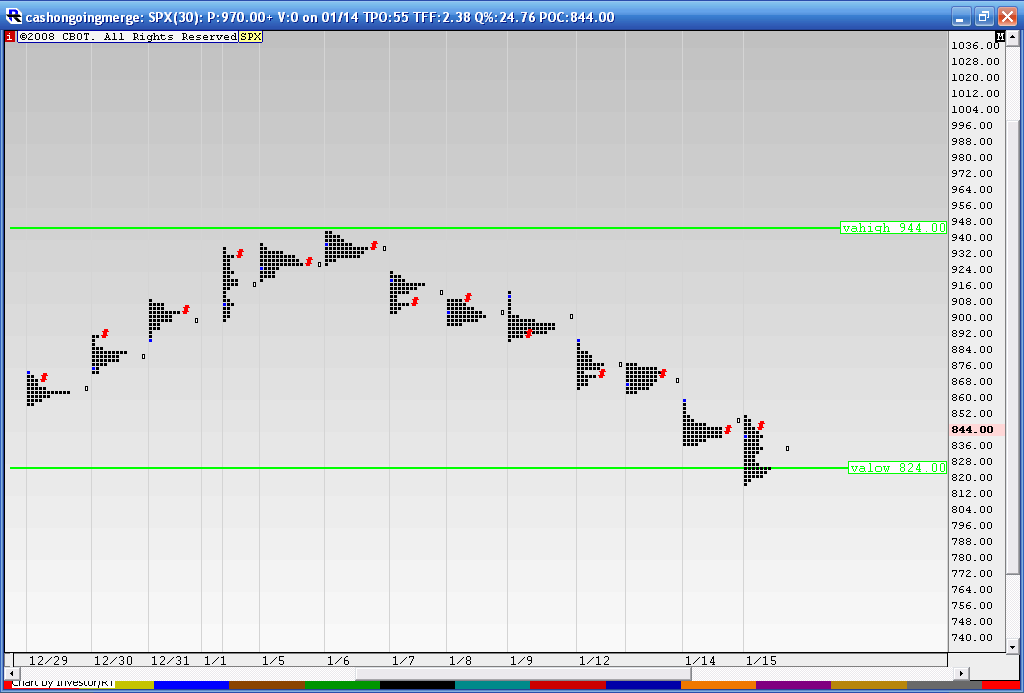
Here is a merged profile that shows the test of the Upper VA with the rally that started over Xmas...Note the test of the VA high on 1-06-08
Click image for original size
Then we roll over and look what happens today.....we have a breakout of the Lower Composite VA but a close back inside........does this mean we go higher to fill in that cleavage.....? Sure wish I knew!!
I extended the VA lines from the composite from the chart in the previous post..here's what I get
I extended the VA lines from the composite from the chart in the previous post..here's what I get
Click image for original size
We had a break out up on yesterdays high Volume fed announcement.....now we need to see if we can attract Volume above...my feeling is that they will fail on this breakout and we will get daily closes back below 867.....Sure hope I'm wrong for the longer term players like myself....I'll get a chart later
Emini Day Trading /
Daily Notes /
Forecast /
Economic Events /
Search /
Terms and Conditions /
Disclaimer /
Books /
Online Books /
Site Map /
Contact /
Privacy Policy /
Links /
About /
Day Trading Forum /
Investment Calculators /
Pivot Point Calculator /
Market Profile Generator /
Fibonacci Calculator /
Mailing List /
Advertise Here /
Articles /
Financial Terms /
Brokers /
Software /
Holidays /
Stock Split Calendar /
Mortgage Calculator /
Donate
Copyright © 2004-2023, MyPivots. All rights reserved.
Copyright © 2004-2023, MyPivots. All rights reserved.