Merged Profile
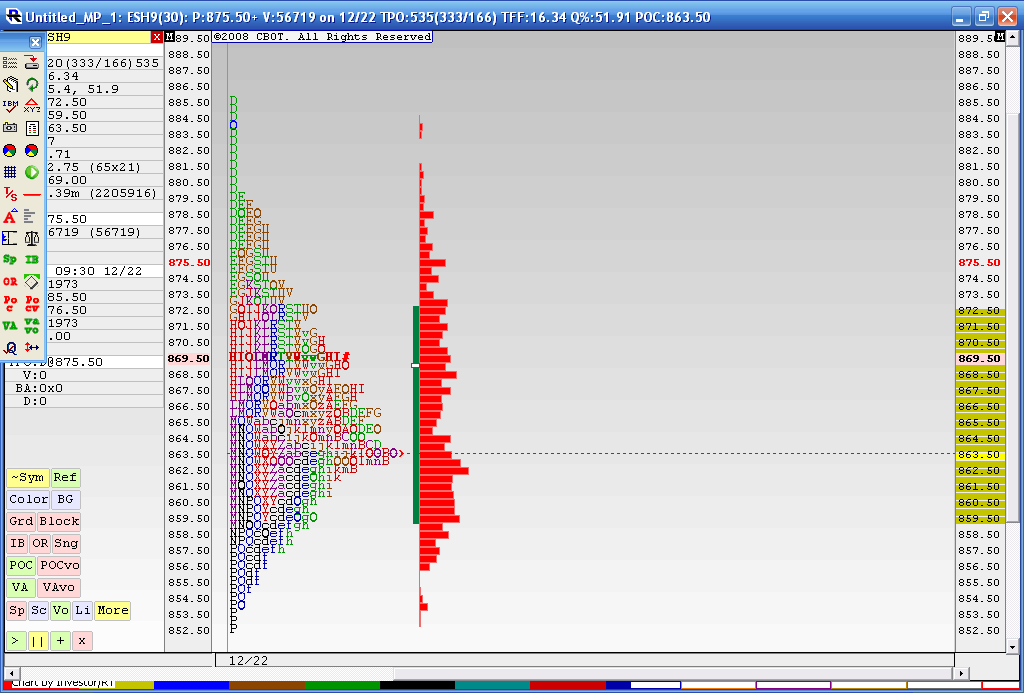
Below is the result from a 4 day merged profile as this is where we most recently have consolidated during holiday trade. The Value area high of this merge is 872.50 and the Value area low is 59.50. You may also notice that the 863.50 price has had the most trade through so far. This chart doesn't include today's trading. I think that 59.50 - 63.50 is the area we need to beat for any upside to take hold as we have the Va low and that Volume node. Current overnight high is 73.50 so it was fairly close to the merged VA high of 72.50.
In today's trading we have single prints created to the downside and through that high volume node. I'm skeptical because of the holidays and low volume but as most know we will trend many times after consolidations. I'm not sure if this counts. Anyway it's been fun firing up the old MP software for a change.
To make a long story longer: That 859.50 - 863.50 is the critical zone to watch.
Click image for original size
Mon-Tuesday range was 724 -689....35 points range.......so 8.5 point increments......got us to 680.5, then 72.....then 63.5 ( hasn't traded yet).......you know it red.....but for those who don't......then 8.5 below...today completes the first 5 days of the month so we can get monthly targets going too
The 5, 10 & 20 day overlay chart after last week's trade was on the money again. Today buyers made straight for the POC for those periods. If buyers come in again after a period of cosolidation it is pretty obvious what their target area will be.
Click image for original size
Thank you for the charts I had an "ahaa" moment....I noticed how the markets broke out of the box on the 30 min chart that we have been in for about 3 days the ES broke out of this box and ran to the last trading range or as I call it trading box which was a range from 03/02 thru 03/04 (724-695) and the POC for those days was 708....very interesting
The next trading range on the way up is 2/20-2/26 and its POC for that merged profile is 765 so be interesting to see what happens around that last range POC....
Thanks;
D.W. / Joe
D.W. / Joe
Yesterday we traded from the open, a couple of points below the VAL, clear trough the VAH to the POC of the past 20 days. After some consolidation prices worked their way up to the area of the VAH of the last couple of weeks.
Overnight prices have tested yesterday's POC successfully as support and already traded through yesterday's high to 730.00. If we refer to the VA Overlay chart above we see that the low of the next distribution areas are in the 734.00 - 739.00 area. If you recall 734.00 proved to be stubborn support for a few weeks before we finally cascaded on down to the recent low of the year.
It is quite probable that previous support will become significant resistance parrticular on the first test. Support areas for today, should we traded lower from a test of the 734.00 area, should be expected in the 722 - 724 .00 area and the 715 - 717.00 area.
Have a good day.
Yeaterday I had a range extension projection of 61.8% @ 708.75. Thanks for your post D.W.
yesterday*...(need more coffee)
dayfd,
good stuff..thanx for posting. I am a new member of this chat. I look forward to contributing some helpful things in return.
good stuff..thanx for posting. I am a new member of this chat. I look forward to contributing some helpful things in return.
quote:
Originally posted by joseph000
dayfd,
good stuff..thanx for posting. I am a new member of this chat. I look forward to contributing some helpful things in return.
You're welcome. I'm an intermittent contributor. The real power house, from whom you can learn plenty about MP, is the moderator - Bruce.
With a bullish TRIN and a positive OBV we should see up side range extension of the Initial Balance (IB). The likely stopping price - selling tail - is likely going to be in the 734.00 - 739.00 area.
We had a break out up on yesterdays high Volume fed announcement.....now we need to see if we can attract Volume above...my feeling is that they will fail on this breakout and we will get daily closes back below 867.....Sure hope I'm wrong for the longer term players like myself....I'll get a chart later
Emini Day Trading /
Daily Notes /
Forecast /
Economic Events /
Search /
Terms and Conditions /
Disclaimer /
Books /
Online Books /
Site Map /
Contact /
Privacy Policy /
Links /
About /
Day Trading Forum /
Investment Calculators /
Pivot Point Calculator /
Market Profile Generator /
Fibonacci Calculator /
Mailing List /
Advertise Here /
Articles /
Financial Terms /
Brokers /
Software /
Holidays /
Stock Split Calendar /
Mortgage Calculator /
Donate
Copyright © 2004-2023, MyPivots. All rights reserved.
Copyright © 2004-2023, MyPivots. All rights reserved.