Merged Profile
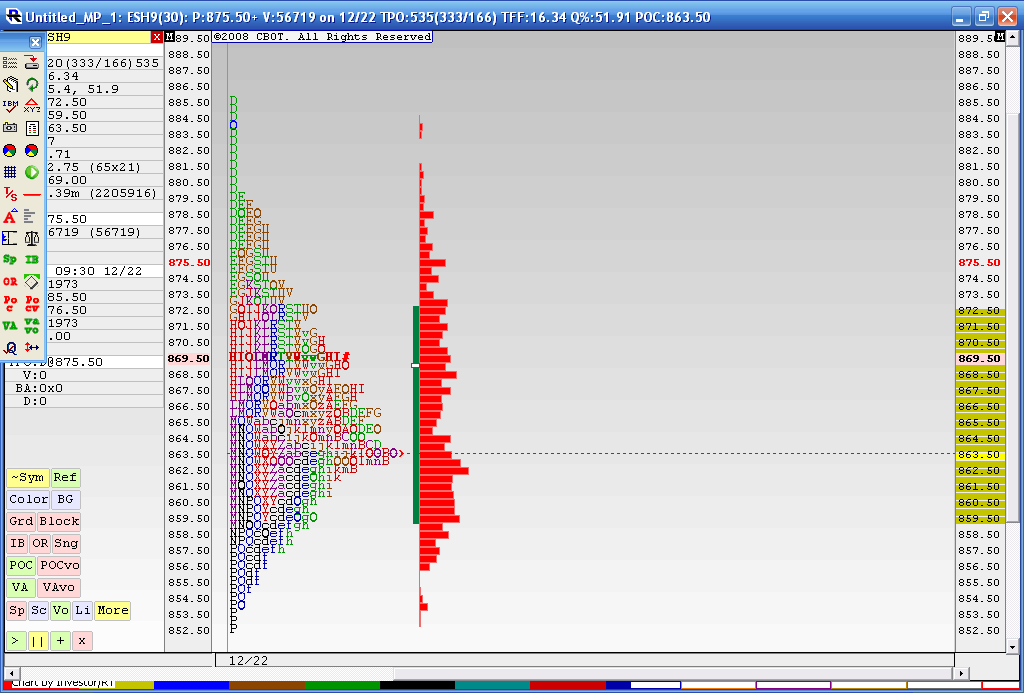
Below is the result from a 4 day merged profile as this is where we most recently have consolidated during holiday trade. The Value area high of this merge is 872.50 and the Value area low is 59.50. You may also notice that the 863.50 price has had the most trade through so far. This chart doesn't include today's trading. I think that 59.50 - 63.50 is the area we need to beat for any upside to take hold as we have the Va low and that Volume node. Current overnight high is 73.50 so it was fairly close to the merged VA high of 72.50.
In today's trading we have single prints created to the downside and through that high volume node. I'm skeptical because of the holidays and low volume but as most know we will trend many times after consolidations. I'm not sure if this counts. Anyway it's been fun firing up the old MP software for a change.
To make a long story longer: That 859.50 - 863.50 is the critical zone to watch.
Click image for original size
it's interesting in light of the fact that we were talking about the overnight, that if you didn't take the breakout out in the overnight or where lucky enough to be short on Fridays close then you would have missed the whole down move........so in this case the overnight markets where rewarded but day session traders where left out in the cold......BUT...
there where no "other time frame" traders that entered on Tuesdays lows....no real hour breakout down.......for me I'm a seller in early trade as we had a good negative TICK and poor breadth........odds favor some downside a bit...but how do we qualify "too much" selling.......not expecting a big sell off today and perhaps we will actually rally after the down retest
there where no "other time frame" traders that entered on Tuesdays lows....no real hour breakout down.......for me I'm a seller in early trade as we had a good negative TICK and poor breadth........odds favor some downside a bit...but how do we qualify "too much" selling.......not expecting a big sell off today and perhaps we will actually rally after the down retest
IRT is what I use.....
it's interesting that the last two days have not been able to see follow thru to the downside by breaking the hour lows except for back to back end of day selling. Now 90 - 93 will hold the key and this goes well with the weekly S1 level. Those who use the first 5 days of a month and calculate targets ( Like an hourly IB) hit the 50 % IB yesterday down at 778........further downside will target the 748 - 750......BUT if we look at the gap and the last two days trade we get the 'b' pattern........and it sure does seem like "secret " buying has taken place to go retest up to the 806 - 812 area...
this would get us to 50% of a weekly IB target........hopefully we'll get some good clues after we open today
this would get us to 50% of a weekly IB target........hopefully we'll get some good clues after we open today
Invariably previous support is tested as resistance. The lack of robust follow through as noted by Bruce along with the extreme low reading of the 2 day RSI at yesterday's close suggests that today is the day we wil test that key 802.00 - 809.00 area. I don't think we'll see something more substative to the upside until we see a positive divergence in the 2 day RSI.
Bruce's using the first 5 days of the month as a monthly IB is new to me. Presumably Bruce, the principles of MP concerning the IB, e.g. the principle of eigths on rotation, are applicable with a high degree of success?
Bruce's using the first 5 days of the month as a monthly IB is new to me. Presumably Bruce, the principles of MP concerning the IB, e.g. the principle of eigths on rotation, are applicable with a high degree of success?
The net effort of the last three sessions is such that one should cosider the 3 day composite MP for the next move - VAH @ 795.00, VAL @ 779.50 and a POC @ 782.00 - 783.00.
A volume breakout of the VA should give us a lead into the next immediate trend. With an extreme 2 day RSI <2.00 the odds are that prices will breakout to the up side and possibly break through the near resistance area 802.00 - 809.00. If so we should likely see prices make their way to the 834.00 - 839.00 area. Should the grossly OS market become even more oversod we are likely to test the 2008 low. The latter seems unlikely at the moment.
A volume breakout of the VA should give us a lead into the next immediate trend. With an extreme 2 day RSI <2.00 the odds are that prices will breakout to the up side and possibly break through the near resistance area 802.00 - 809.00. If so we should likely see prices make their way to the 834.00 - 839.00 area. Should the grossly OS market become even more oversod we are likely to test the 2008 low. The latter seems unlikely at the moment.
The same principles would apply...I like the projections and will break them up into quarters.........we have Monthly and weekly projections coming in at 761 - 64 so that is the downsdie Zone I'm watching in the day session if we continue to open lower from the overnight here......further failure will target that 48 - 50 area...I'd like to see some responsive buying come in with these lower prices todayf.
quote:
Originally posted by dafydd
Invariably previous support is tested as resistance. The lack of robust follow through as noted by Bruce along with the extreme low reading of the 2 day RSI at yesterday's close suggests that today is the day we wil test that key 802.00 - 809.00 area. I don't think we'll see something more substative to the upside until we see a positive divergence in the 2 day RSI.
Bruce's using the first 5 days of the month as a monthly IB is new to me. Presumably Bruce, the principles of MP concerning the IB, e.g. the principle of eigths on rotation, are applicable with a high degree of success?
The projections come from our good friend AlleyB and the CBOT handbook....
use the First 5 trading days on the month for the monthly projections and a Monthly IB
Use the first two trading days of the week for weekly projections and a weekly IB....
I break the ranges up into quarters and look for confluence zones..
The projection "carry over" to the following week, or month until we have a new IB to work with.....
So weekly projections for example will be valid until the following weeks first two days of trading when a new IB forms...
Bruce
Bruce,
Many Thanks for the info. on weekly and monthly VAs. You should be paid for the good stuff you post here almost daily. Again, thanks!
Many Thanks for the info. on weekly and monthly VAs. You should be paid for the good stuff you post here almost daily. Again, thanks!
no problem D.W. I think somebody is reading our stuff today.....with an overnight low so far at 61.25....seems like that should get run out in the RTH session....
quote:
Originally posted by dafydd
Bruce,
Many Thanks for the info. on weekly and monthly VAs. You should be paid for the good stuff you post here almost daily. Again, thanks!
We had a break out up on yesterdays high Volume fed announcement.....now we need to see if we can attract Volume above...my feeling is that they will fail on this breakout and we will get daily closes back below 867.....Sure hope I'm wrong for the longer term players like myself....I'll get a chart later
Emini Day Trading /
Daily Notes /
Forecast /
Economic Events /
Search /
Terms and Conditions /
Disclaimer /
Books /
Online Books /
Site Map /
Contact /
Privacy Policy /
Links /
About /
Day Trading Forum /
Investment Calculators /
Pivot Point Calculator /
Market Profile Generator /
Fibonacci Calculator /
Mailing List /
Advertise Here /
Articles /
Financial Terms /
Brokers /
Software /
Holidays /
Stock Split Calendar /
Mortgage Calculator /
Donate
Copyright © 2004-2023, MyPivots. All rights reserved.
Copyright © 2004-2023, MyPivots. All rights reserved.