Merged Profile
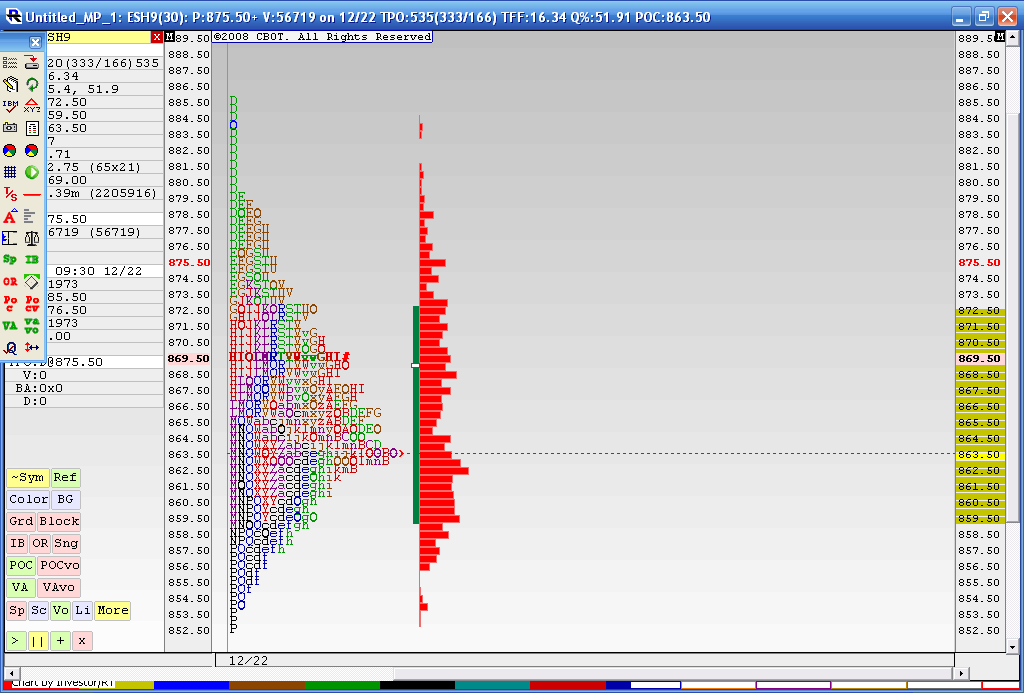
Below is the result from a 4 day merged profile as this is where we most recently have consolidated during holiday trade. The Value area high of this merge is 872.50 and the Value area low is 59.50. You may also notice that the 863.50 price has had the most trade through so far. This chart doesn't include today's trading. I think that 59.50 - 63.50 is the area we need to beat for any upside to take hold as we have the Va low and that Volume node. Current overnight high is 73.50 so it was fairly close to the merged VA high of 72.50.
In today's trading we have single prints created to the downside and through that high volume node. I'm skeptical because of the holidays and low volume but as most know we will trend many times after consolidations. I'm not sure if this counts. Anyway it's been fun firing up the old MP software for a change.
To make a long story longer: That 859.50 - 863.50 is the critical zone to watch.
Click image for original size
So it seems to me that before a significant decline or rally is to happen we need to fill in the high volume and the low volume area up above in the 64 area and then the 85 area...this would make a more mature composite and a more complete structure.....
That would be the type of chart the vendors show in hindsight...I want to see if it happens ahead of time without the benefit of looking back.
That would be the type of chart the vendors show in hindsight...I want to see if it happens ahead of time without the benefit of looking back.
Bruce you know I'm MP illiterate but enjoy going over your thread every night. What is the significance of starting your composite SPX at what appears to be 10/08?...at first I thought a quarterly look but see that you extended the value lines past that.
This is the last merged Jan you posted. You are wanting to see this area filled in correct? In your post tonight you talk about the 64 through 85 area. Did you mean 64 - 95? Not trying to turn your thread into an MP for beginners class.
Click image for original size

Excellent point VO... I did this because we have been consolidating from that day forward....look at a traditional bar chart and you will see how we really haven't gone anywhere since the down thrust that started at around the 8th of October.....This stuff becomes very subjective and I am certainly no expert either. I kind of thought that it may get too subjective....but the other thing is we can have time frames in conflict so it's very tricky for ME to decipher for the longer term but bring up that bar chart and look at how much of the daily price action has been contained begining with the October 8 - 10th area.....
The real trick is to fiqure out how to define a breakout from value. I've seen price being "accepted" ( MP traders love that word) above a previous days value area only to be "rejected" ( MP traders love that word too) soon after and close back in the previous days Value area......so how do we decide what a valid breakout truely is?
That's the best answer I have for now and I'm sorry if it isn't that good of a reply to your question..
quote:
Originally posted by VOwater
Bruce you know I'm MP illiterate but enjoy going over your thread every night. What is the significance of starting your composite SPX at what appears to be 10/08?...at first I thought a quarterly look but see that you extended the value lines past that.
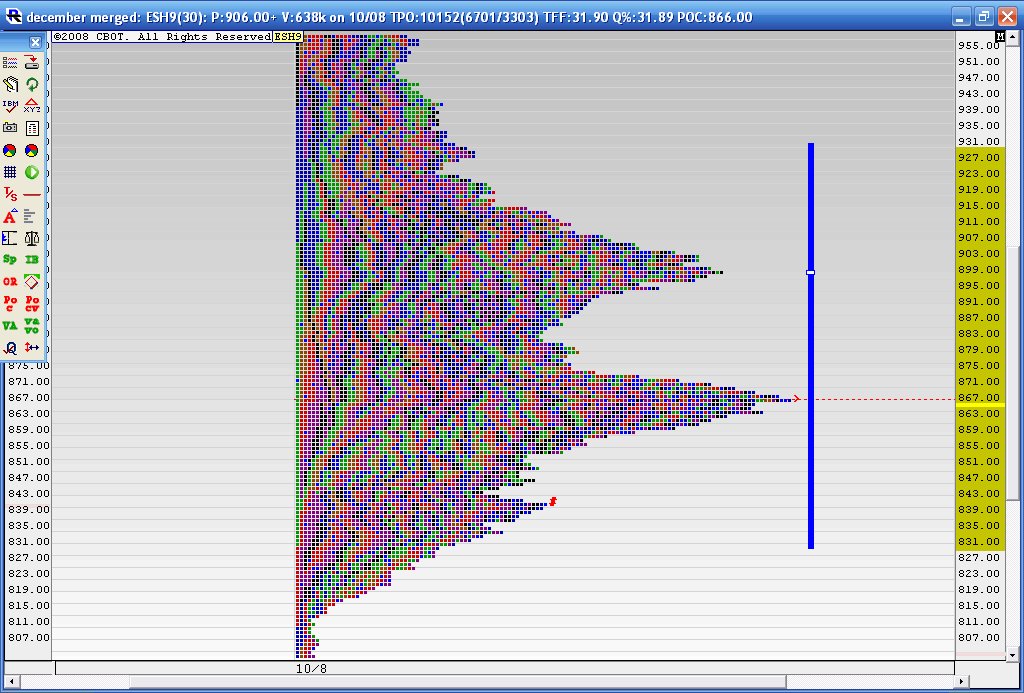
If you could visually slide the right profile ( where your red vertical arrow is) over and merge it with the left you can see that we filled in more of the profile in the 95 area.....we also filled in some near the 64 area too....
The longest line of prices now forms at 64 so that is the price that would be called most fair.....fair prices have the biggest buldge and "unfair prices" will have the valley area and also form at extremes ...so value traders want to buy at the low unfair prices and sell at the higher unfair prices ....we need to fill in the valley but also get over that peak at 64....I switched to the cash to make it easier for me to see...........the longer term traders will look at general areas I think....and won't be concerned if the numbers are off by a few points.....or so I'm told.....again this is about theory and seeing if the theroy matches up with what actually happens.. I'll try to run a ESH9 chart in the AM and see what it come up with
The longest line of prices now forms at 64 so that is the price that would be called most fair.....fair prices have the biggest buldge and "unfair prices" will have the valley area and also form at extremes ...so value traders want to buy at the low unfair prices and sell at the higher unfair prices ....we need to fill in the valley but also get over that peak at 64....I switched to the cash to make it easier for me to see...........the longer term traders will look at general areas I think....and won't be concerned if the numbers are off by a few points.....or so I'm told.....again this is about theory and seeing if the theroy matches up with what actually happens.. I'll try to run a ESH9 chart in the AM and see what it come up with
quote:
Originally posted by VOwater
This is the last merged Jan you posted. You are wanting to see this area filled in correct? In your post tonight you talk about the 64 through 85 area. Did you mean 64 - 95? Not trying to turn your thread into an MP for beginners class.
Click image for original size
here VO..here is how we are looking on the esh9.....there can also be scaleing issues as I have to use 1 point increments to fit most of the chart on the screen......we have the 66 area up to the 899 area that needs to be filled in more... so I think that most will be using a buy low and sell high strategy untill we get a nice bell curve or close to it.....Your on this journey with me and I don't have all the answers/......I'm open for suggestions and advice with any and all of my posts
Click image for original size
Bruce thanks for taking the time to answer. It makes perfect sense now. Assuming that over time the valley gets filled in, what happens at that point?
In general Vo, once we have a "mature" profile then we look for signs of a breakout. This can happen on all time frames but in this example we would want to trade from the side that breaks away from the longest volume node...basically our 64 - 67 area.
Unfortunately I have not found any great answers to trading the breakaway but we can look for single prints and buying and selling tails for possible direction.
Whats going on now is like the rubber band concept with the high volume node as the anchor.....we stretched the rubber band to the upside and then snapped back to the high volume node....then they stretched it to the downside and are now attempting to snap it back to the upside.
So your question is really asking:
How do we trade for the situation when the rubber band snaps and we don't have regression to the mean? A damn good question......hopefully we can start filling in some clues for our selves soon....
The basic concept works on all time frames...that is how I generally trade intra day and also why you will see me scramble when the volatility band snaps and they keep it going the same direction....we will only revert back to the mean for so long and as we do we build value and common consensus of what is a "fair" price. Then the market seeks out a new level that is considered fair.
quote:
Originally posted by VOwater
Bruce thanks for taking the time to answer. It makes perfect sense now. Assuming that over time the valley gets filled in, what happens at that point?
Nice thread, Bruce.
thanks Reaper...I'm trying to fiqure out this longer term stuff.....please chime in if you have any ideas
We had a break out up on yesterdays high Volume fed announcement.....now we need to see if we can attract Volume above...my feeling is that they will fail on this breakout and we will get daily closes back below 867.....Sure hope I'm wrong for the longer term players like myself....I'll get a chart later
Emini Day Trading /
Daily Notes /
Forecast /
Economic Events /
Search /
Terms and Conditions /
Disclaimer /
Books /
Online Books /
Site Map /
Contact /
Privacy Policy /
Links /
About /
Day Trading Forum /
Investment Calculators /
Pivot Point Calculator /
Market Profile Generator /
Fibonacci Calculator /
Mailing List /
Advertise Here /
Articles /
Financial Terms /
Brokers /
Software /
Holidays /
Stock Split Calendar /
Mortgage Calculator /
Donate
Copyright © 2004-2023, MyPivots. All rights reserved.
Copyright © 2004-2023, MyPivots. All rights reserved.