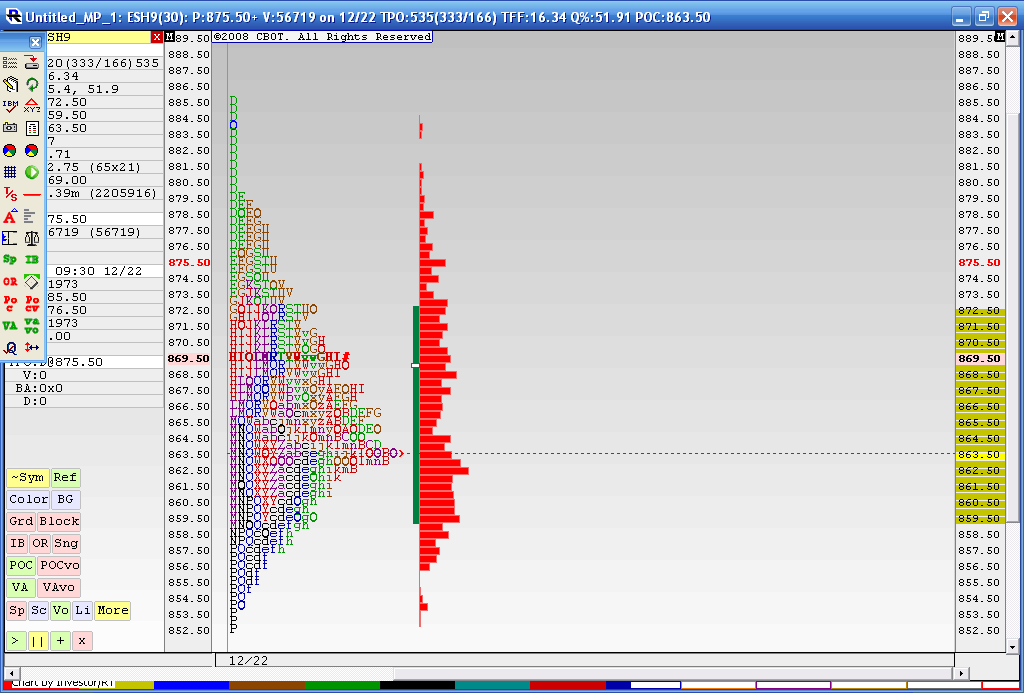
Merged Profile
Below is the result from a 4 day merged profile as this is where we most recently have consolidated during holiday trade. The Value area high of this merge is 872.50 and the Value area low is 59.50. You may also notice that the 863.50 price has had the most trade through so far. This chart doesn't include today's trading. I think that 59.50 - 63.50 is the area we need to beat for any upside to take hold as we have the Va low and that Volume node. Current overnight high is 73.50 so it was fairly close to the merged VA high of 72.50.
In today's trading we have single prints created to the downside and through that high volume node. I'm skeptical because of the holidays and low volume but as most know we will trend many times after consolidations. I'm not sure if this counts. Anyway it's been fun firing up the old MP software for a change.
To make a long story longer: That 859.50 - 863.50 is the critical zone to watch.
Click image for original size
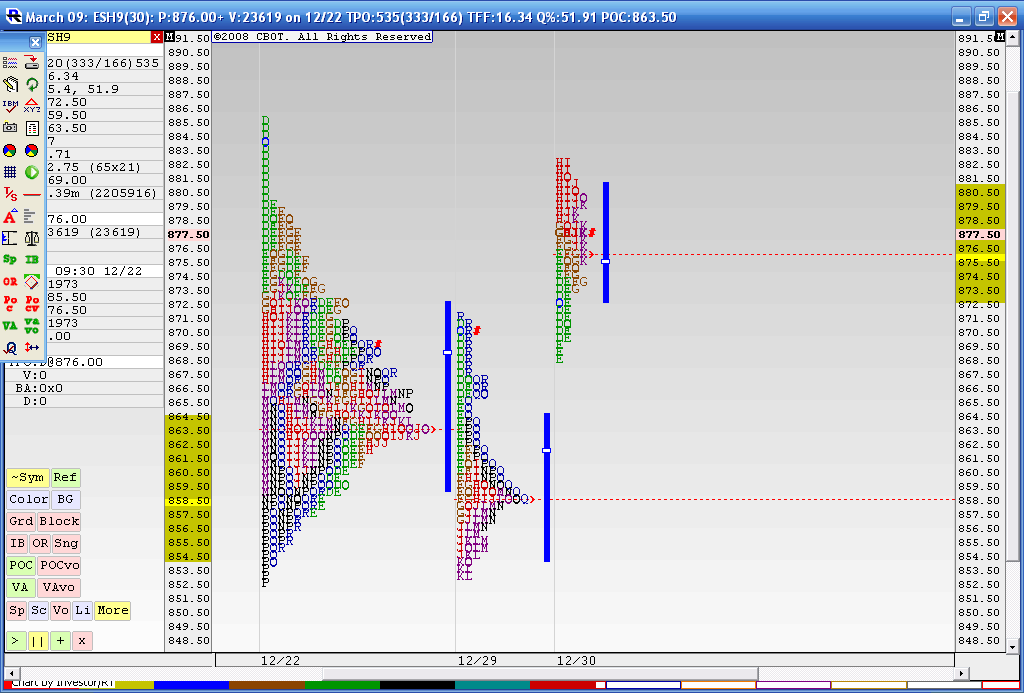
This may be of interest to some:It is the same composite chart posted above with yesterday MP graph and part of today's trading added.
On Tuesday 12-29 we had single prints to the downside that eventually got filled in to the upside during the late day rally. Look at where the selling stopped on Tuesday....at the single prints ( Letter 'P') of the 12/22 composite. It then ran up and blew through the key 59 - 63.50 level and closed above it.
Now today we ran up to test the composites single prints on the upside in (letter 'D' of the 12/22 composite). We now have a whole/gap from yesterday and today's trading in the composite and I think they will need to have an afternoon sell off to round out the composite. We are forming a "p" formation on the current daily MP chart too. An even cleaner 'P' formation will form if they can get it up to 879 now and then sell off.
This will make a nice bell shape curve in a longer term consolidation period. In general the market will attempt to test the other end of a consolidation if no new selling/buyers are found at one extreme.
We don't need MP to see congestions but I thought it was cool to see on the MP graphic. Hope some of this makes sense. I 'm not always so good at explaining my thought.
Here is the chart:
Click image for original size
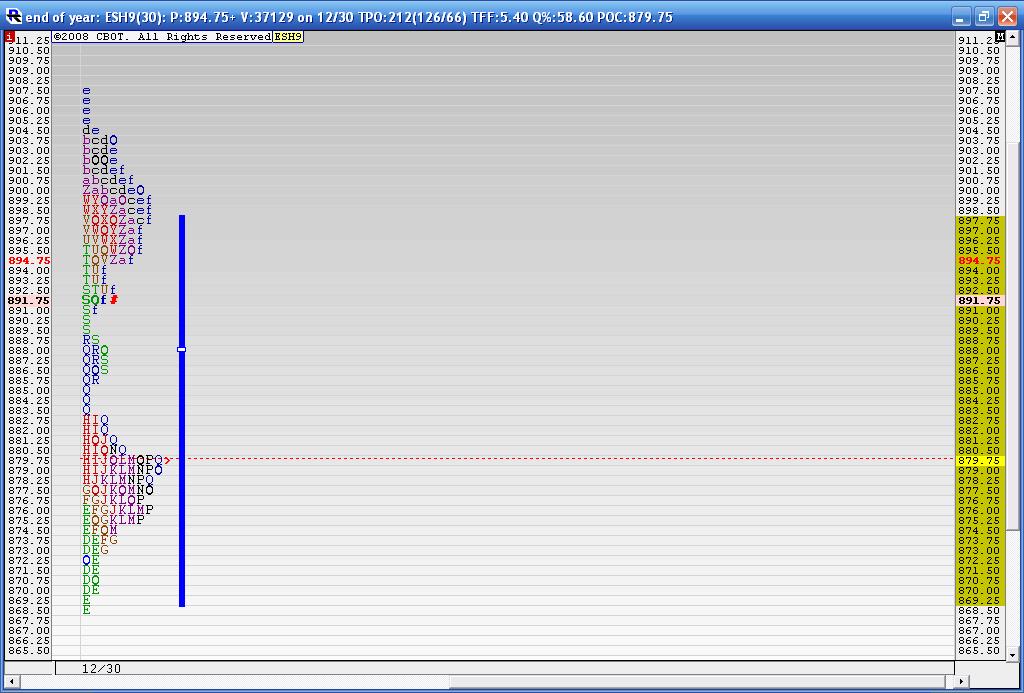
they just cleaned up the 879 area ...notch in the profile...at letter 'k' from today...we do have double TPO's so it is still possible that they run out the high but I still favor congestion up here and then lower..
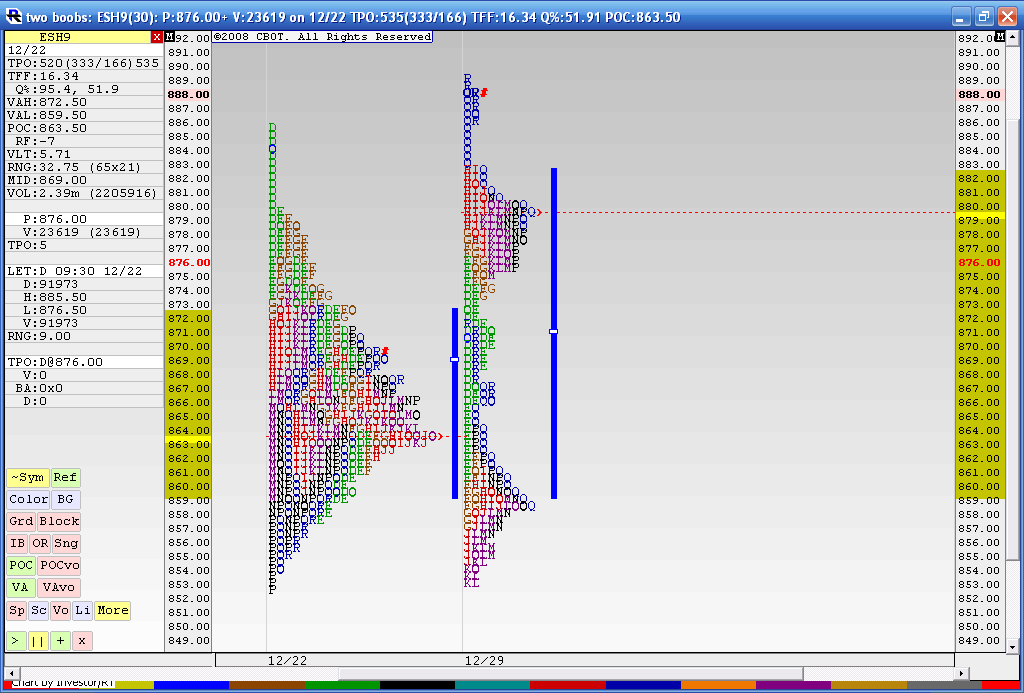
Well we didn't get the late day sell off that I thought might happen..perhaps tomorrow for sellers..On the below chart I combined yesterdays and todays trading into another composite and put it along side the other one. You can clearly see an area that should be filled in fairly soon......that dip in the middle between 879 and 859...I'm not convinced of a breakout from this balance area quite yet.....such low volume in holiday trade....
If I was trading tomorrow I'd be trying shorts to go "fill in " that area...also I'd be watching the 901 - 904 area if they try to push it up that high..
Here is the chart:
If I was trading tomorrow I'd be trying shorts to go "fill in " that area...also I'd be watching the 901 - 904 area if they try to push it up that high..
Here is the chart:
Click image for original size
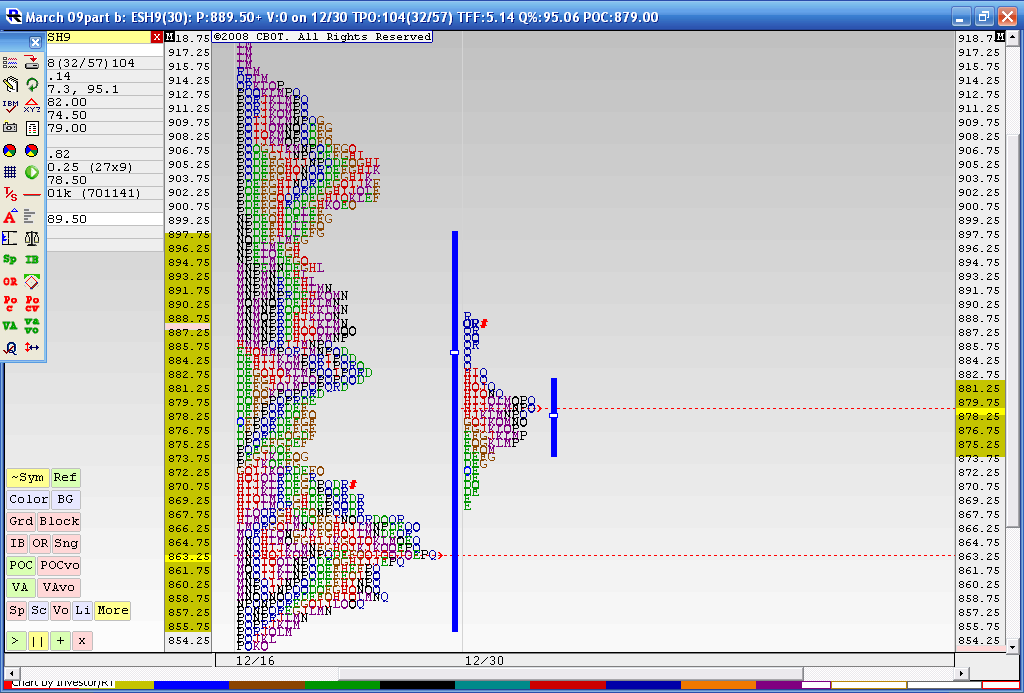
a close up of a longer term profile and the reason I gave 901 - 904 as resistance last night
EDit: typo on numbers
Click image for original size
EDit: typo on numbers
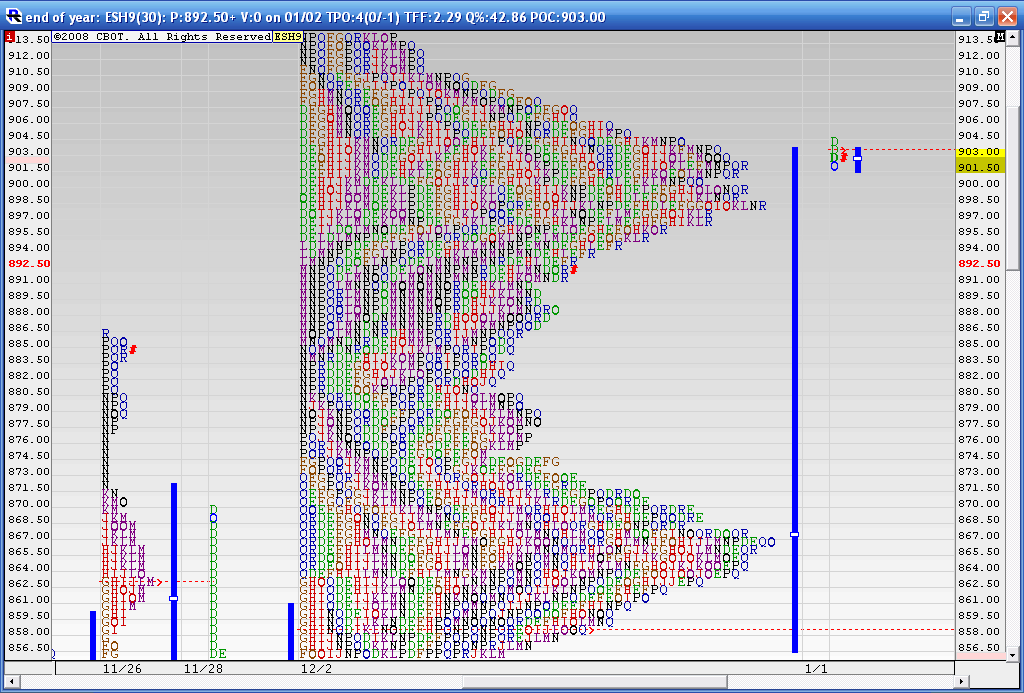
Here is how the last two days of the year look when merged....If we can hold the 907 - 911 area then I think they will try and fill in the low volume area in the 899 - 879 area first as this is a low volume area......some call it the cleavage....!!
A few quick things:
I think these longer term profiles in general are a challenge to fiqure out. Just because I mention on this thread a particular direction doesn't mean I won't trade differently. I mention this so nobody thinks there is a conflict between what is posted here and a trade I may take on the daytrading threads.
IN general I believe it is best to keep it simple so this stuff is a challenge. I have yet to see or hear a vendor/educator that can explain this stuff with any consistency and I may find out that it just can't be done and these longer term views are even more subjective then the day trading profiles. Robin Mesh may be an exception and Alley B from this forum does great work!
To the chart...note the Buldges in the 900 area and the 879 area and then the valley in between...that's what I expect to get filled in
Click image for original size
Here is how all of December looks and why I am looking for shorts up here...we are at the upper end of the monthly Value and we have cleavage below
Click image for original size
I have small positions short from the 910, 013 and 915 area and I am obviously not enjoying this so far but I can't do MOCK experiments as I need real money in the market so I can handle the emotional side of it all. A test account doesn't do it for me.
On the November profile I have low volume areas at 927 and then 937...I don't think I will let this run that far away. This is almost as bad as my current Williams experiment...so far. The only thing I like about this is the low volume but that can be deceptive. They are currently trying to push it out of the December 219 highs..without question the buyers are winning today and that is obvious. Especially looking back but we don't trade from the left side of the chart. Lots of single prints sit below but on a trend day that will happen. There are times when being stubborn serves you well. This isn't one of them.
I have intitial targets down in the 883 - 879 area so the risk to reward is approaching a negative threshold for me. I'll re- evaluate as the bonds close today.
The weekly projects to 924 so the 924 - 927 is a critical part for longer term players as an upper target.
I've been told that longer term players don't watch the small time frame charts and will trade from their perception of value....so I'm thinking that we are at UNfair prices up here......but what do I know..... it sure is unfair to me being in this drawdown trade....
well I usually only go in with three seperate entires if needed but I just added at 25.75......magnets include 917.50,910 and 899....only three options from here and no more add's
Interesting Bruce...
The thing that I was watching was how friday the first day of the year and first day of the month (a critical time in the way I trade i.e. new beggings)Was how the markets broke in there IB away from last months VAH to establsih highier value. This is what I call tetter totter breakout on the monthly MP which generated a long at the 904 area yesterday.
The thing that I was watching was how friday the first day of the year and first day of the month (a critical time in the way I trade i.e. new beggings)Was how the markets broke in there IB away from last months VAH to establsih highier value. This is what I call tetter totter breakout on the monthly MP which generated a long at the 904 area yesterday.
hi Joe and welcome back..I sent you a message yesterday but you had already left the day trading thread. I'm also sending you a PM.
Where are those great setups you posted Joe on the forum where you are watching the Developing off the weekly and monthly? I can't find them in the market profile threads. Perhaps you remember, it would be a shame to lose those as they should dove tail nicely with some of these longer term profiles.
I'm hoping that it wasn't a mistake to mention that I have a position on in this thread. I encourage all comments and I can handle being wrong so don't hold back. I wonder at what point a longer term profile player would abandon this short idea? Especially one with lots of cash....I'm curious!
That's a nice trade you took Joe. My concern with this breakout is that it's on low volume. Friday had less volume than Wednesday.....so I'm skeptical. A long breakout from that point should have had better volume in general but there is no denying the buying profile that fridays trade has formed.
The ideal situation for me will see this close back inside the longer term composite. I have yet to run a composite from November to see what if anything sits above.
We had a break out up on yesterdays high Volume fed announcement.....now we need to see if we can attract Volume above...my feeling is that they will fail on this breakout and we will get daily closes back below 867.....Sure hope I'm wrong for the longer term players like myself....I'll get a chart later
Emini Day Trading /
Daily Notes /
Forecast /
Economic Events /
Search /
Terms and Conditions /
Disclaimer /
Books /
Online Books /
Site Map /
Contact /
Privacy Policy /
Links /
About /
Day Trading Forum /
Investment Calculators /
Pivot Point Calculator /
Market Profile Generator /
Fibonacci Calculator /
Mailing List /
Advertise Here /
Articles /
Financial Terms /
Brokers /
Software /
Holidays /
Stock Split Calendar /
Mortgage Calculator /
Donate
Copyright © 2004-2023, MyPivots. All rights reserved.
Copyright © 2004-2023, MyPivots. All rights reserved.