Merged Profile
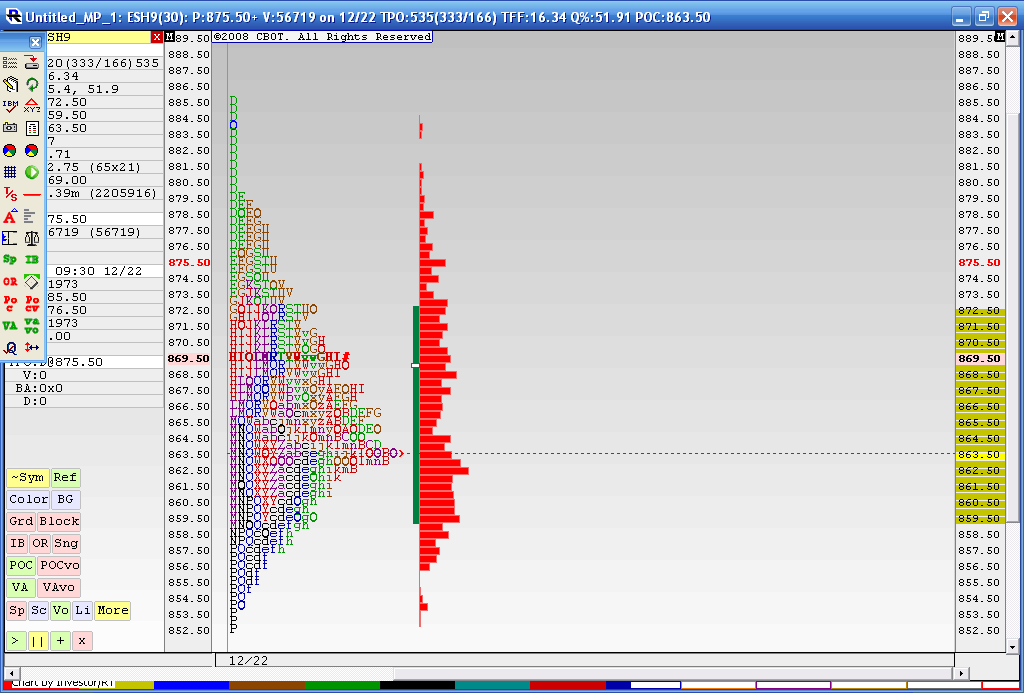
Below is the result from a 4 day merged profile as this is where we most recently have consolidated during holiday trade. The Value area high of this merge is 872.50 and the Value area low is 59.50. You may also notice that the 863.50 price has had the most trade through so far. This chart doesn't include today's trading. I think that 59.50 - 63.50 is the area we need to beat for any upside to take hold as we have the Va low and that Volume node. Current overnight high is 73.50 so it was fairly close to the merged VA high of 72.50.
In today's trading we have single prints created to the downside and through that high volume node. I'm skeptical because of the holidays and low volume but as most know we will trend many times after consolidations. I'm not sure if this counts. Anyway it's been fun firing up the old MP software for a change.
To make a long story longer: That 859.50 - 863.50 is the critical zone to watch.
Click image for original size
"needs to be bought" should read...single prints and dynamic VWAP at 712.50...I'm not straying from MP too far...just trying to make it better..write more when I can...additional bands come in at 18.25 and the current high...near 724.....c'mon...we all know that the projections have been filled...give us longs a break....lol
hey DW this may be interesting...it's the 5 day with the highest Volume nodes marked off.....unfortunately the scaling has thrown off the volume lines , the labels are at the correct volume spike areas........some nice clusters...scaling messes up this visual a bit
Click image for original size
Your opinions are always welcome DW. I agree that the shape of these longer term profiles don't hold much Value at least not from this fairly small experiment. The price buldges and low volume area seem to be most important.I like what the folks from cisco are doing as it simplifies things and it's effective for us short term traders. Do you know if these are volume peaks and valleys that they ( you ) show or are they using tpo's for these charts?
Thanks for the charts........seems like we are overdue for a pop higher...with a minus 1000 or more $tick reading........a statistic that many watch is how often we trade back to the Daily pivot.....we failed for two days in a row now......so tomorrow we should trade through it.......I hope we open lower and trade up to it....we also have the weekly pivot up at 748...so that would be cool...
We also hit the 699 projection that was made from last monday and tuesdays range today.........too bad I couldn't trade for it...just don't know how people can hold on for longer term gains......still alludes me...
Bruce
quote:
Originally posted by dafydd
Bruce,
If I may here are my 2¢ worth on long term distribution profiles. They give tremendously valuable information for the period covered. The only use they are to the day and short term swing trader is when prices are close to key reference areas (KRAs).
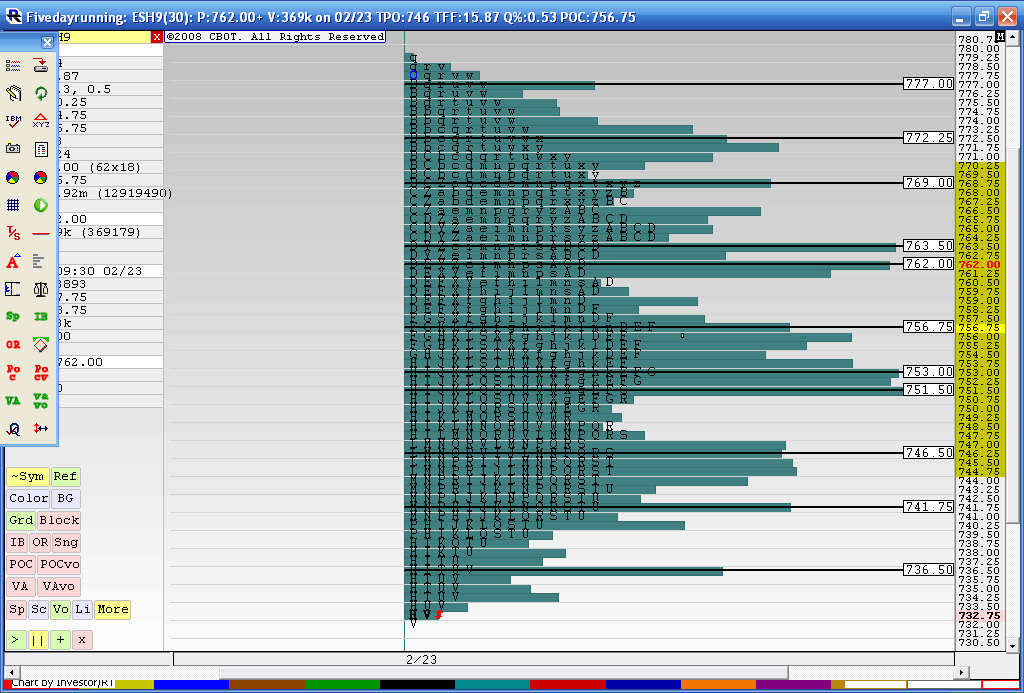
More valuable to these traders I think are the distribution profiles of the last 5, 10 and 20 days. On page 14 of this thread I posted such a chart. In the ensuing days prices obviously could not sustain a break above the 774 - 777 area so prices had no place to go but down. The heavy selling in the final hour on 2/25/08 after an up side range extension underlined the probability that prices were going to go lower.
Back to your long term profile chart, should the market put in an interm low in the Fibonacci projected area of 690 (and it is a big if) the importance of your long term chart will become extremely useful as prices move higher. Then the KRAs you have illustrated - 751, 767, 791, 830, 866 and 891 become extremely important to the short term/day trader. Each KRA will be a potential low risk opportunity to go short, or, to add to positions if prices blow through any of those levels on increased volume. Then prices are very likely to make their way to the next higher KRA.
If the Elliott wave/ Fibonacci trader is correct that 690 +/- is a wave five low then a correction to the wave 4 high is highly probable. Right now that wave 4 high is our KRA @ 897.
I post another 5,10 & 20 day VA overlay chart as guide to this weeks trading. Obviously the VAL low of the past 5 - 20 days @ 734 - 739 is now to be considered as potential resistance to any immediate up side correction.
So Bruce if you go on a vacation and don't contrinute for awhile you have already given us a blue print for a fifth wave correction by posting the very informative long term distribution profile. I for one greatly appreciate that.
Thanks.
Click image for original size
very nice Joe....I'd be curious how often we gap away on the first trading day of the month and never return back to the previous months range....I would imagine it isn't very often so I'm trying to press the long side.....How did you make out with your DOM problem?
Bruce
Bruce
quote:
Originally posted by CharterJoe
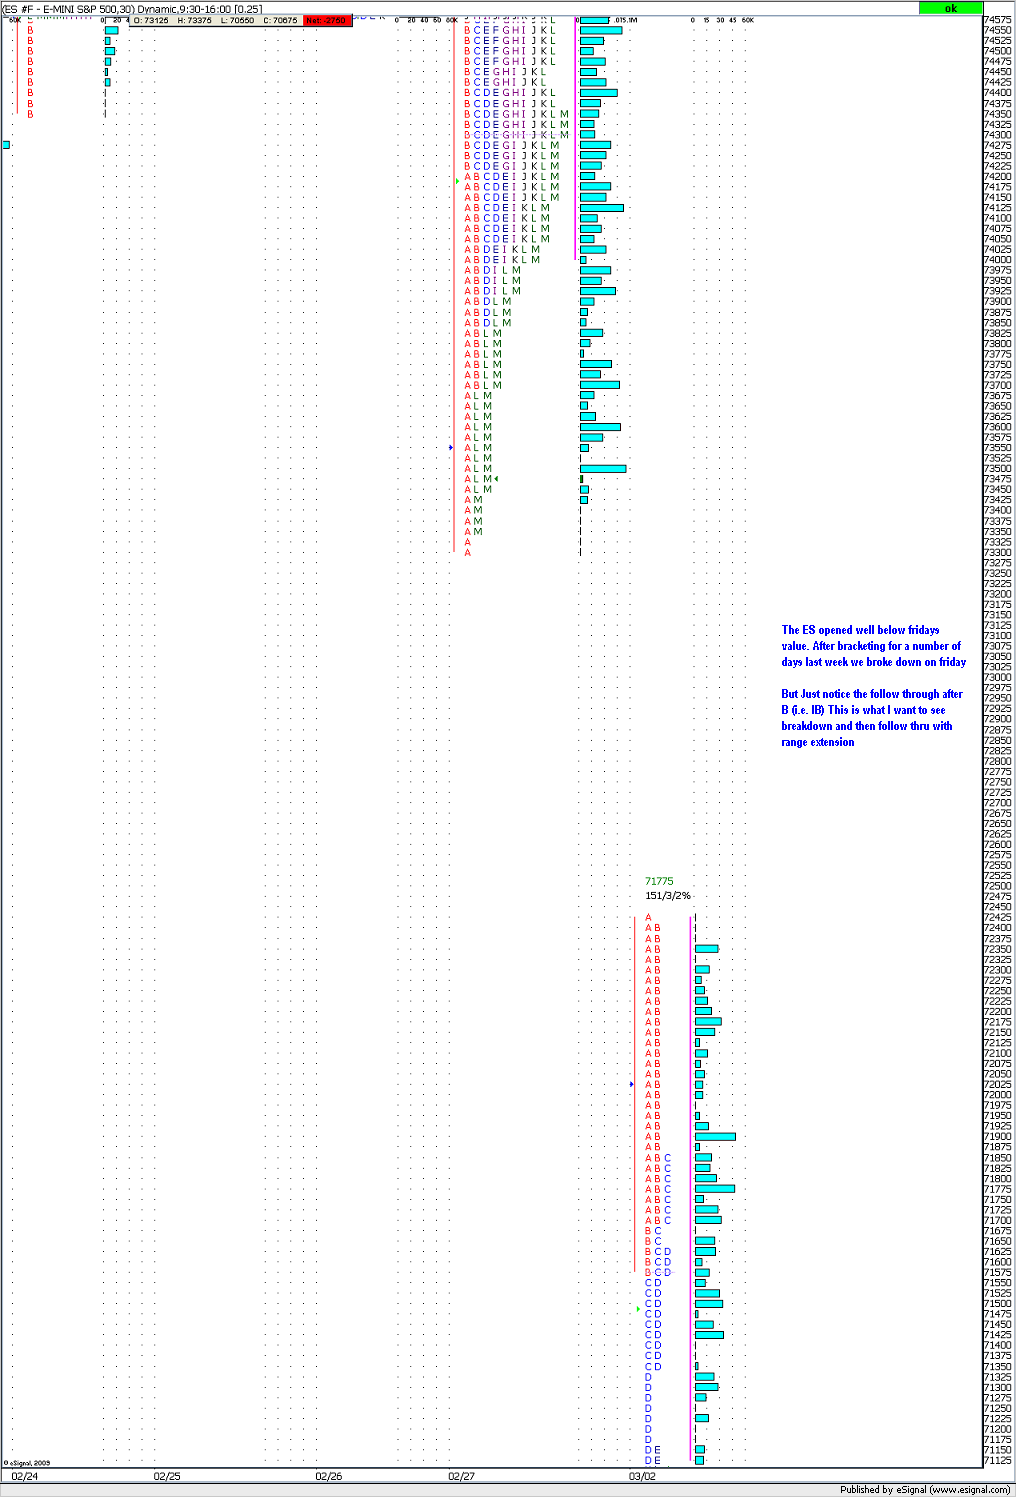
This is NOT a merged profile, But the way I use it deals with the merged profile....Markets made a low lower than last months low, then gapped down away from monthly value then broke out running away from last months VAL.....
Click image for original size
Bruce,
I had to uninstall my platform then reinstall it. Its good now would liked to have joined you on that long though..
I had to uninstall my platform then reinstall it. Its good now would liked to have joined you on that long though..
[quote]Originally posted by BruceM
Your opinions are always welcome DW. I agree that the shape of these longer term profiles don't hold much Value at least not from this fairly small experiment. The price buldges and low volume area seem to be most important.I like what the folks from cisco are doing as it simplifies things and it's effective for us short term traders. Do you know if these are volume peaks and valleys that they ( you ) show or are they using tpo's for these charts?
Bruce
Bruce the Cisco based VA Overlay charts P post are based on (30 minute) TPOs. I don't know where the Fibonacci projected low of 690 comes from so traders be cautious as we approach this level. By my calculation, but I'm no Fibonacci expert, this leg down should continue until we get an interim low in the 652.00 area.
thanks DW..it seems that using TPO's over longer time periods should come close to the volume profile numbers...
I'm getting sidetracked by vwap and it's implications......lots of promise......
I'm getting sidetracked by vwap and it's implications......lots of promise......
quote:
Originally posted by redsixspeed
DW / Bruce
When you cal. your 1/8ths do you use RTH / 24 data?
Thanks
RTH
same here ..just RTH for me...
We had a break out up on yesterdays high Volume fed announcement.....now we need to see if we can attract Volume above...my feeling is that they will fail on this breakout and we will get daily closes back below 867.....Sure hope I'm wrong for the longer term players like myself....I'll get a chart later
Emini Day Trading /
Daily Notes /
Forecast /
Economic Events /
Search /
Terms and Conditions /
Disclaimer /
Books /
Online Books /
Site Map /
Contact /
Privacy Policy /
Links /
About /
Day Trading Forum /
Investment Calculators /
Pivot Point Calculator /
Market Profile Generator /
Fibonacci Calculator /
Mailing List /
Advertise Here /
Articles /
Financial Terms /
Brokers /
Software /
Holidays /
Stock Split Calendar /
Mortgage Calculator /
Donate
Copyright © 2004-2023, MyPivots. All rights reserved.
Copyright © 2004-2023, MyPivots. All rights reserved.