Merged Profile
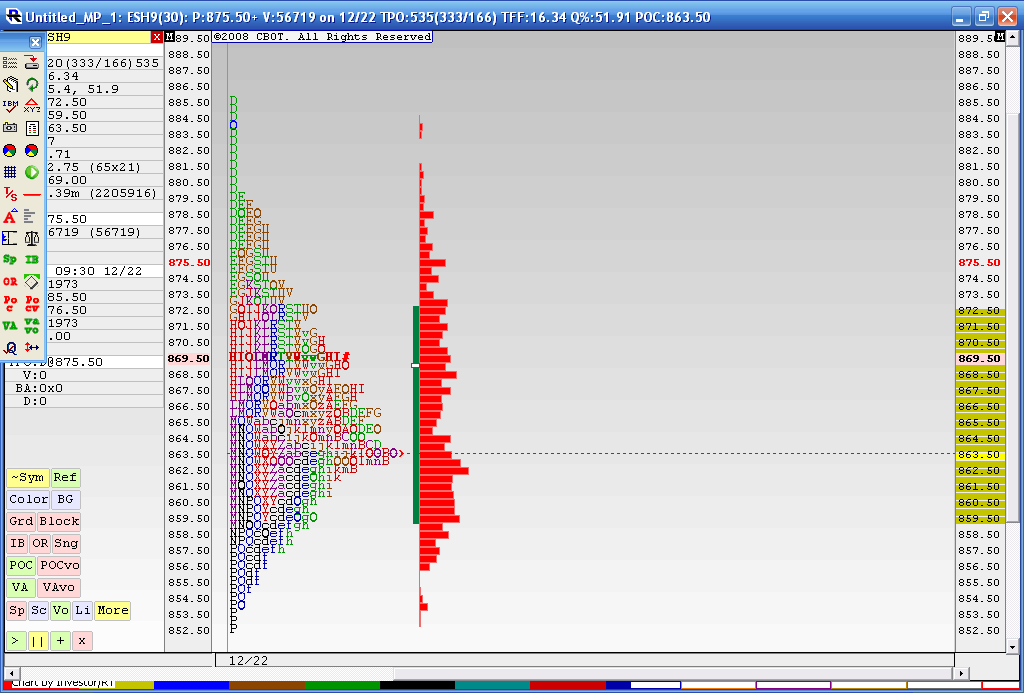
Below is the result from a 4 day merged profile as this is where we most recently have consolidated during holiday trade. The Value area high of this merge is 872.50 and the Value area low is 59.50. You may also notice that the 863.50 price has had the most trade through so far. This chart doesn't include today's trading. I think that 59.50 - 63.50 is the area we need to beat for any upside to take hold as we have the Va low and that Volume node. Current overnight high is 73.50 so it was fairly close to the merged VA high of 72.50.
In today's trading we have single prints created to the downside and through that high volume node. I'm skeptical because of the holidays and low volume but as most know we will trend many times after consolidations. I'm not sure if this counts. Anyway it's been fun firing up the old MP software for a change.
To make a long story longer: That 859.50 - 863.50 is the critical zone to watch.
Click image for original size
joseph000: Is it possible that your chart is calculating the values for the March contract instead of the June contract?
Bruce;
In addition to the 741 you mentioned there is also a so9 @ 743....FWIW
In addition to the 741 you mentioned there is also a so9 @ 743....FWIW
I was thinking the same thing DT. I also know many with Ensign use a VOLUME profile which will give different numbers. T
quote:
Originally posted by day trading
joseph000: Is it possible that your chart is calculating the values for the March contract instead of the June contract?
day trading,
Thanks for the reply.
Yes, I am on the June contract. It is a valid question in that I have my Ensign price histogram set for formula:volume and the study mode I choose is 2-days. Not knowing your time frame/settings I have been probably lucky that most of my numbers have been in-line with your recent levels (until today, Friday the 13th).
I can't complain too much as the POC that I had for today started at 744.75 and the VAH was 749.75. Both levels provided some good s/r action throughout the day.
day trading, can you tell me what time frame or study period that your daily levels are based? This would save me from experimenting each morning with my Ensign settings to replicate your levels.
Thanks in advance.
Joseph.....
do the virgin points of control have more weight as support resistance levels for emini S&P?
joseph000: The Market Profile value areas are for the RTH from the previous day. So for something like the ES that would be from 9:30 to 16:00 ET.
I think that Bruce hit the nail on the head by pointing out that your chart calculates the areas using volume while these numbers are calculated based on time - i.e. every 30 minutes.
I think that Bruce hit the nail on the head by pointing out that your chart calculates the areas using volume while these numbers are calculated based on time - i.e. every 30 minutes.
quote:
Originally posted by gus
do the virgin points of control have more weight as support resistance levels for emini S&P?
I don't know of anybody that's ever done a study comparing the two. My gut feel is that there's no difference.
I treat all new s/r including vpoc as strong untill it has been tested. As Charter Joe posted
awhile back any square of 9 that has not been tested for sometime is also strong. See yesterday
@ 757.00 + 1.50 = 758.50 we turned @ 758.25,as always I confirm any area before entry/exit.
awhile back any square of 9 that has not been tested for sometime is also strong. See yesterday
@ 757.00 + 1.50 = 758.50 we turned @ 758.25,as always I confirm any area before entry/exit.
I should add 758.25 came in the overnite session
redsixspeed.could you elaborate your square of 9 concept.i'm a new user of the site and market profile.don't mean to be a pest,just trying to learn from the pros.tnx all for your answers to my post re vpc's.gus
We had a break out up on yesterdays high Volume fed announcement.....now we need to see if we can attract Volume above...my feeling is that they will fail on this breakout and we will get daily closes back below 867.....Sure hope I'm wrong for the longer term players like myself....I'll get a chart later
Emini Day Trading /
Daily Notes /
Forecast /
Economic Events /
Search /
Terms and Conditions /
Disclaimer /
Books /
Online Books /
Site Map /
Contact /
Privacy Policy /
Links /
About /
Day Trading Forum /
Investment Calculators /
Pivot Point Calculator /
Market Profile Generator /
Fibonacci Calculator /
Mailing List /
Advertise Here /
Articles /
Financial Terms /
Brokers /
Software /
Holidays /
Stock Split Calendar /
Mortgage Calculator /
Donate
Copyright © 2004-2023, MyPivots. All rights reserved.
Copyright © 2004-2023, MyPivots. All rights reserved.