Merged Profile
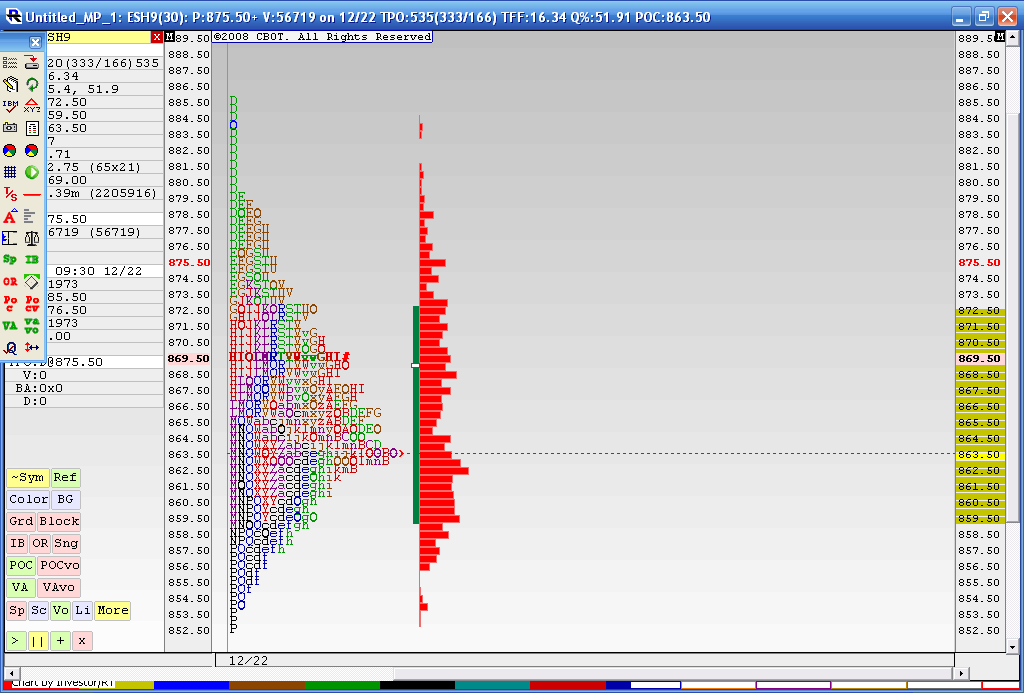
Below is the result from a 4 day merged profile as this is where we most recently have consolidated during holiday trade. The Value area high of this merge is 872.50 and the Value area low is 59.50. You may also notice that the 863.50 price has had the most trade through so far. This chart doesn't include today's trading. I think that 59.50 - 63.50 is the area we need to beat for any upside to take hold as we have the Va low and that Volume node. Current overnight high is 73.50 so it was fairly close to the merged VA high of 72.50.
In today's trading we have single prints created to the downside and through that high volume node. I'm skeptical because of the holidays and low volume but as most know we will trend many times after consolidations. I'm not sure if this counts. Anyway it's been fun firing up the old MP software for a change.
To make a long story longer: That 859.50 - 863.50 is the critical zone to watch.
Click image for original size
W.D. Gann is the one folks study for square of 9. In this forum Charter Joe is
the best to ask about it.
the best to ask about it.
quote:
Originally posted by day trading
joseph000: The Market Profile value areas are for the RTH from the previous day. So for something like the ES that would be from 9:30 to 16:00 ET.
I think that Bruce hit the nail on the head by pointing out that your chart calculates the areas using volume while these numbers are calculated based on time - i.e. every 30 minutes.
thanks for the info day trading!
overnight essentially filled the weekly projection..I'm expecting the high to be put in first and some selling today
they fooled me and where able to push it over the 68.75 target..so I'm, trying from the 70 area now......
Bruce:I was`watching the 772.50 area you mentioned the other day as it came up on my projection today
double tpo's on the highs can't be a good thing for this short...766 is critical to overtake on short side for any selloff to win today
fantatsic YM divergence at those highs but now Triple TPO's are a big concern at the highs in ES...anyone have stats on those?
my 15min. is indicating short as we have moved under the 50% fibo fan @ the 66.00 area. Time
will tell
will tell
quote:
Originally posted by BruceM
double tpo's on the highs can't be a good thing for this short...766 is critical to overtake on short side for any selloff to win today
GREAT CALL @ the 66.00 area
well they went high to low but that was a tough one......those tiples at the highs into the plus 8- 10 number........many days you will see symetric moves off the amount of points above and below the open print instead of looking for an equal move above and below the first hours range...seems like thsy'll want 738 soon....tomorrow?
We had a break out up on yesterdays high Volume fed announcement.....now we need to see if we can attract Volume above...my feeling is that they will fail on this breakout and we will get daily closes back below 867.....Sure hope I'm wrong for the longer term players like myself....I'll get a chart later
Emini Day Trading /
Daily Notes /
Forecast /
Economic Events /
Search /
Terms and Conditions /
Disclaimer /
Books /
Online Books /
Site Map /
Contact /
Privacy Policy /
Links /
About /
Day Trading Forum /
Investment Calculators /
Pivot Point Calculator /
Market Profile Generator /
Fibonacci Calculator /
Mailing List /
Advertise Here /
Articles /
Financial Terms /
Brokers /
Software /
Holidays /
Stock Split Calendar /
Mortgage Calculator /
Donate
Copyright © 2004-2023, MyPivots. All rights reserved.
Copyright © 2004-2023, MyPivots. All rights reserved.