Merged Profile
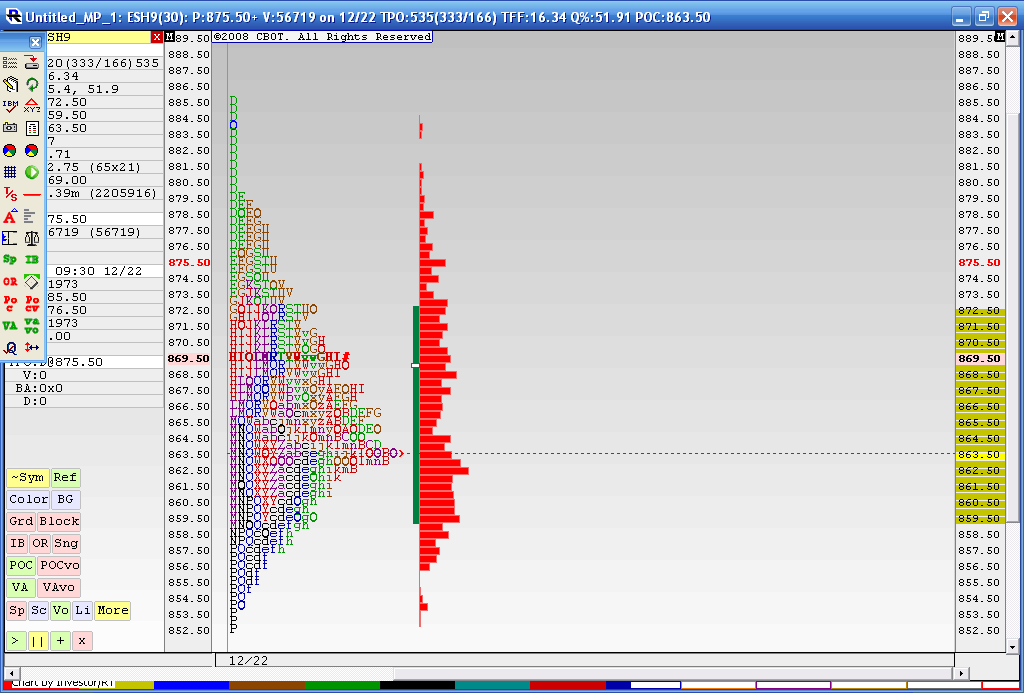
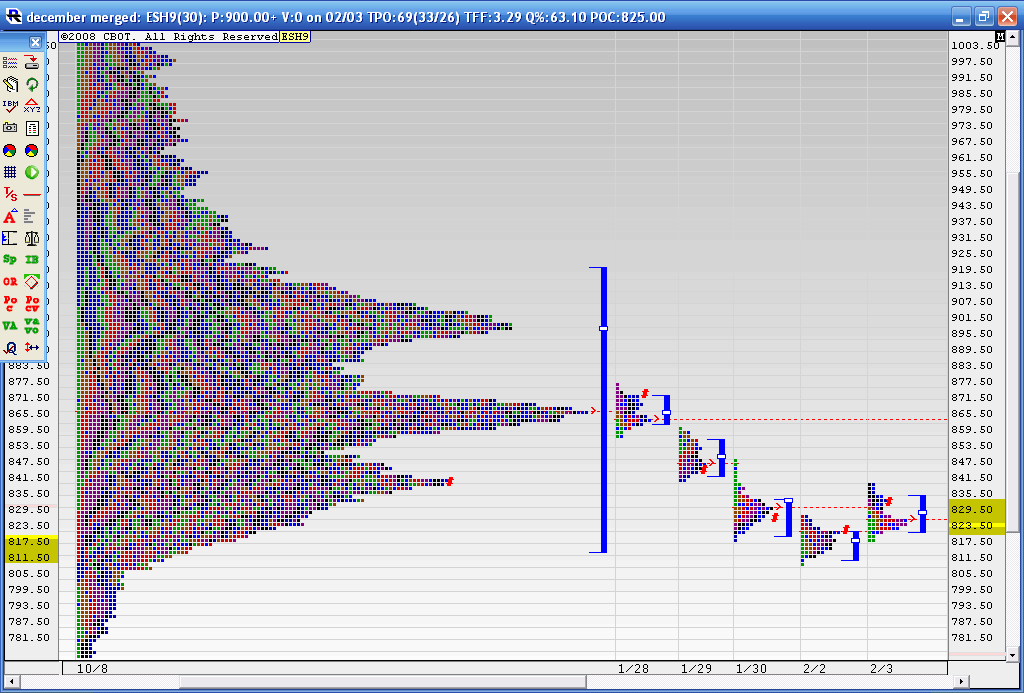
Below is the result from a 4 day merged profile as this is where we most recently have consolidated during holiday trade. The Value area high of this merge is 872.50 and the Value area low is 59.50. You may also notice that the 863.50 price has had the most trade through so far. This chart doesn't include today's trading. I think that 59.50 - 63.50 is the area we need to beat for any upside to take hold as we have the Va low and that Volume node. Current overnight high is 73.50 so it was fairly close to the merged VA high of 72.50.
In today's trading we have single prints created to the downside and through that high volume node. I'm skeptical because of the holidays and low volume but as most know we will trend many times after consolidations. I'm not sure if this counts. Anyway it's been fun firing up the old MP software for a change.
To make a long story longer: That 859.50 - 863.50 is the critical zone to watch.
Click image for original size
I'm putting this here for my own reference to follow up on later.....
Limit points on 3,5 and 10 day overlays must have at least 3 tpo's.......5 tpo's set limits on longer ones
Limits are significant because a move outside a limit Should change a bracketing market to a trending market....In theory...
Limit points on 3,5 and 10 day overlays must have at least 3 tpo's.......5 tpo's set limits on longer ones
Limits are significant because a move outside a limit Should change a bracketing market to a trending market....In theory...
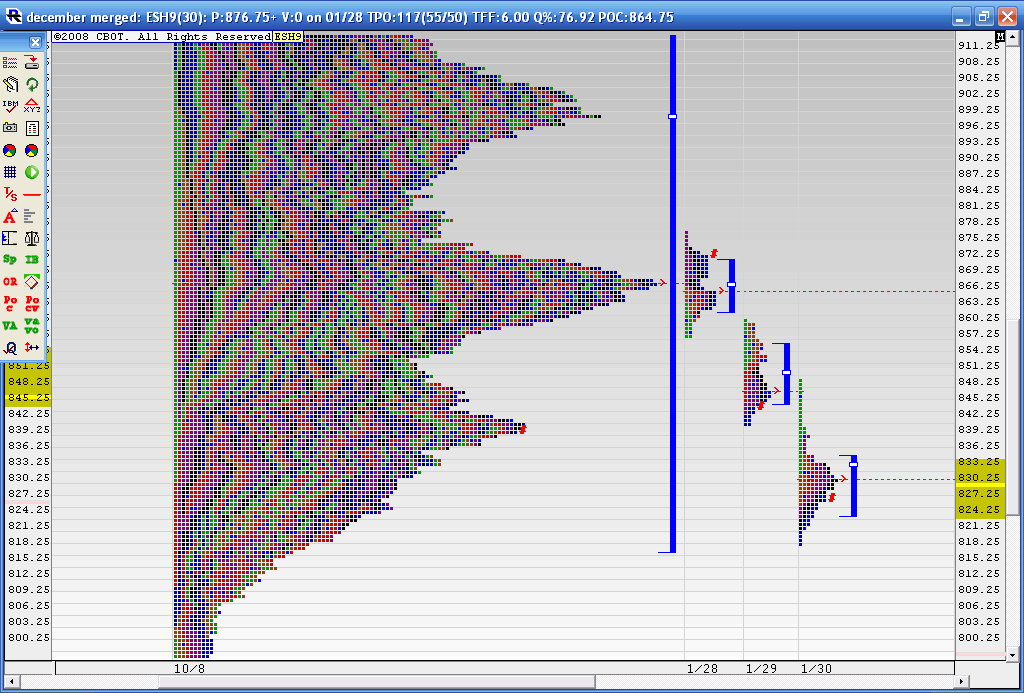
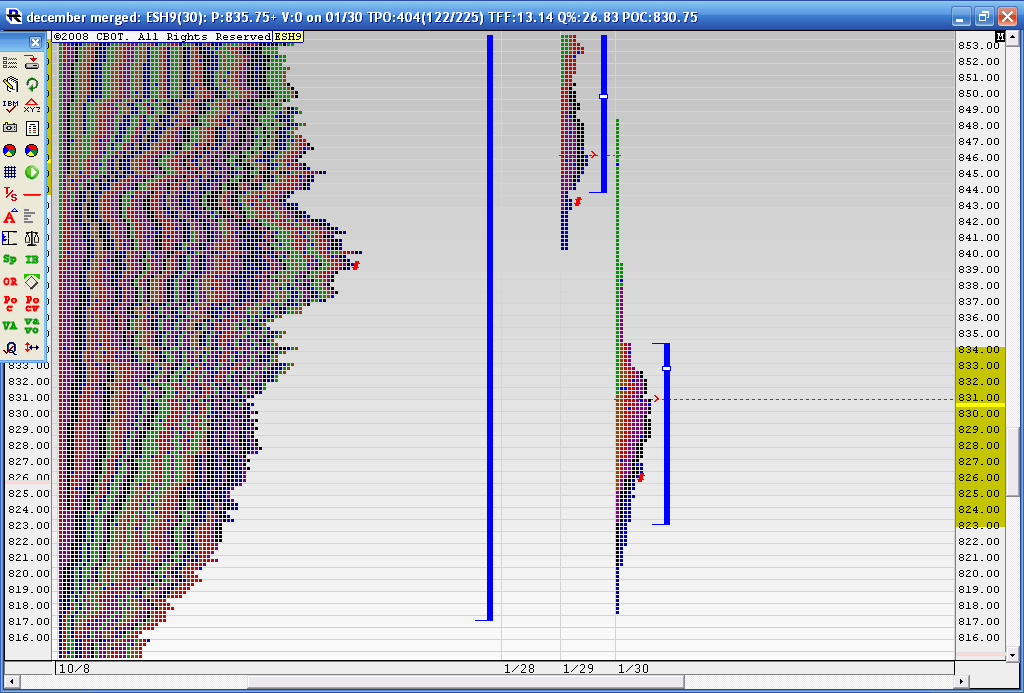
two quick charts...they both show the longer term profile ...first is how the last three days has unfolded against it....second is a closeup of todays trading and how it attempted to break below the Value area of the longer term composite...
here is the close up.........
Click image for original size
here is the close up.........
Click image for original size
thanks bruce,if you change that chart to a 1 point increment ,you can see a ledge at 832 ,u can kind of see it on your upper chart,when i see these i assume that the big money is holding the market there,since the majority of this profile is under the 32 ,i assume there was an effort to keep it down,assuming accumulation or unloading shorts,when i see these intraday ,they are usually taken out in the last 90 minutes of the day,when they arent ,i look for this to happen soon,doesnt always work ,but more often than not
KUDOS,Bruce! I know you refrain from making calls, but your long held assumption that the market needed to 'fill' in that 866 area turned out to be spot on! Well done! Now i wonder if they'll run those singles at the 840 area and try to fill that little valley around 843? Or perhaps even the bigger valley around 852?
In a rush tonight...looks like last week formed an incomplet 'b' profile.......here is what it looks like.....
20 - 23 will be key
as will 35 and that 41...if we can consolidate a bit then maybe we can run higher this week
20 - 23 will be key
as will 35 and that 41...if we can consolidate a bit then maybe we can run higher this week
Click image for original size
Thanks IOwa...I have to scale these longer term profiles to fit on the screen so I can't show it all...I usually have it set to .25 to pick up everything....Ledges are cool to watch and many times they'll do the "peek-a boo" to see if any new business wants to happen above/below the ledge..thanks for the insight....today I'll be wathcing the open print carefully as we are set to open below all the key levels off the five day.........I would not be surprised to see a trade back into weekly value from last week...so I have my LONG glasses on
quote:
Originally posted by iowa
thanks bruce,if you change that chart to a 1 point increment ,you can see a ledge at 832 ,u can kind of see it on your upper chart,when i see these i assume that the big money is holding the market there,since the majority of this profile is under the 32 ,i assume there was an effort to keep it down,assuming accumulation or unloading shorts,when i see these intraday ,they are usually taken out in the last 90 minutes of the day,when they arent ,i look for this to happen soon,doesnt always work ,but more often than not
Here is how we are looking against the longer term profile and the last 5 days of data.......
Now this next chart shows how the longer term profile is changing as I merge in the last 5 days... the 840 area seems to be growing a bit as it should...(hARDER TO SEE DUE TO SCALING) ....we had that area as an upper target off the 5 day composite
Click image for original size
Now this next chart shows how the longer term profile is changing as I merge in the last 5 days... the 840 area seems to be growing a bit as it should...(hARDER TO SEE DUE TO SCALING) ....we had that area as an upper target off the 5 day composite
Click image for original size

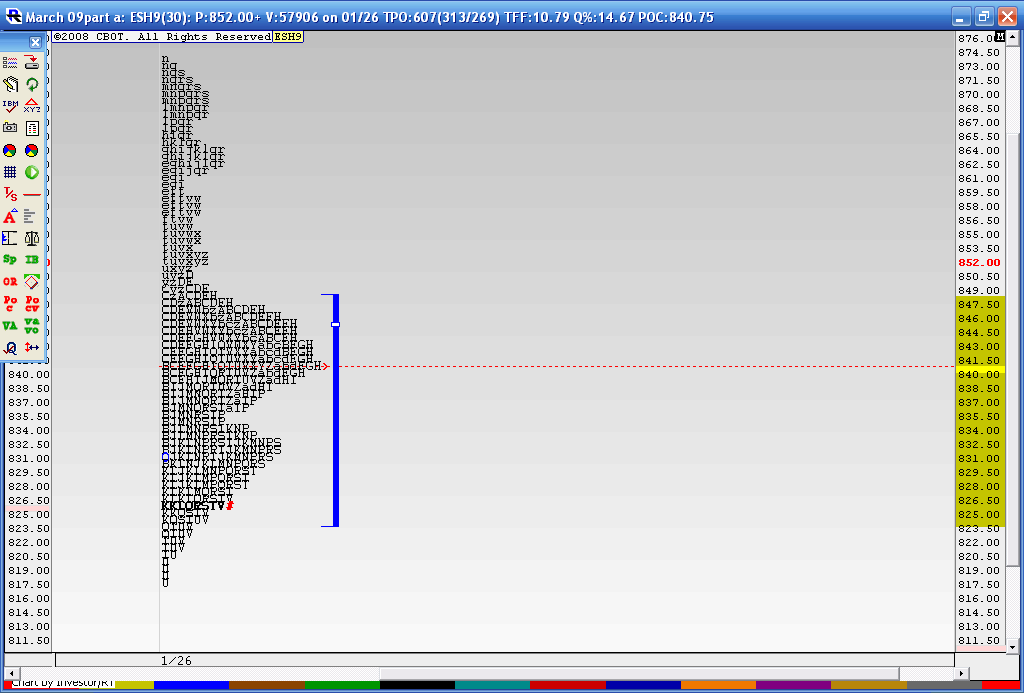
Because we have had three days of overlapping value, I have merged these days together......I feel this graphic will hold the key to tomorrows trading.( if not the entire week from here on)..this is the classic bell curve.....This is how I'd like that giant profile to look like before any meaningful rally or decline unfolds...and this is why I would favor buying into declines IF I was actually trading a longer term move
Signs of a mature profile on any time frame will be a nice symetric distribution with the Value area falling at about the center of the entire profile. The high volume node should fall near the center too....
We have some nice buying and selling tails at the highs and lows...here it is and I hope some of these levels work out for you folks. The TPO count gives a slight edge to the buyers so that is my prefered direction to trade
Click image for original size
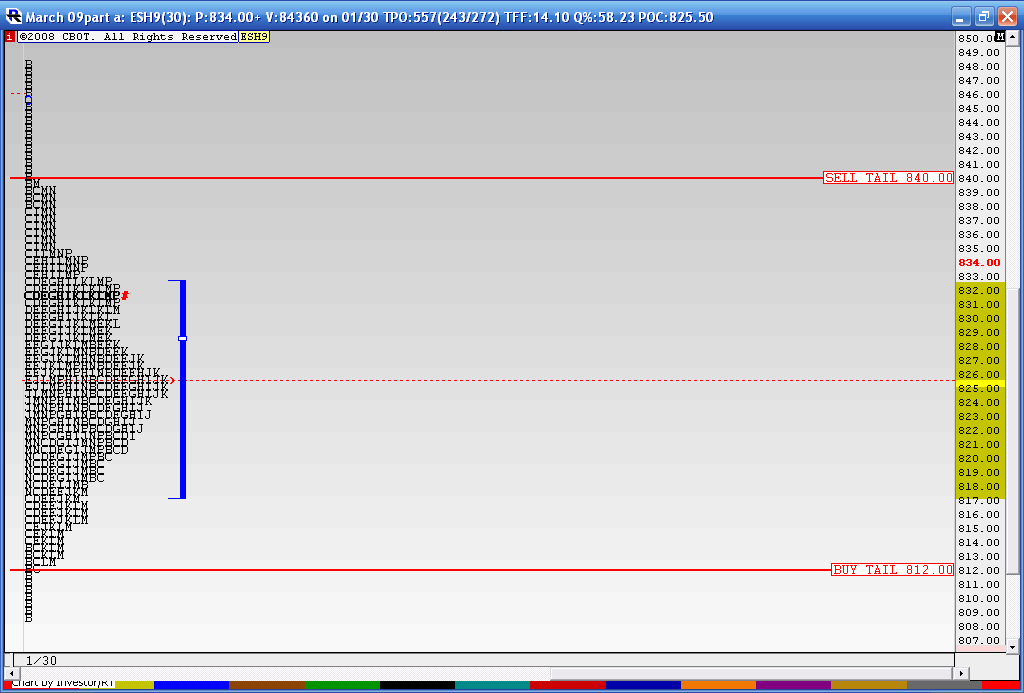
bruce thanks for continuing to share...is the high volume node the bold letters with the # sign?
No VO, the longest line of letters with red dash running across.(KKK zone) is the high volume as prices traded there the most....the # sign is todays close
We had a break out up on yesterdays high Volume fed announcement.....now we need to see if we can attract Volume above...my feeling is that they will fail on this breakout and we will get daily closes back below 867.....Sure hope I'm wrong for the longer term players like myself....I'll get a chart later
Emini Day Trading /
Daily Notes /
Forecast /
Economic Events /
Search /
Terms and Conditions /
Disclaimer /
Books /
Online Books /
Site Map /
Contact /
Privacy Policy /
Links /
About /
Day Trading Forum /
Investment Calculators /
Pivot Point Calculator /
Market Profile Generator /
Fibonacci Calculator /
Mailing List /
Advertise Here /
Articles /
Financial Terms /
Brokers /
Software /
Holidays /
Stock Split Calendar /
Mortgage Calculator /
Donate
Copyright © 2004-2023, MyPivots. All rights reserved.
Copyright © 2004-2023, MyPivots. All rights reserved.