MyPivots
Sign In
JA
jarek
Rep: 94
Posts: 3,474
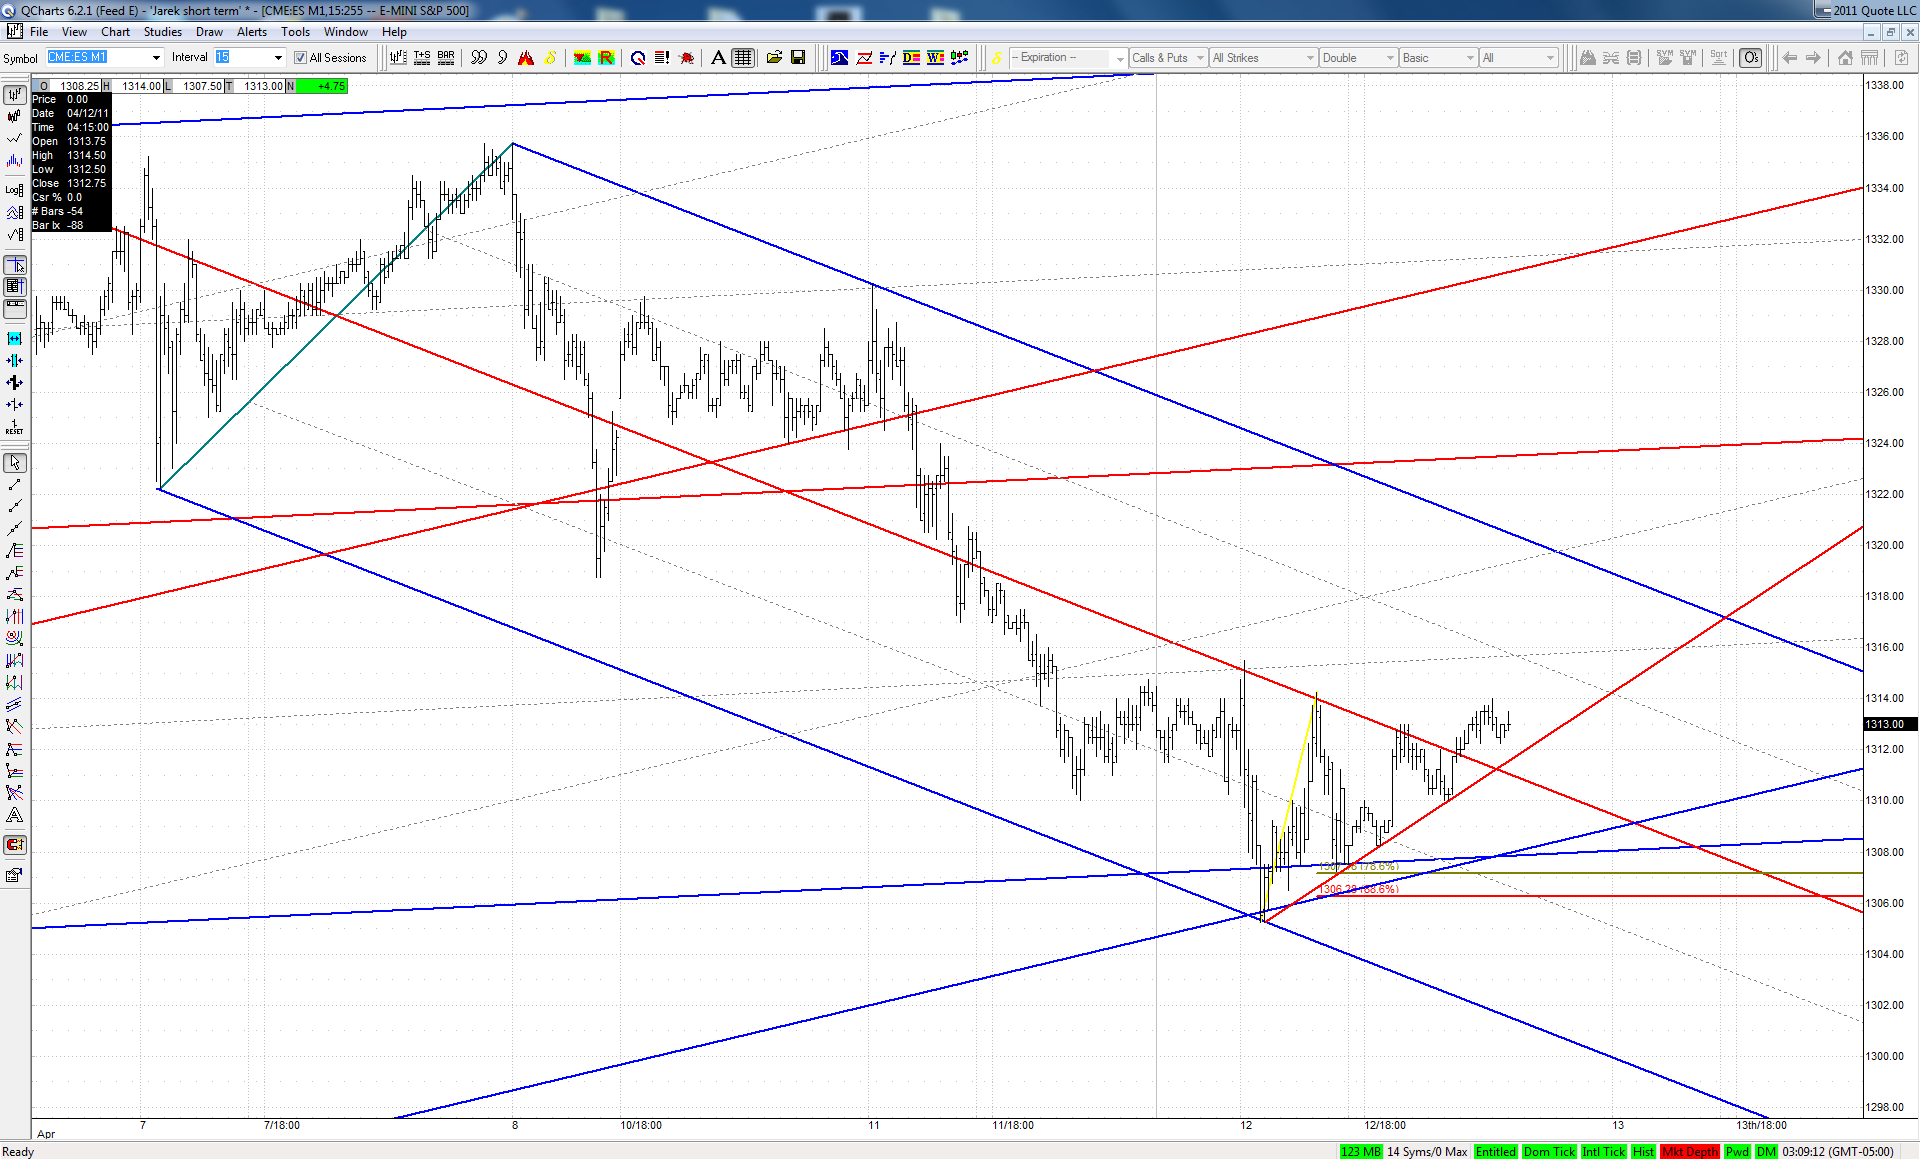
I'm wondering about possible scenarios for a full playout of this test and retest at SPX showed here on Friday:

Click image for original size


... and the only reason for a quick drop from here to the lower ML could in my opinion be a failed 5th wave at SPX and ES. Because on many other indexes the recent rise looks like already completed 5th wave:

Click image for original size
RA
rat89
Rep: 0
Posts: 7,015
great post jim, really helpful stuff. there's another odd variation of the absolutist trap from my experience. my background was in film editing, sound editing for films and designing and renovating apartments. what they all have in common is that you are presented with some sort of mess, and you use your creativity to solve problems and your will to shape the mess into something good.

in trading this is very dangerous, and leads to sitting in a bad trade by hanging in there, and a failure to just see what is there and know you have no control over it. for all these personality types, letting go and accepting that you have no control over events is the single hardest thing to do.

Originally posted by jimkane

Probability is a strange thing, especially for most people, who are trained to think in absolutes. I find that engineers, doctors, and especially non-probability mathematicians have the most trouble with trading and concepts of probability.

TX
tx_ches
Rep: -10
Posts: 514
The named patterns usually are trying to call the end of a trend which is something Kane trading doesn't do in normal circumstances. You'd need a HTF to say that was o.k. I wonder if you could find any upsloping sets on a HTF?

The weekly still looks like a gently upsloping trend line. And one bear TL has already been broken which is good for buyers.

It looks like named pattern traders can find 2 reasons to be happy:
Using one set of pivots you have the butterfly:
XA .786 = B.
XA 1.27 to 1.618 = D
AB .382 to .886 = C
1.618 to 2.168 BC = D

Using another set of pivots, you have the deep crab:
XA .886 = B.
XA 1.618 = D (but using 1.46 might be o.k. since it was not known at time)
AB .382 to .886 = C
2.618 to 3.168 BC = D

I didn't do the measurements for the deep crab just using yours. When I did the butterfly measurements, I remember they seemed to line up pretty good. Jim says the named patterns must have fairly good matches on the fib numbers.

So what will get the named pattern traders into the trade? And if it fails where will their stops be so that you can enter while they are getting out? The butterfly traders may have gotten in today and been burned with the lower low.

Maybe you could find sets that intersect and show you the "time" for the trade.

The daily looks like it has a gap space being approached that might offer some kind of reaction.

Exciting to watch develop.

Originally posted by rat89

Ok....here's a question....it seems that there are a couple of ways to look at what's happening with x here. The first chart, seems to have pretty much set up in a butterfly, as tx ches pointed out last night. from the 52.11 start point, the b at 53.17 is around the .786 and the d at 1.27 would give you 50.64, with an overrun today..

the 2nd chart uses the x point (ha ha) at 52.79, which puts the b point at .886 and the d at an overrun of 1.46 at 50.60
JI
jimkane
Rep: 3,058
Posts: 33,089
Good questions and ponderings on X there. Let me see if I can add something without making this a long post. In general, one of the things I strictly avoid in this methodology is ever trying to figure out what something is going to do. I just look at a chart, and see if one of my predefined layouts is coming together. If so, I look to set up a trade premise. If not, right on to the next chart. It's about seeing the setups jump out at me, not in figuring out what something is doing when it isn't nearing a setup layout.

That being said, I do speak a lot of scenarios. But, understand, that is not about prediction, it is about looking over possible things that may be unfolding because a setup has been hit and is in the process of playing out. I then see how it behaves, to determine, as best as I can, when it is deviating from that playing out scenario.

If it gets technically out of the realm of playing out, say on the way to reaching an expected area, then I realize I have no way to technically manage the play, or look for additional plays. If a potential trade area is in the path of current movement, I may suspect it is acting like a magnet, and I may look to find lower timeframe plays as that area is approached. That's why I do scenarios. Never to try to figure out what something may be doing.

Now, that being said, what do I do when I look at X? I look for a trend, one that, technically, looks like it may have more to go, and then I see if there is an ABCD correction setting up. If not, on to the next play. If so, I do the work and pinpoint the area. In X, it is tough to see a higher timeframe trend. It's really, at best, grinding up. That's frequently not a strong enough upward pressure for a good trend trade. This drift is likely caused by the pattern of huge up, and then a crush. In my experience this leads to a lot of sideways chop for a long time, usually with an upward drift. Look at today, as far as a big crush, then sideways drift with upside bias.

Now, it is possible that this is in a CD leg of an ABCD? I don't like it because I don't like shallow C points, and this one would be a .447. .447's are not usually associated with ABCD's, they are usually part of trend continuations. Given that, there is a massive line confluence with known frequency coming together at a weekly TL, and that is something I'll be looking at. The key area is around 45.50-46.00 (rounded), with a subharmonic (meaning another grouping from the ABCD calculation) around 47.00- 47.30 (rounded). It also depends on when it hits, because the lines are sloping.

So, will it go there? I have no idea. I'm just saying, if it gets there, I may be interested. It is quite a convergence. That's the primary thing I see in X. But, with this putting in a lower high on the weekly compared to that April '10 high, this is not the most bullish chart I've seen, and if that potential support doesn't hold this may get crushed down, perhaps into a big monthly ABCD (the 1.000 is at 30). Just some thoughts.
JI
jimkane
Rep: 3,058
Posts: 33,089
Hey, speaking of roofer going to 'radio silence', where's Eric been? He hasn't posted for awhile, either. The forum is a diminshed place with those two gone...
JA
jarek
Rep: 94
Posts: 3,474
Originally posted by jimkane

...Let me see if I can add something without making this a long post...

Looks like you couldn't
JA
jarek
Rep: 94
Posts: 3,474
Originally posted by jimkane

Hey, speaking of roofer going to 'radio silence', where's Eric been? He hasn't posted for awhile, either. The forum is a diminshed place with those two gone...


Don't worry - they will sure return when the time is right
JA
jarek
Rep: 94
Posts: 3,474
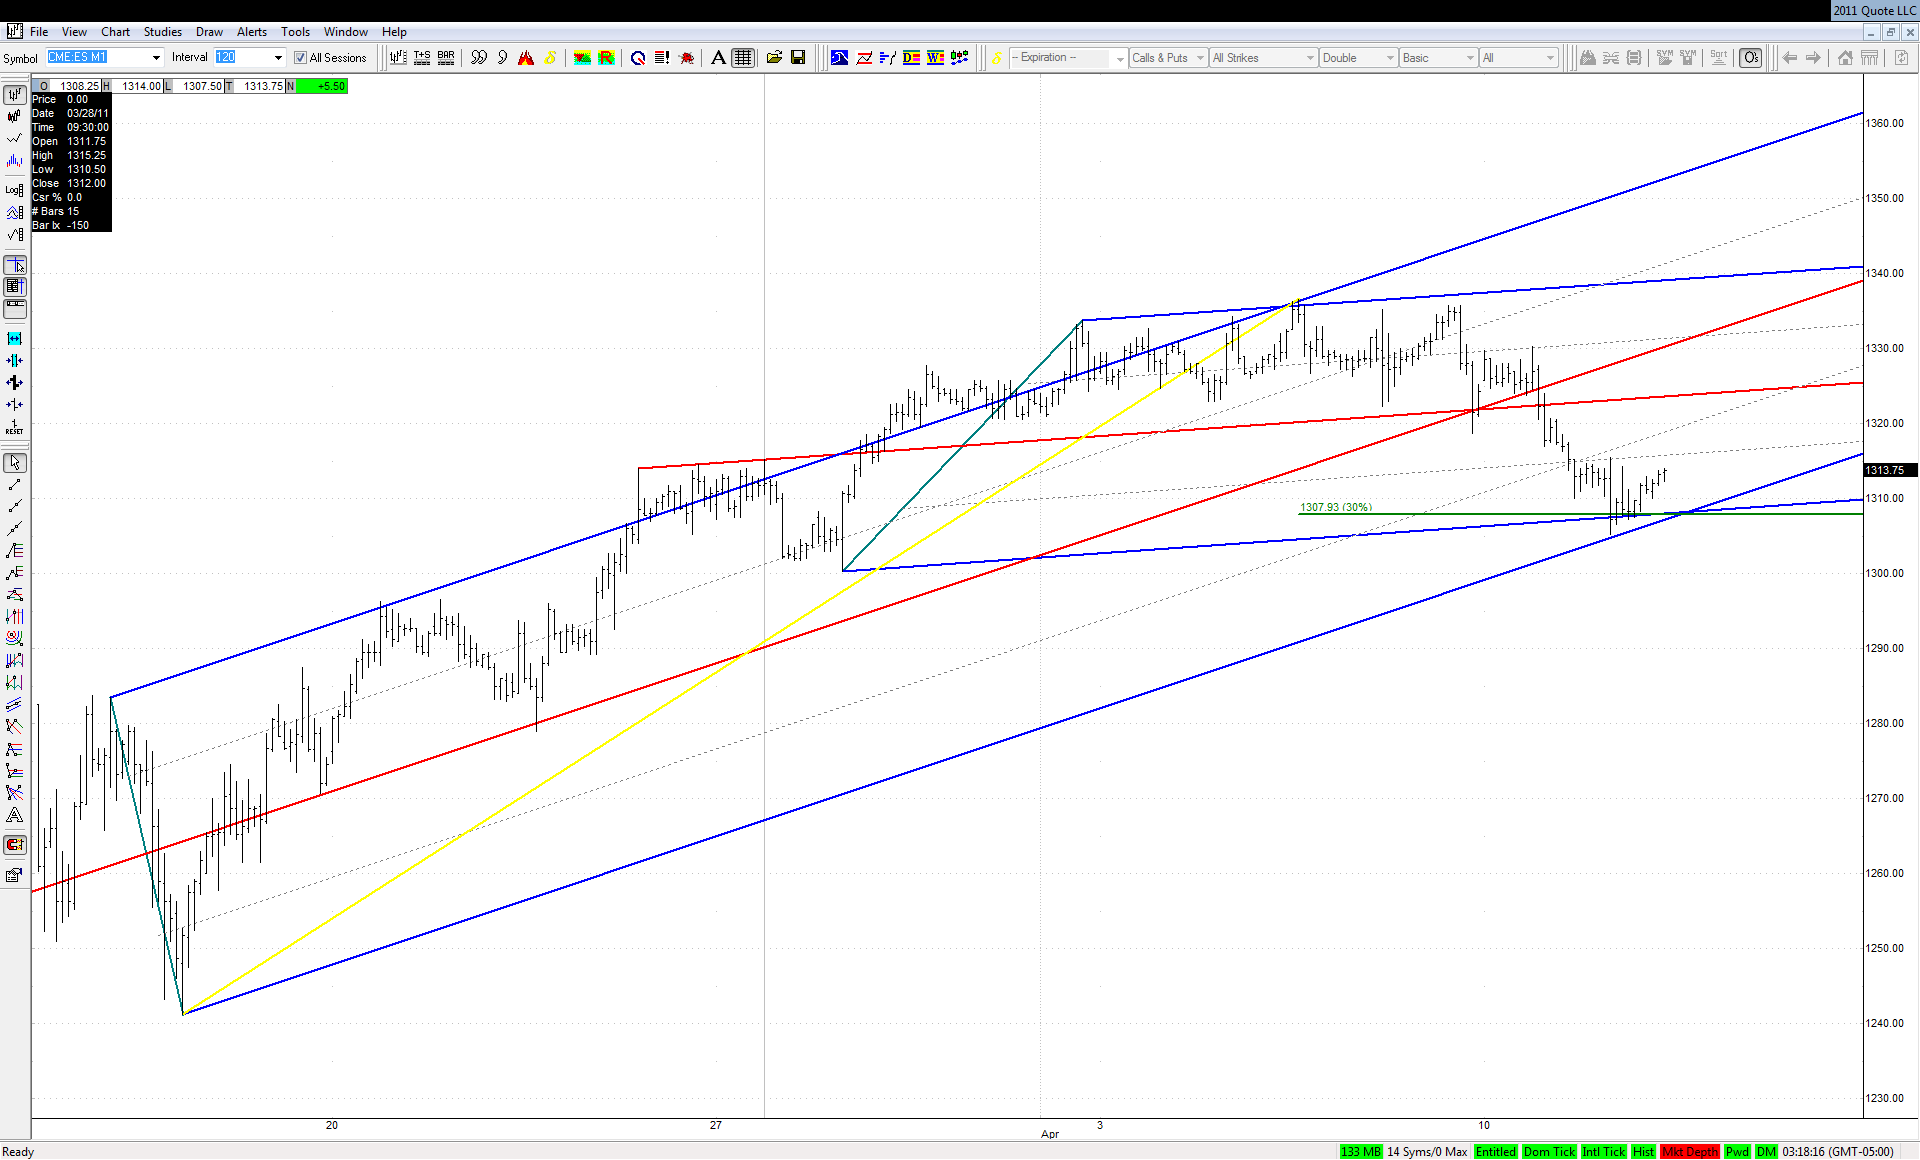
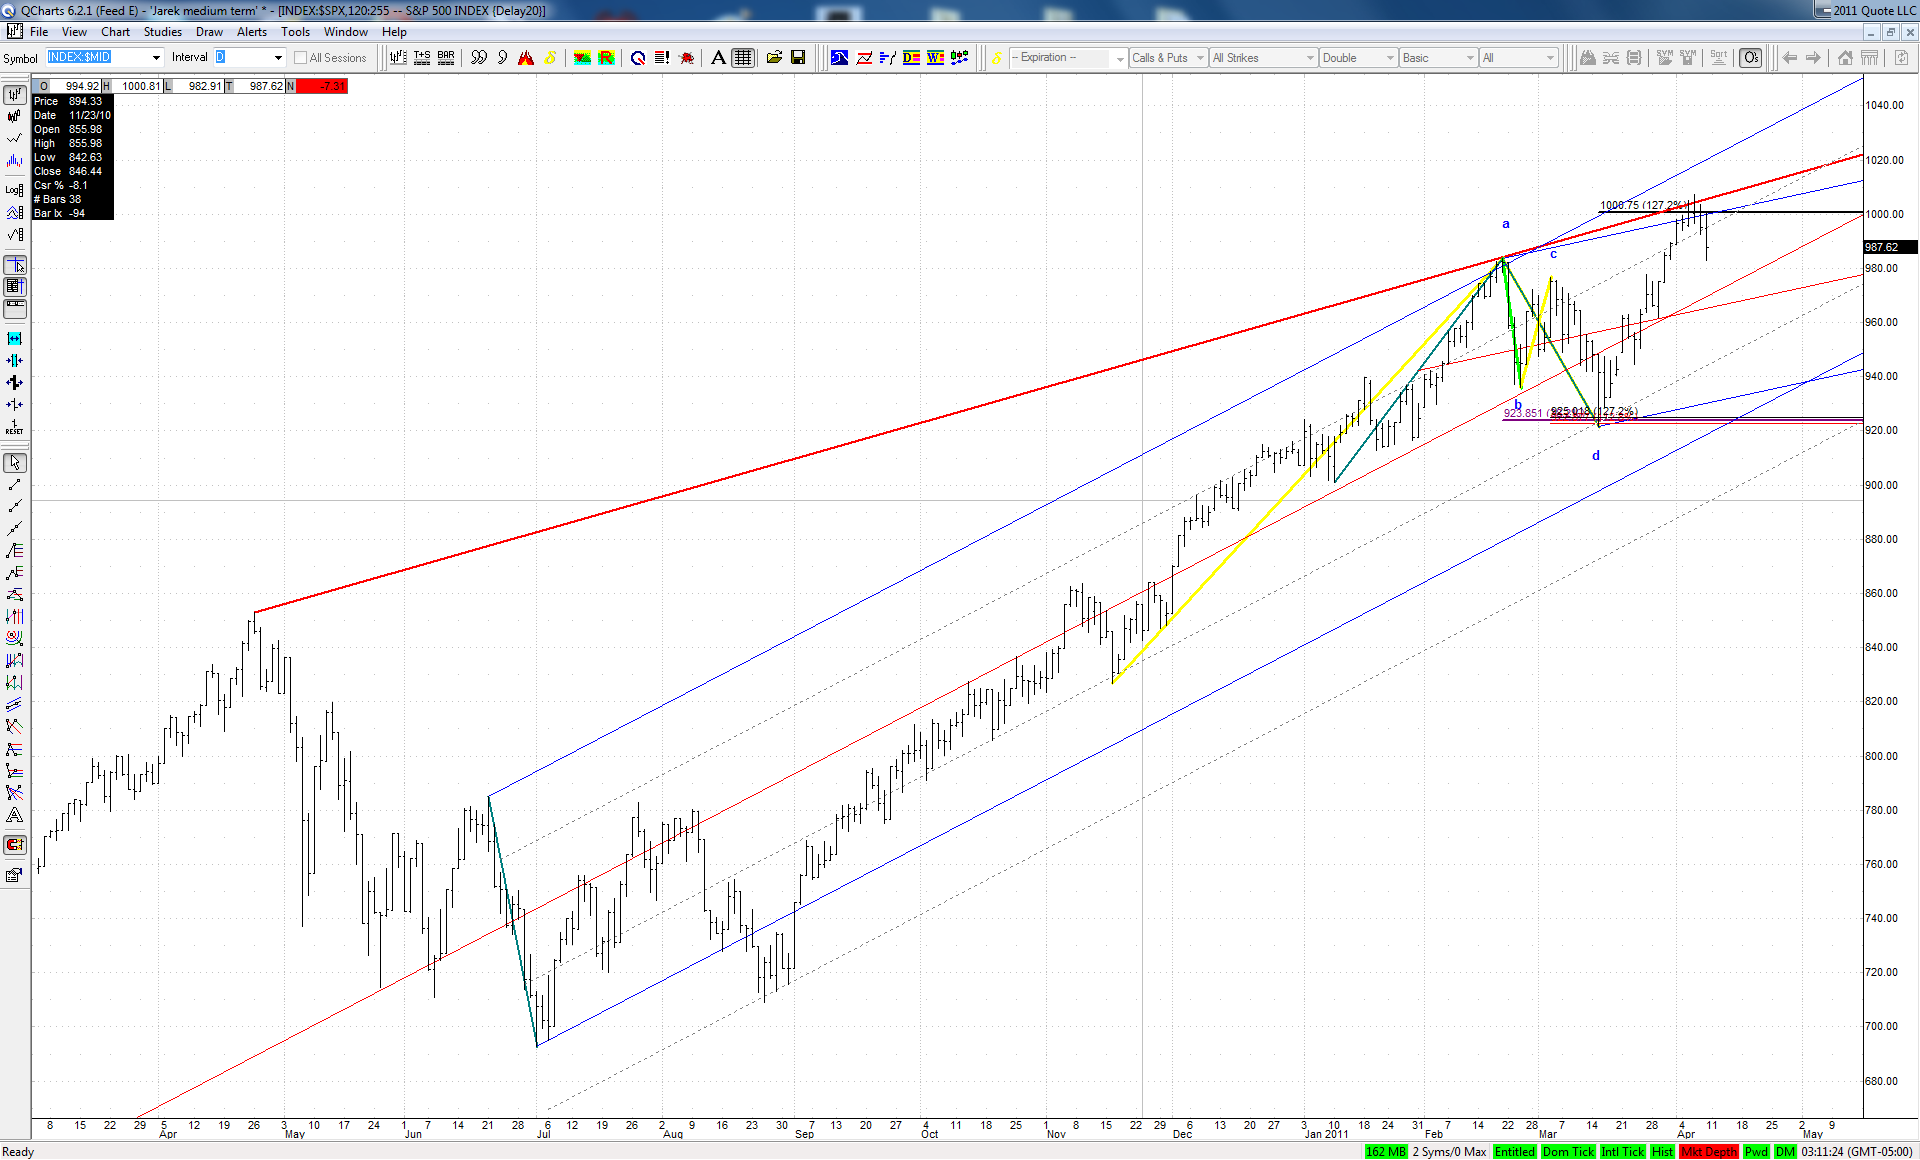
So they were able to get over this downsloping ML in the move off the Game Zone? This move up may have some legs:

Click image for original size
JA
jarek
Rep: 94
Posts: 3,474
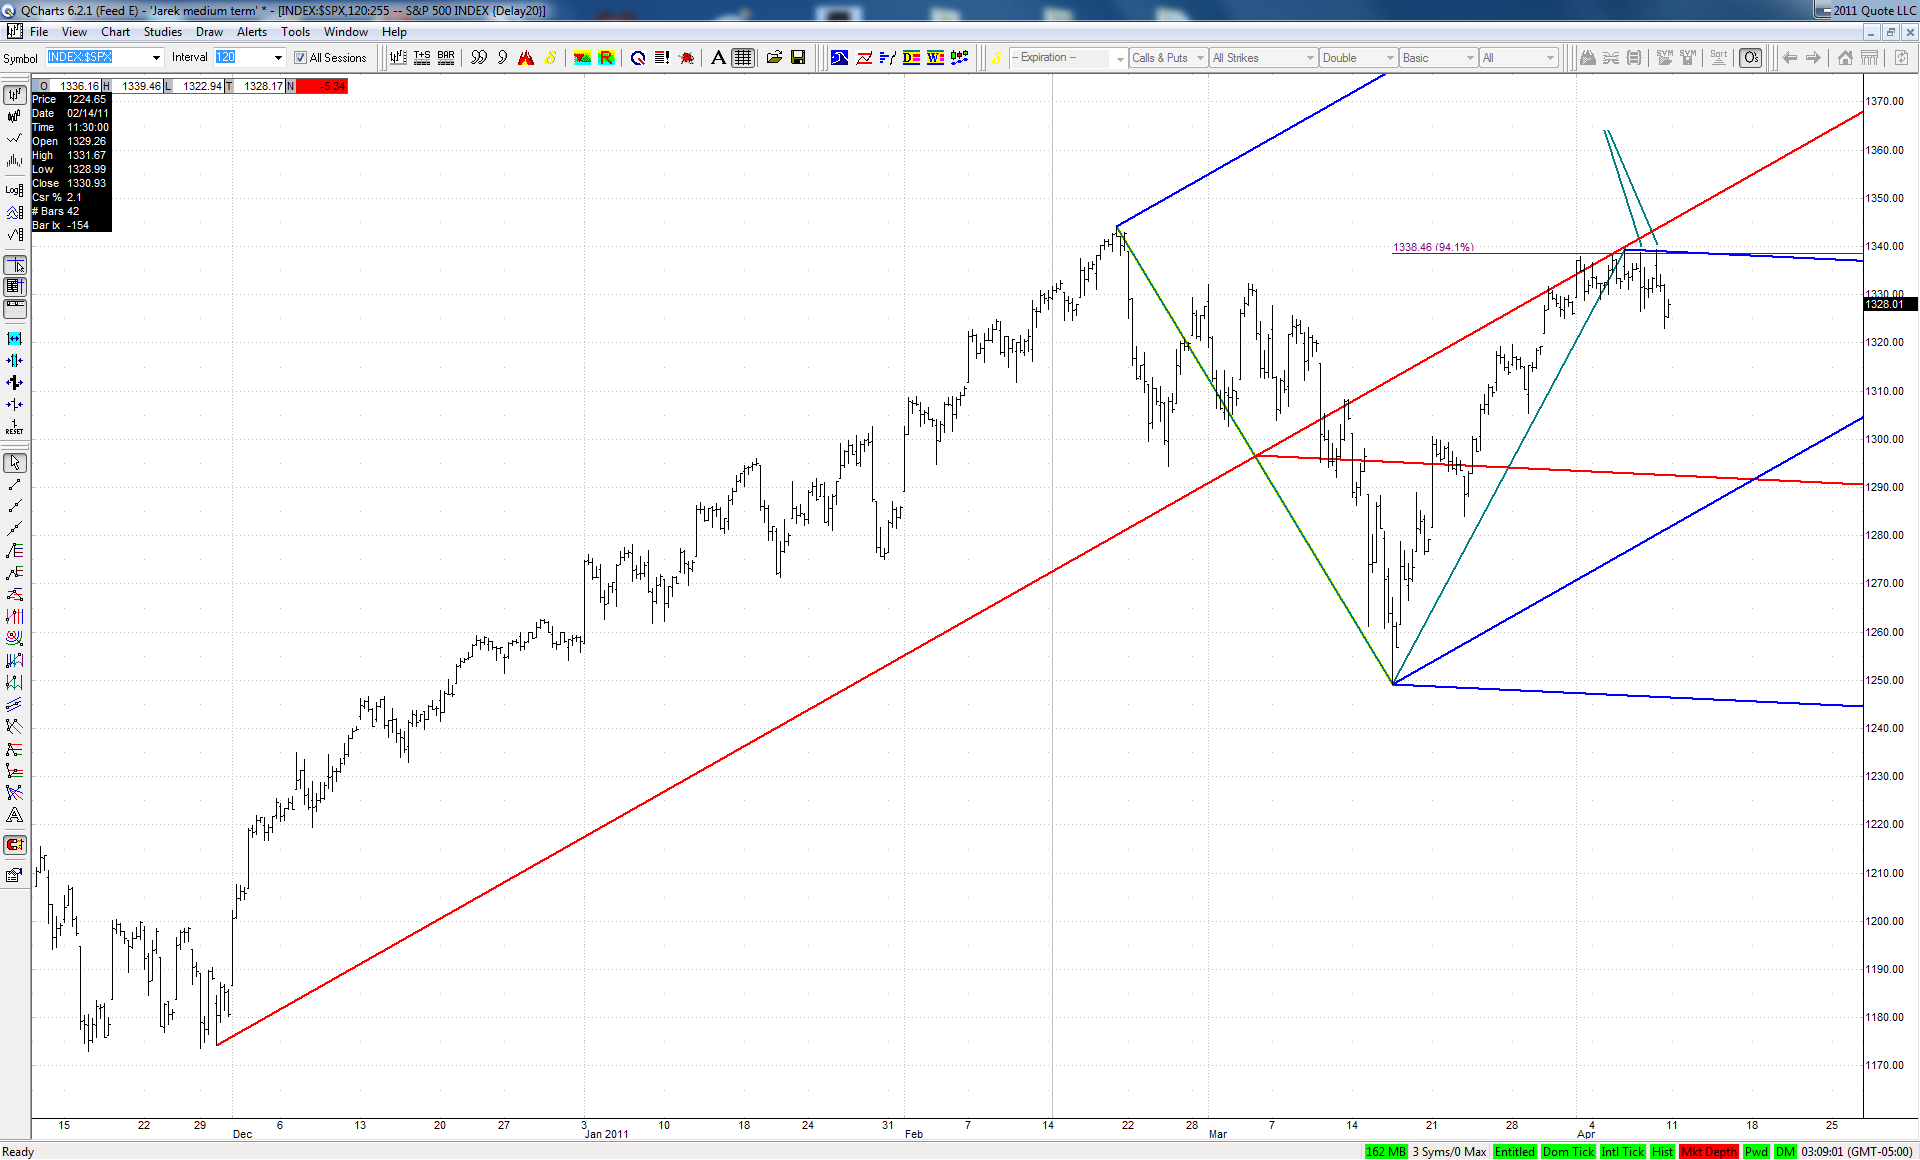
Medium term it looks encouraging for bulls:

Click image for original size
JA
jarek
Rep: 94
Posts: 3,474
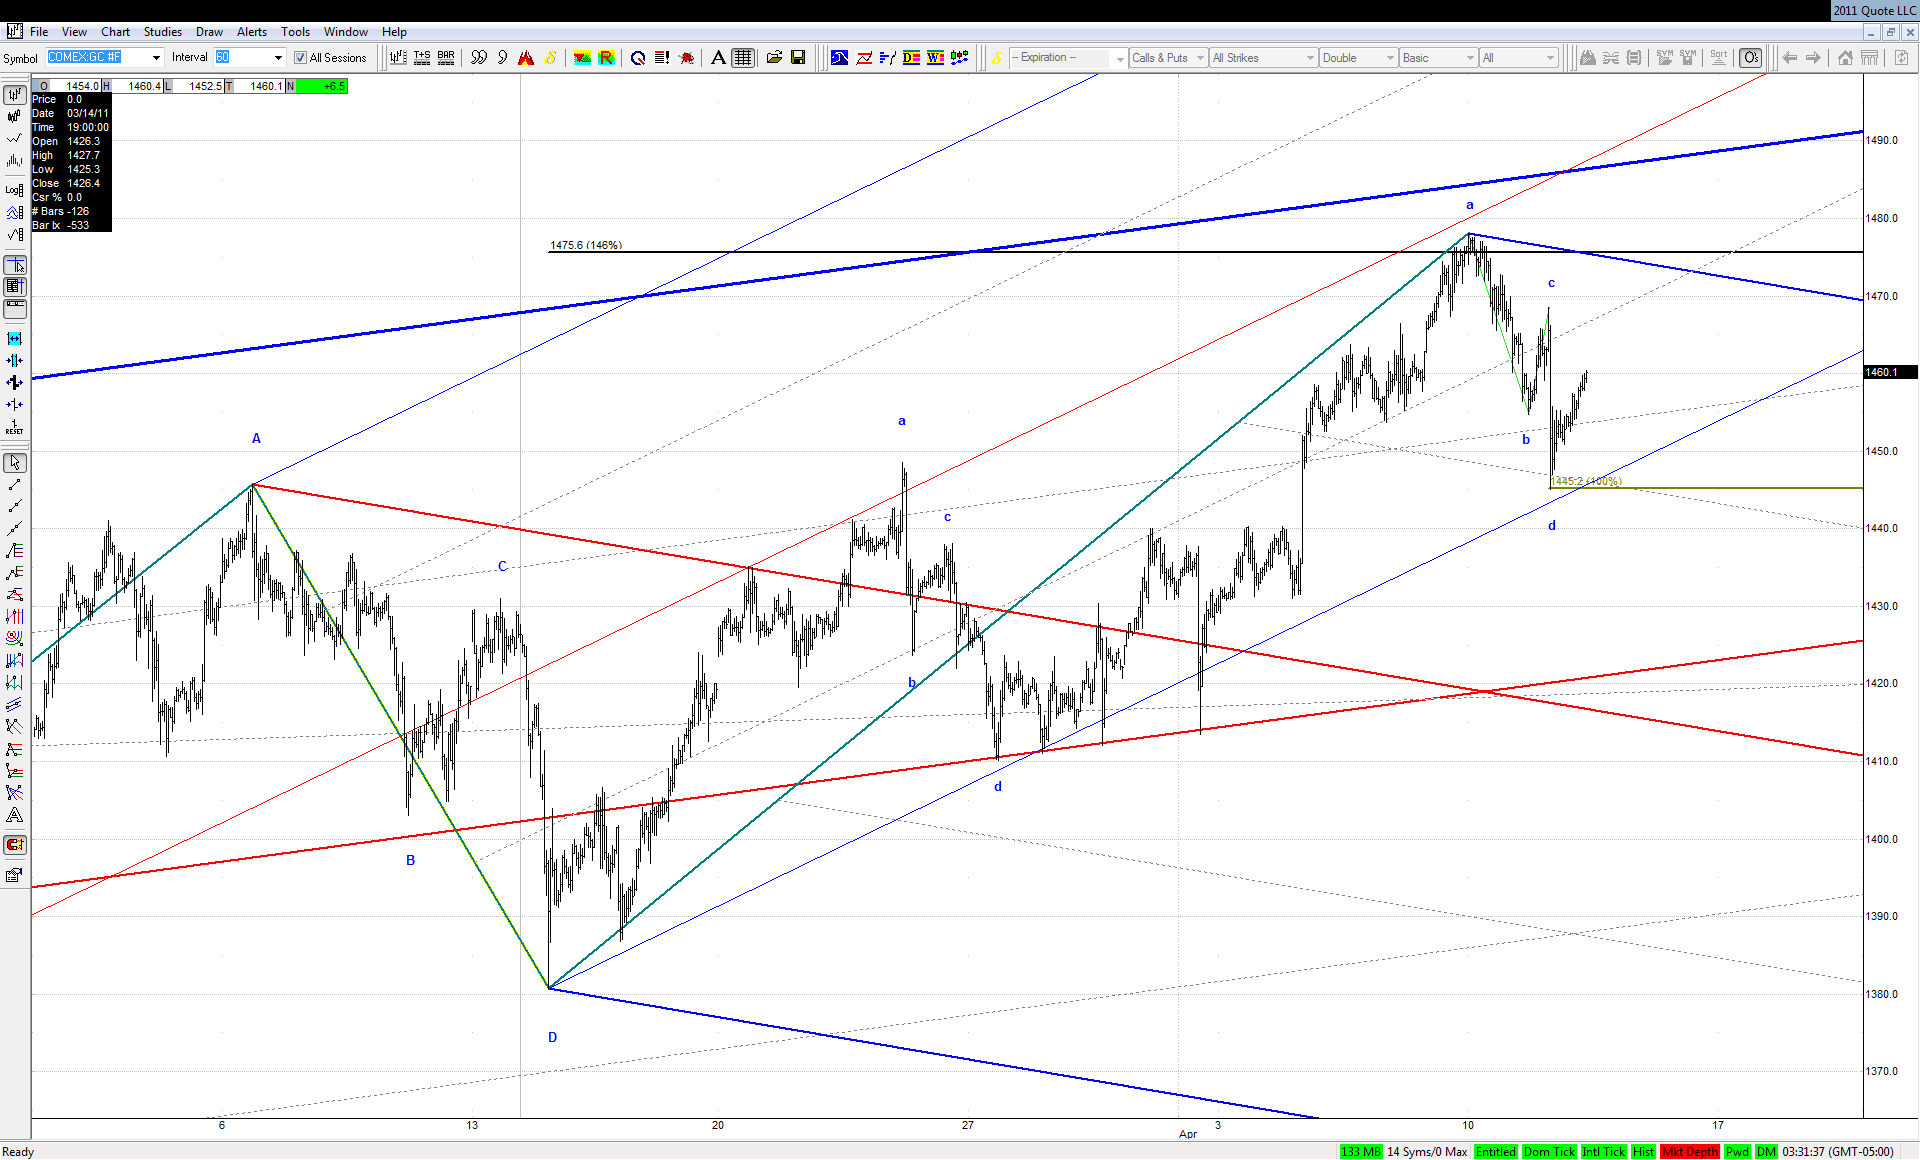
Reaction to this ideal 1.000 standard ABCD in Gold will give us the answer to the question if 1.46 of the bigger bullish ABCD at recent top was already IT:

Click image for original size
RA
rat89
Rep: 0
Posts: 7,015
good morning, and thank you both for your thoughts on x. this discussion just proved once again what is great about this forum. jim, I had some of those same thoughts regarding the longer term chart and the high of last april. In fact, the schiff set I have going back to last year has x having finally reached the upper line and even doing a stretch.

On the c measurement, can you verify how you arrived at .447? I only ask because I have it as ab/ 57.55 > 53.17 = 55.75 closest to .618 = 55.88. ?
JA
jarek
Rep: 94
Posts: 3,474
Originally posted by jimkane

... so the Gross post will be short...


I see that we have a new definition of "short"