MyPivots
Sign In
JA
jarek
Rep: 94
Posts: 3,474
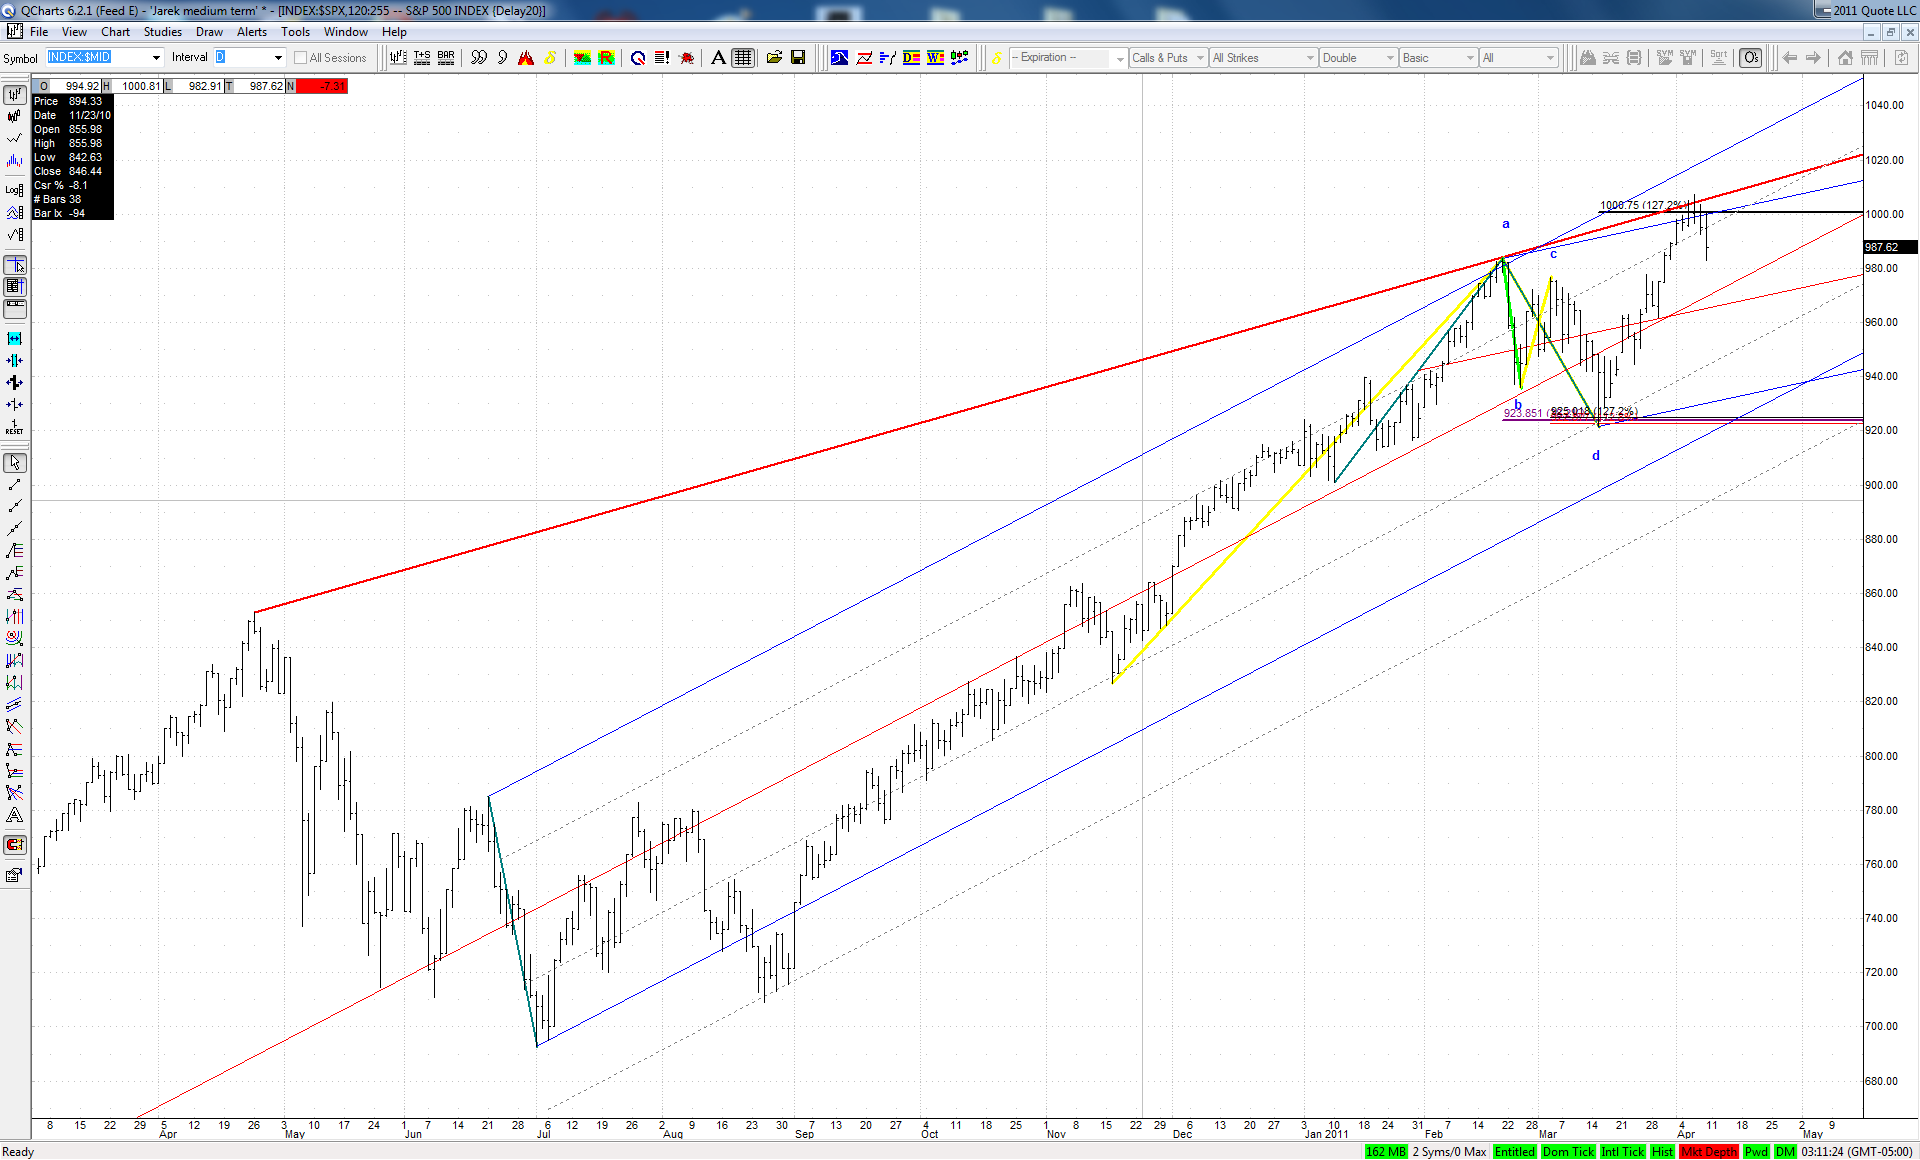
I'm wondering about possible scenarios for a full playout of this test and retest at SPX showed here on Friday:

Click image for original size
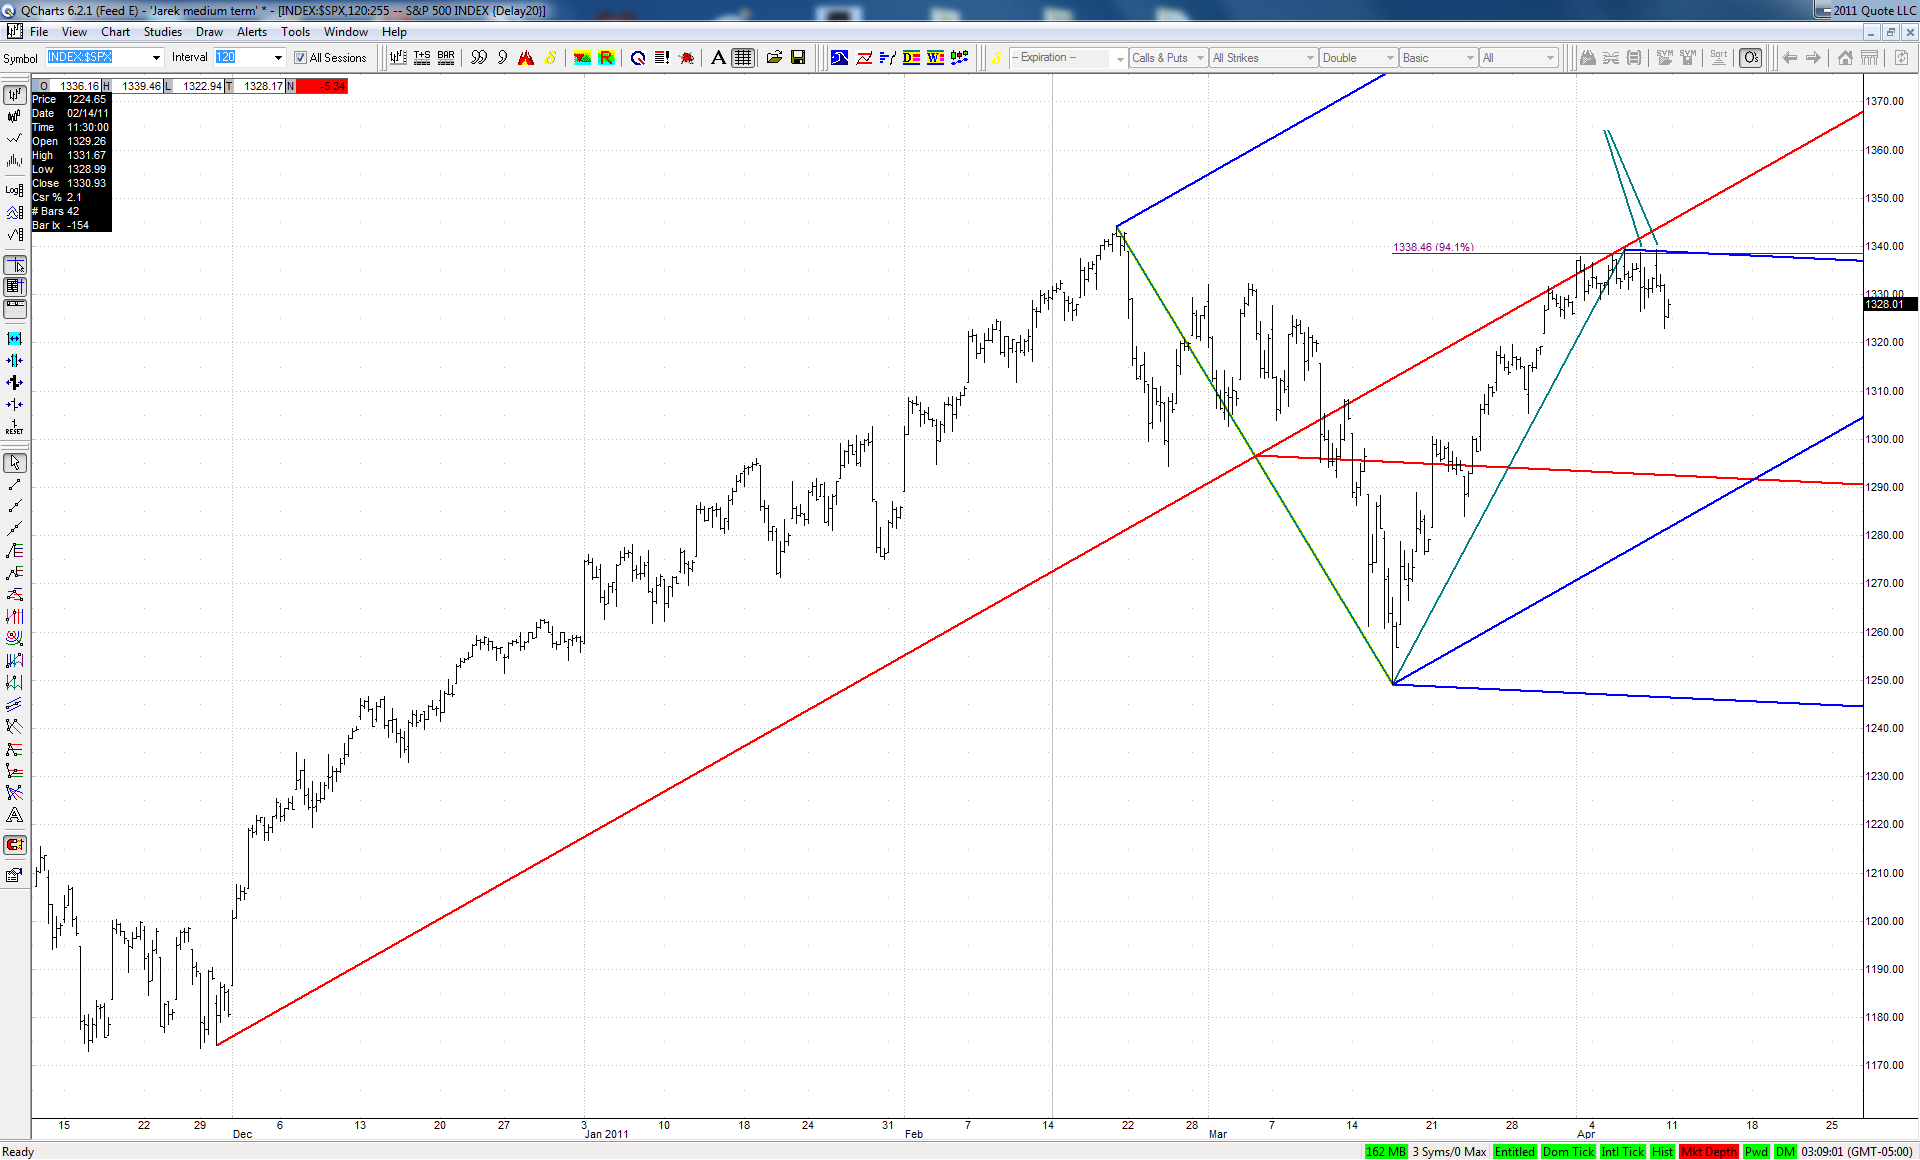

... and the only reason for a quick drop from here to the lower ML could in my opinion be a failed 5th wave at SPX and ES. Because on many other indexes the recent rise looks like already completed 5th wave:

Click image for original size
JA
jarek
Rep: 94
Posts: 3,474
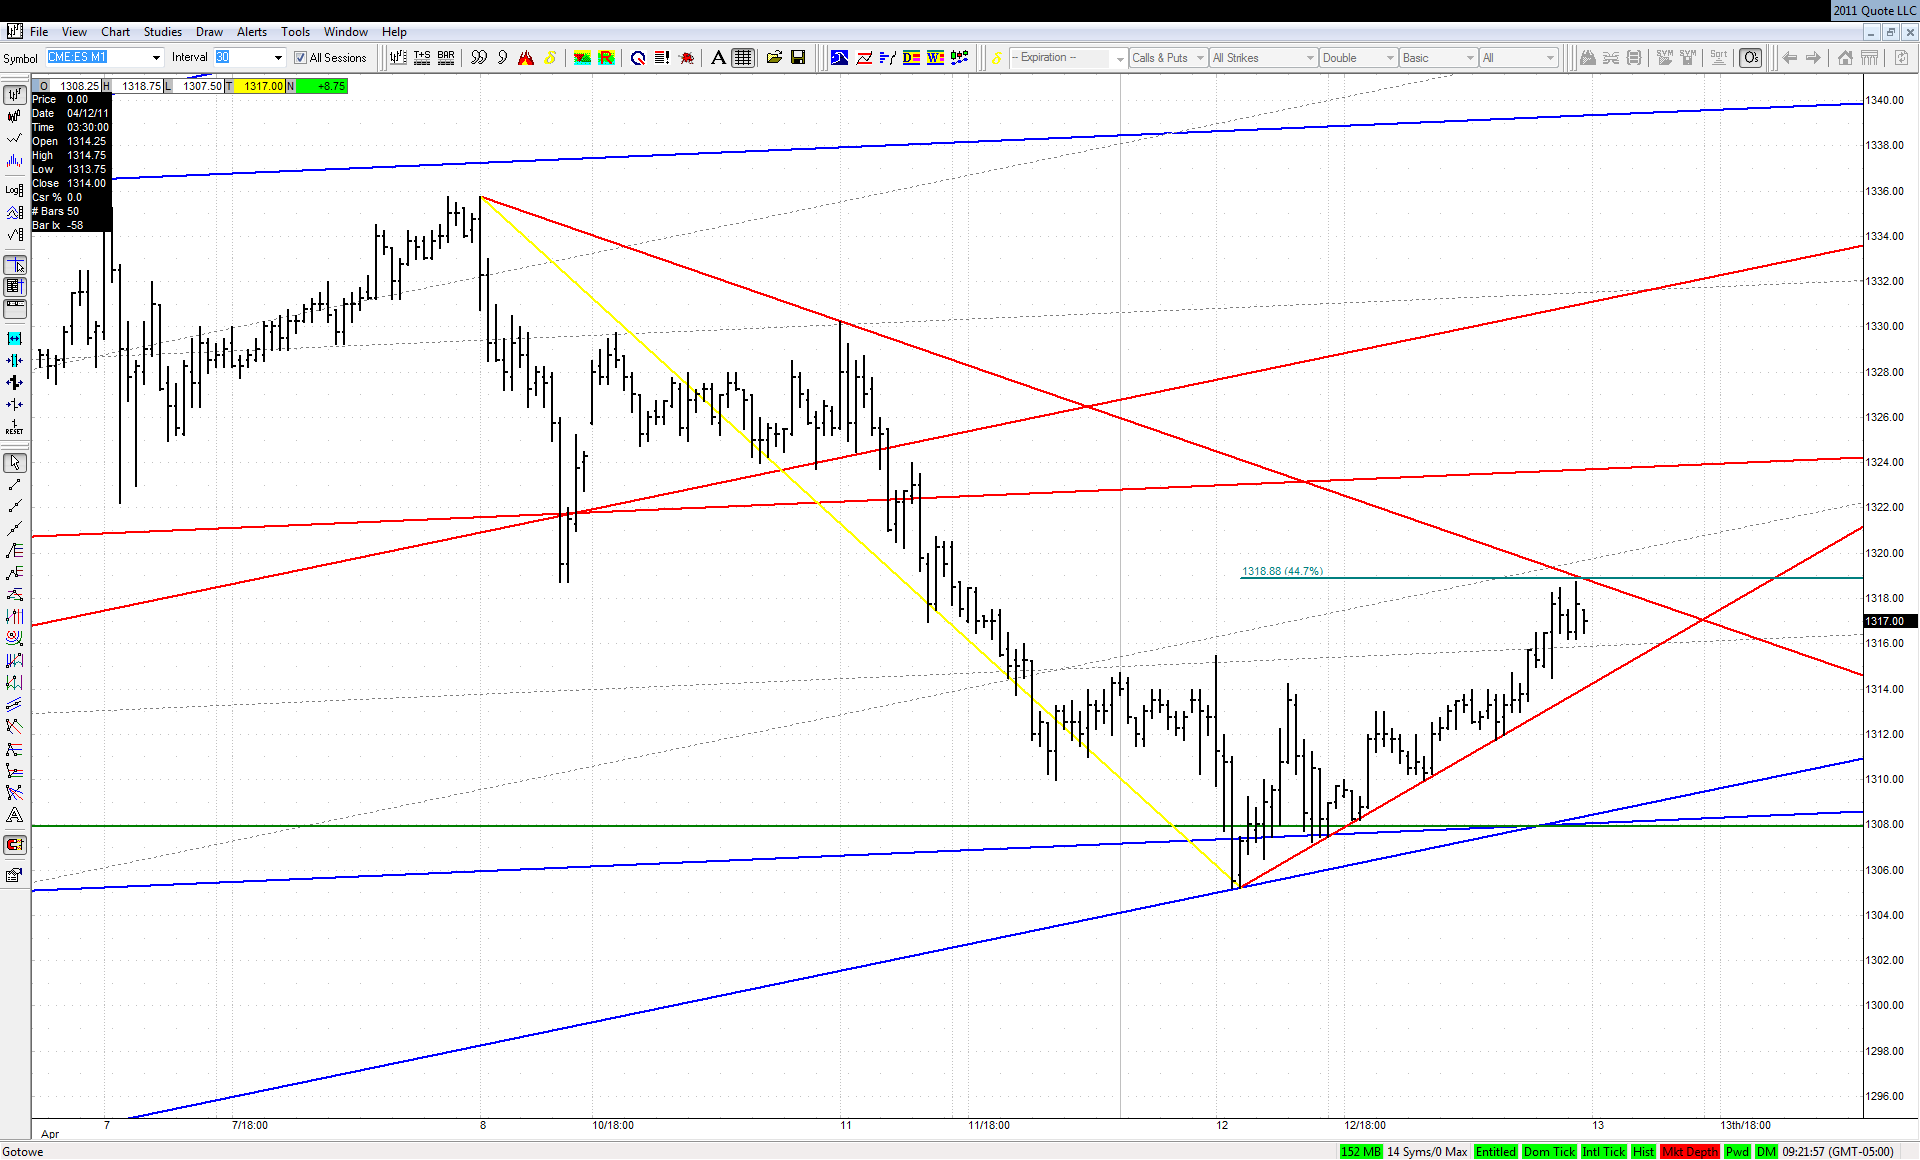
ES reached the downsloping TL right at the .447 to the tick:

Click image for original size
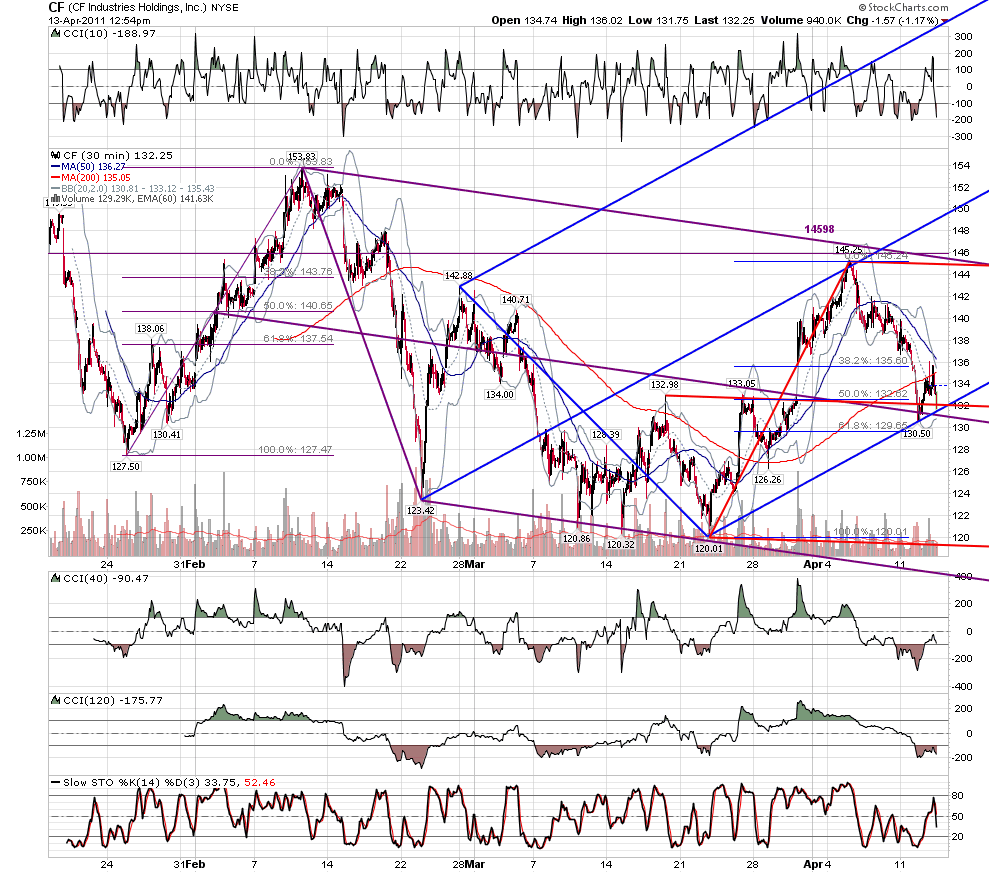

Barring fake breakouts, the first TL which gives way should show the direction for some time
RA
rat89
Rep: 0
Posts: 7,015
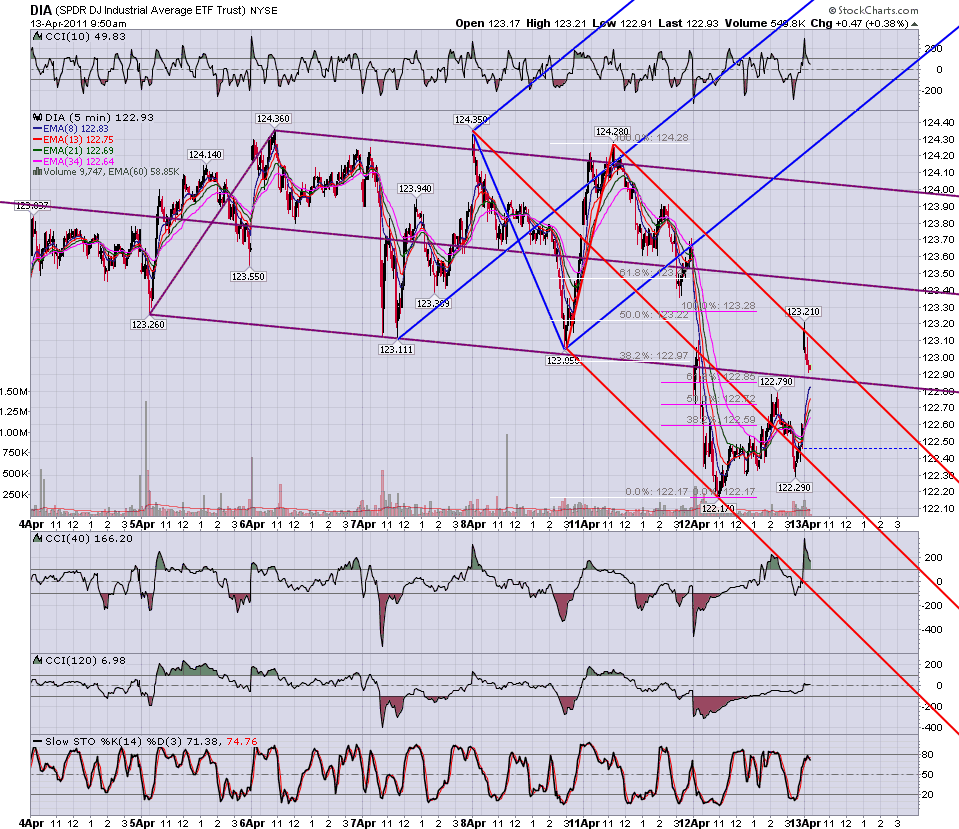
Click image for original size
Click image for original size
RA
rat89
Rep: 0
Posts: 7,015
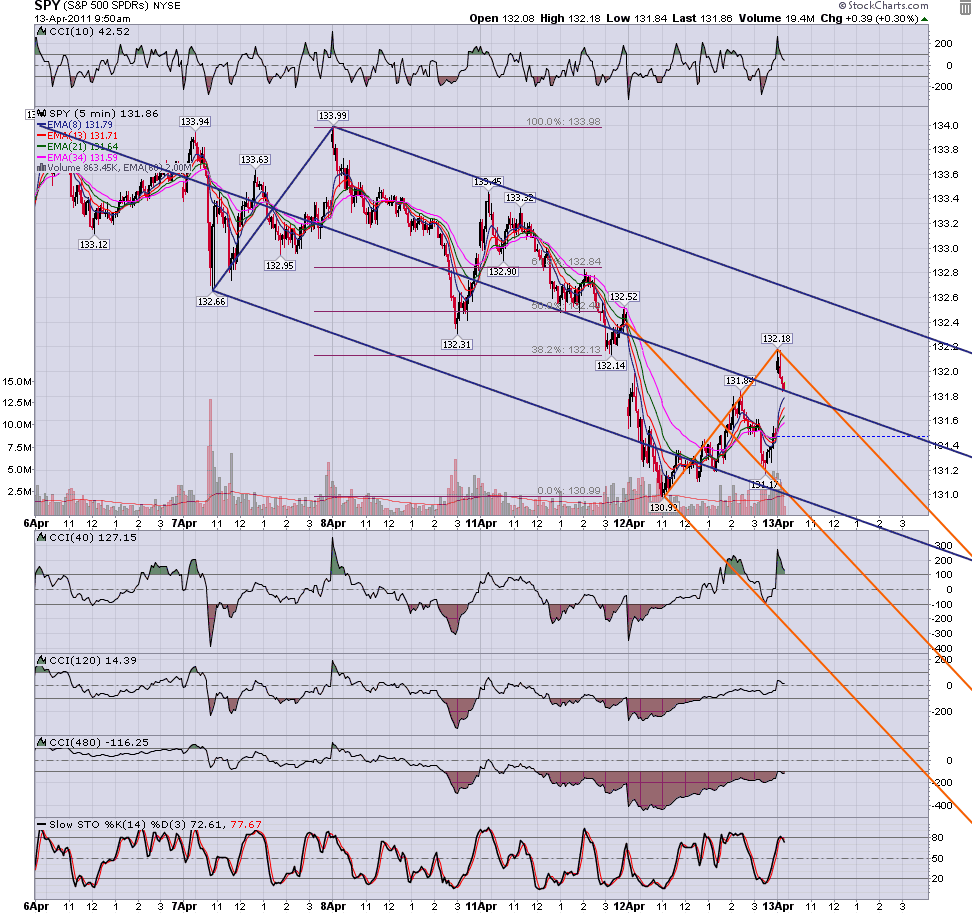
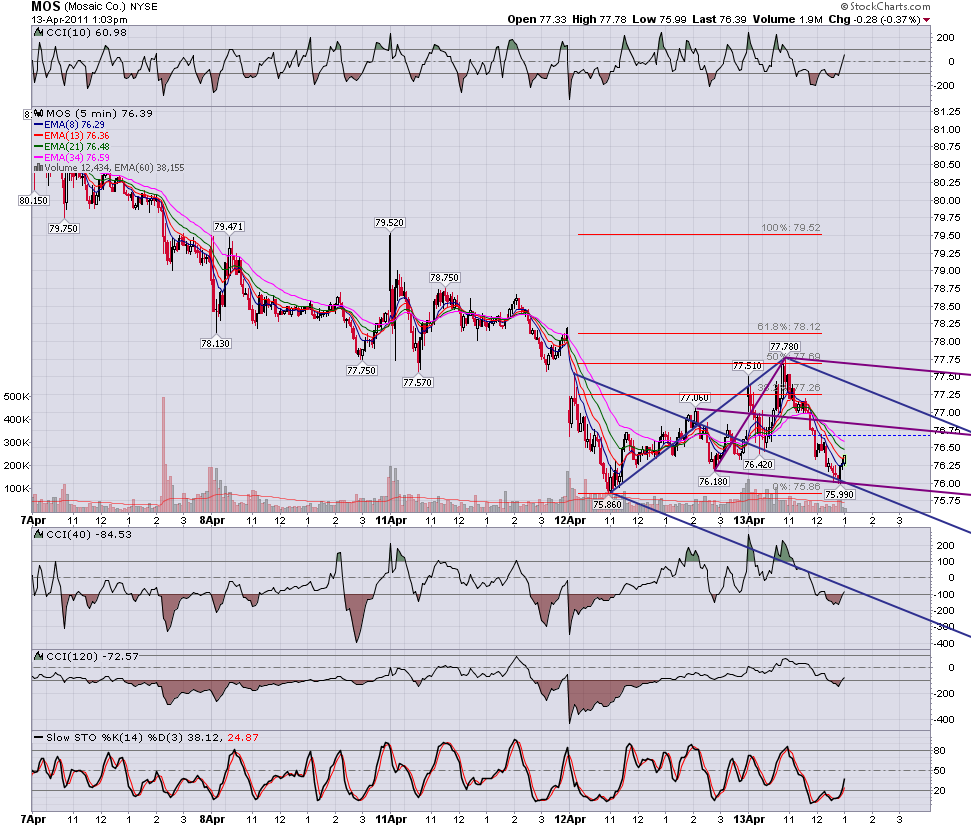
abcd to .382 and .886 on gap on 5

Click image for original size
RA
rat89
Rep: 0
Posts: 7,015
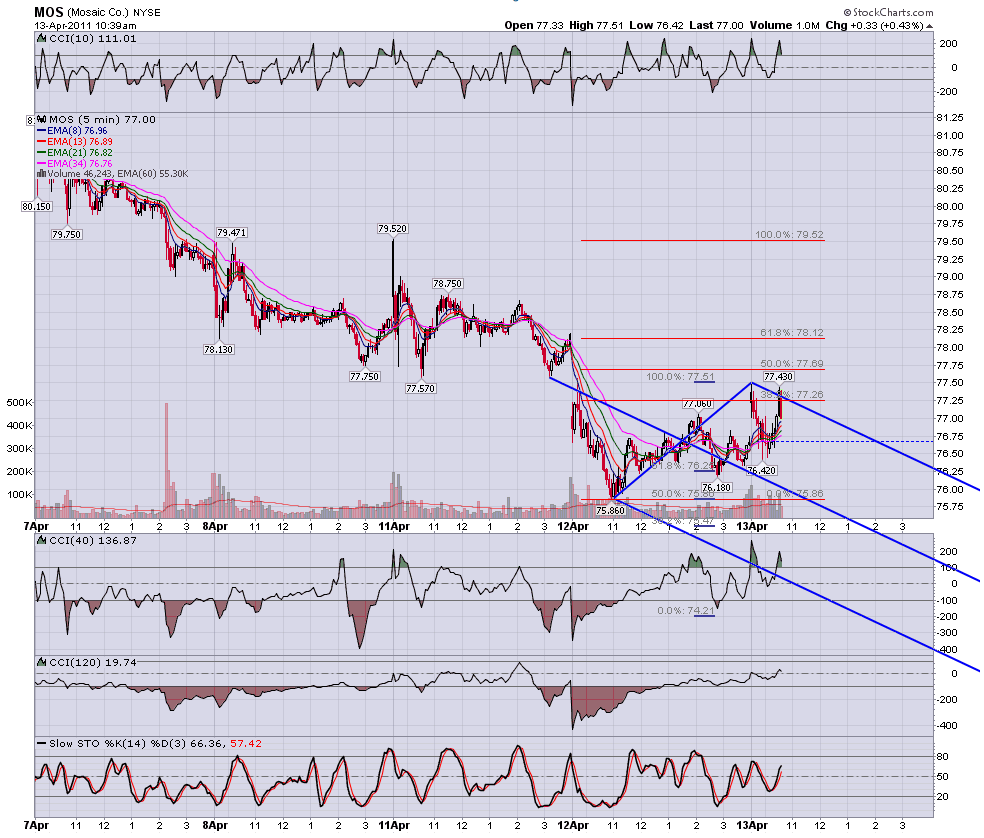
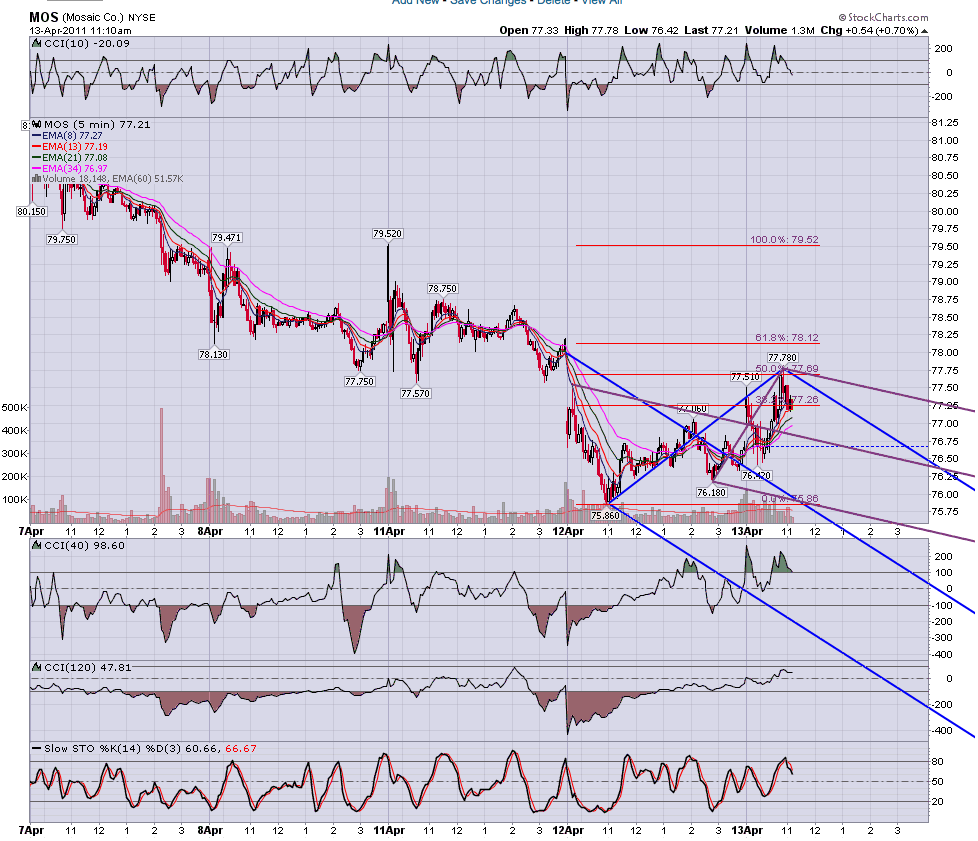
went for the 1.27 at 77.80...

Originally posted by rat89

abcd to .382 and .886 on gap on 5


RA
rat89
Rep: 0
Posts: 7,015
this time for sure....presto


Click image for original size
RA
rat89
Rep: 0
Posts: 7,015
Click image for original size
RA
rat89
Rep: 0
Posts: 7,015
moment of truth?
and a small adjustment on the 5

Click image for original size

Click image for original size

Click image for original size
JI
jimkane
Rep: 3,058
Posts: 33,089
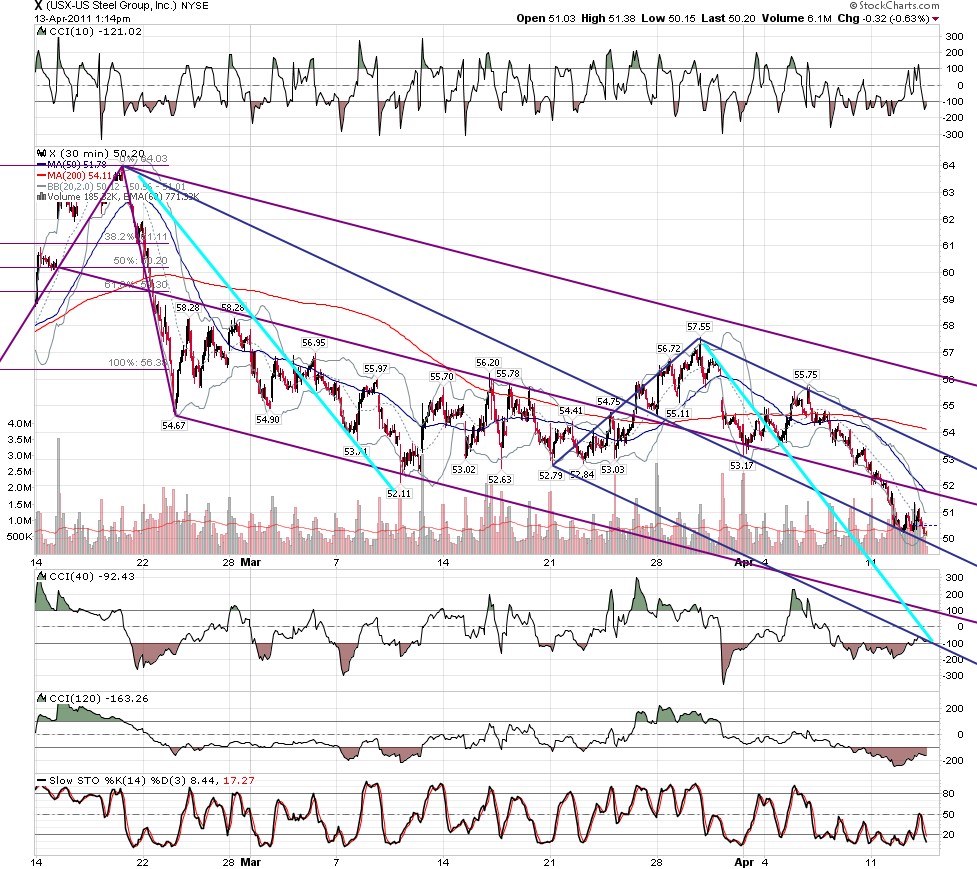
I'm talking about a big ABCD off the recent top. I only look at ABCD's in the direction of the trend, calculated from a new high (in an uptrend). I wouldn't look at any ABCD (or 5-point pattern) that has the direction of the ABCD the same as the direction of the immediate trend. Redo the calculations and labeling from the 2/18/11 high, B on 3/10/11, and C on 3/30/11.


Originally posted by rat89

good morning, and thank you both for your thoughts on x. this discussion just proved once again what is great about this forum. jim, I had some of those same thoughts regarding the longer term chart and the high of last april. In fact, the schiff set I have going back to last year has x having finally reached the upper line and even doing a stretch.

On the c measurement, can you verify how you arrived at .447? I only ask because I have it as ab/ 57.55 > 53.17 = 55.75 closest to .618 = 55.88. ?
JI
jimkane
Rep: 3,058
Posts: 33,089
Let's see if that 2-tick new low for the move on the ES bottoms this out. 'Normally' I'd be looking at the 1.272 or below at a key line. 'Nowadays' I watch the 1 or 2-tick trap as a high probability scenario...
RA
rat89
Rep: 0
Posts: 7,015
aha! and I think I see how you get your mid 45.50 - 46 area too....

Originally posted by jimkane

I'm talking about a big ABCD off the recent top. I only look at ABCD's in the direction of the trend, calculated from a new high (in an uptrend). I wouldn't look at any ABCD (or 5-point pattern) that has the direction of the ABCD the same as the direction of the immediate trend. Redo the calculations and labeling from the 2/18/11 high, B on 3/10/11, and C on 3/30/11.


Click image for original size
JA
jarek
Rep: 94
Posts: 3,474
Originally posted by jimkane

... so the Gross post will be short...


I see that we have a new definition of "short"