MyPivots
Sign In
JA
jarek
Rep: 94
Posts: 3,474
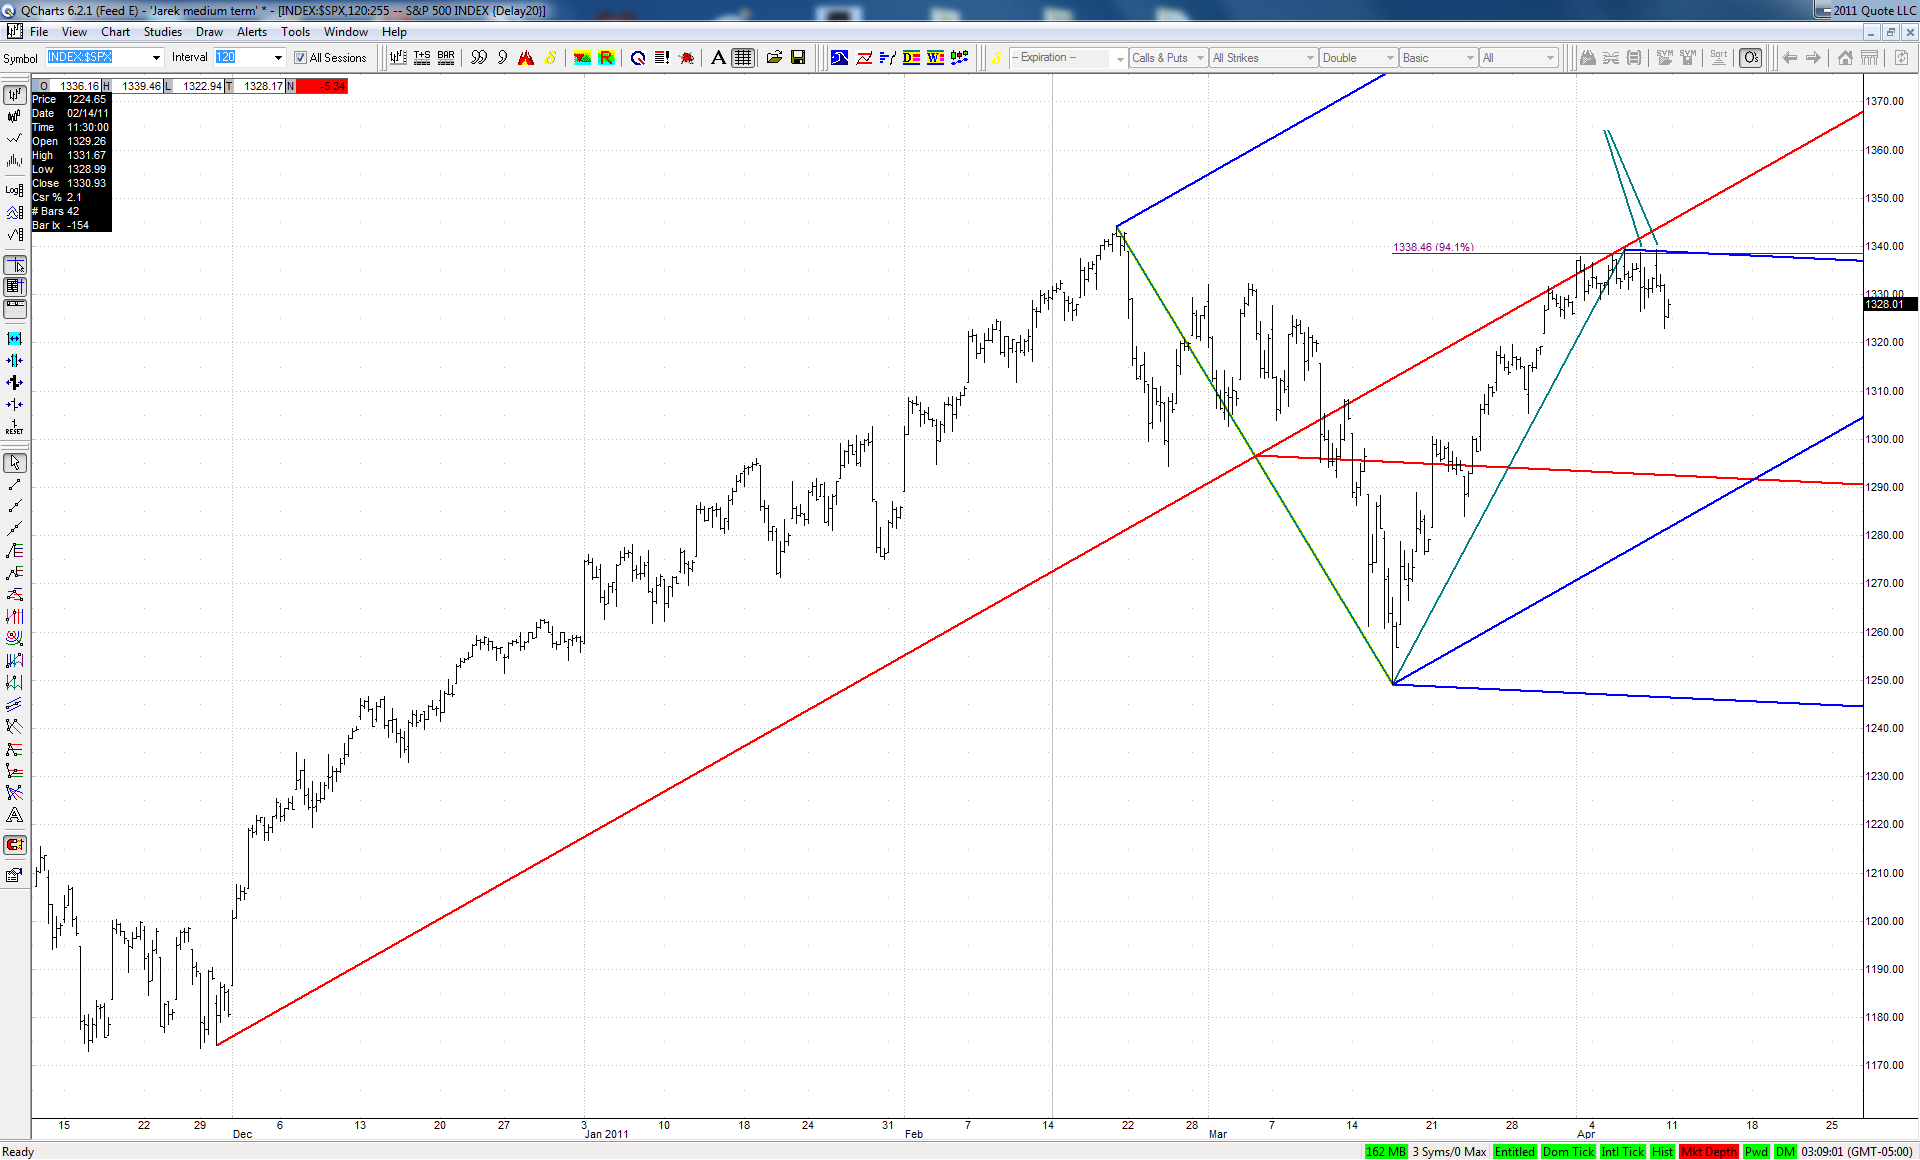
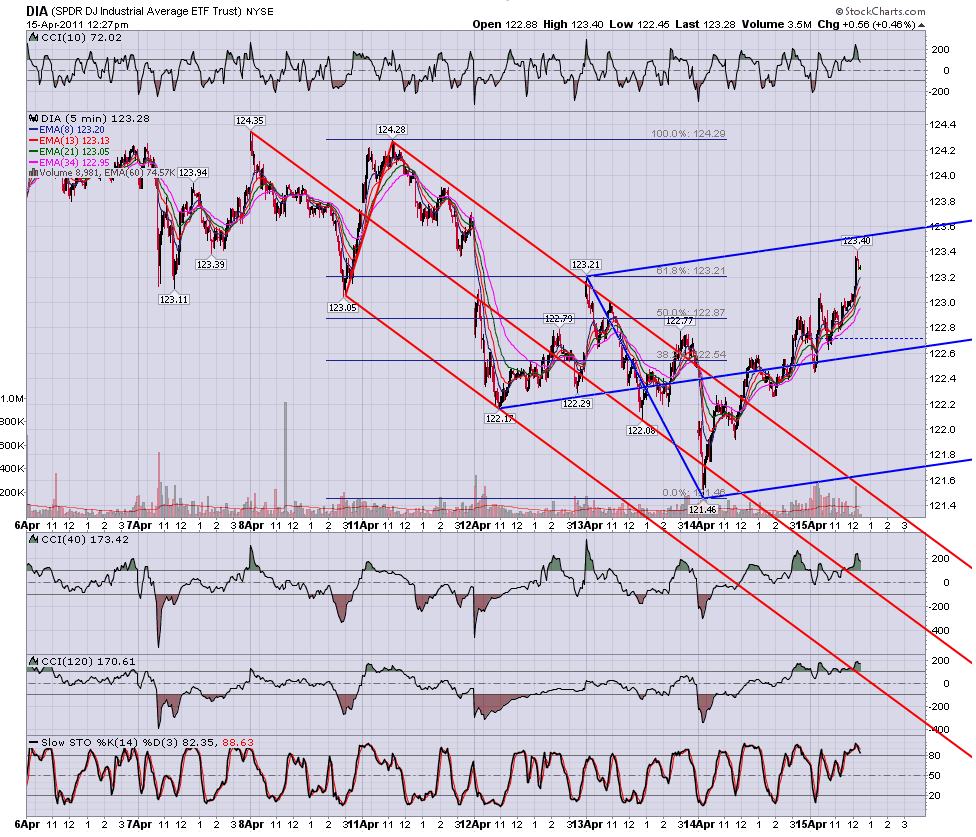
I'm wondering about possible scenarios for a full playout of this test and retest at SPX showed here on Friday:

Click image for original size


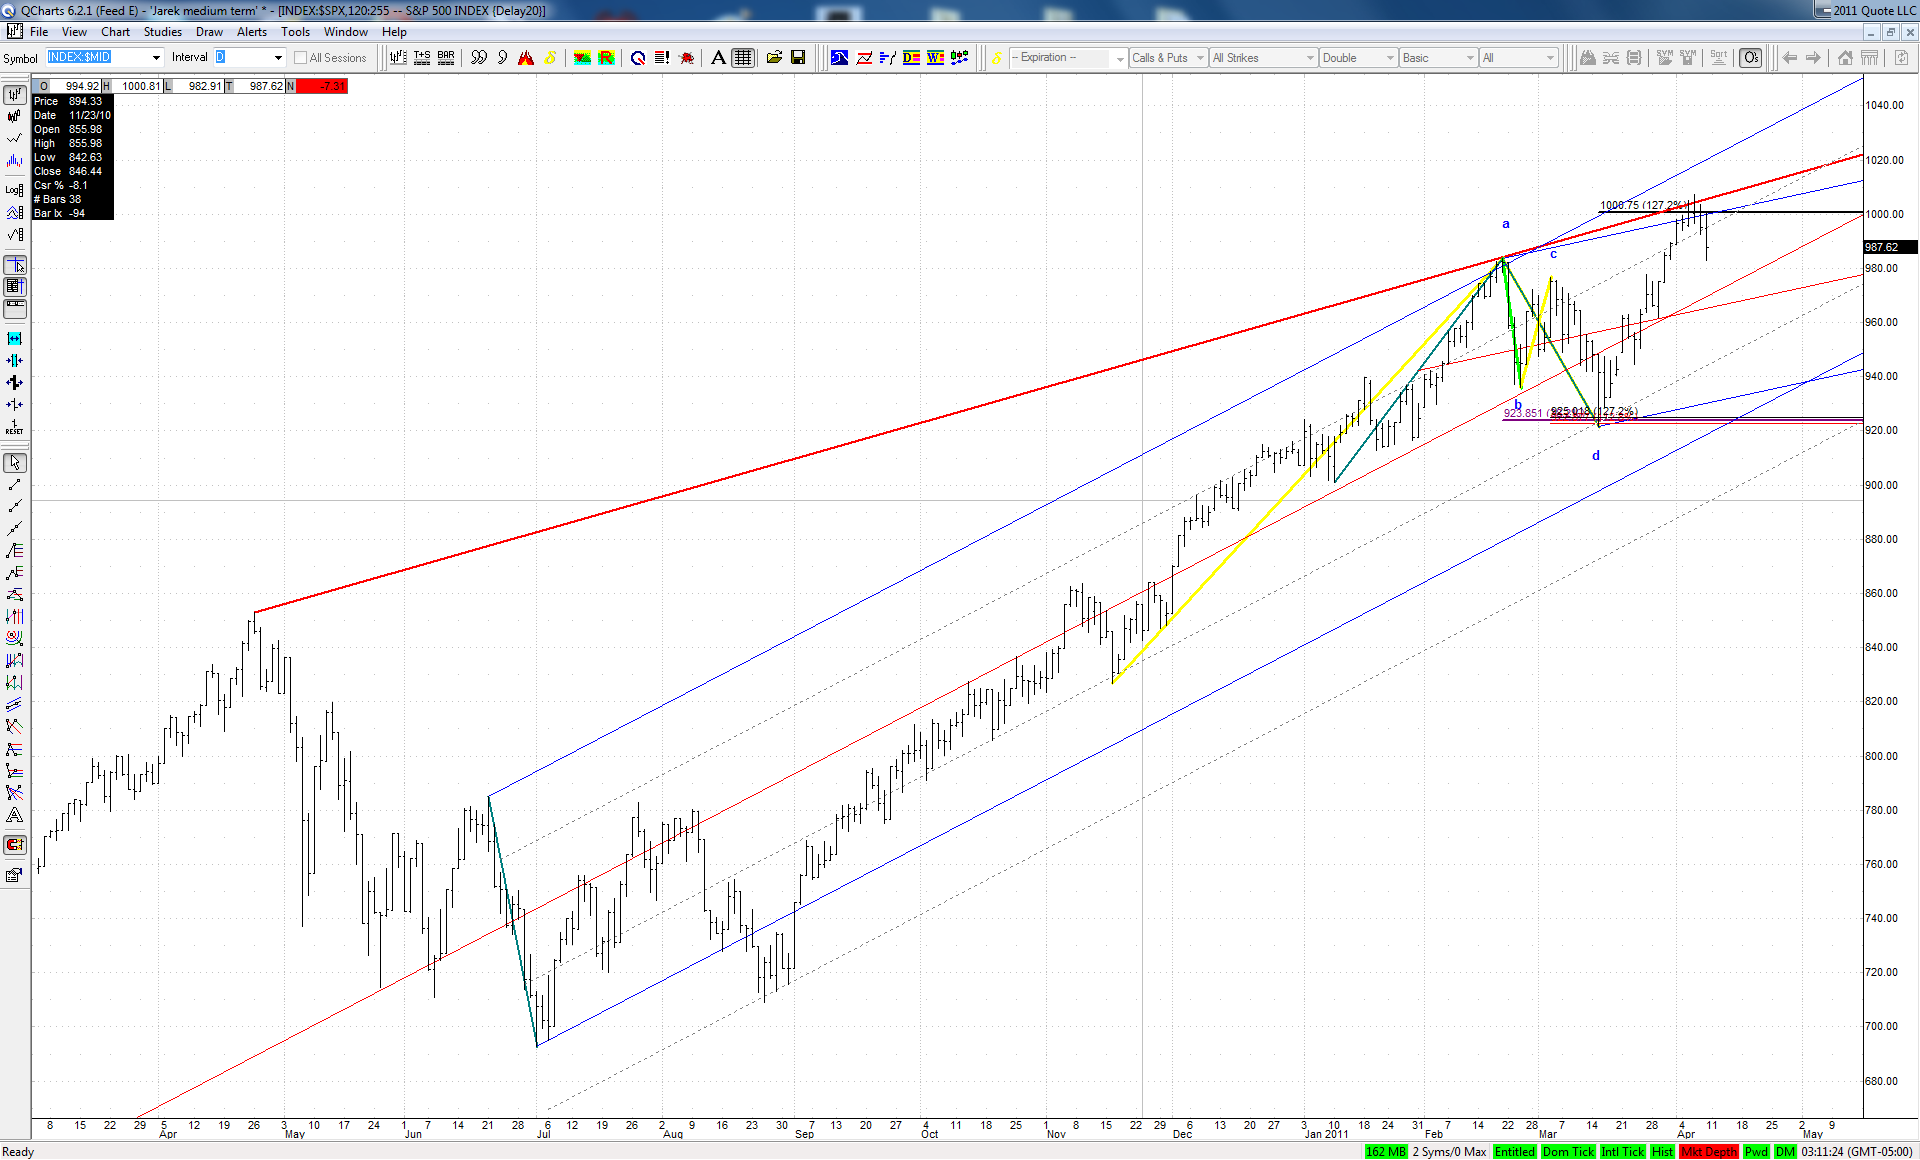
... and the only reason for a quick drop from here to the lower ML could in my opinion be a failed 5th wave at SPX and ES. Because on many other indexes the recent rise looks like already completed 5th wave:

Click image for original size
RA
rat89
Rep: 0
Posts: 7,015
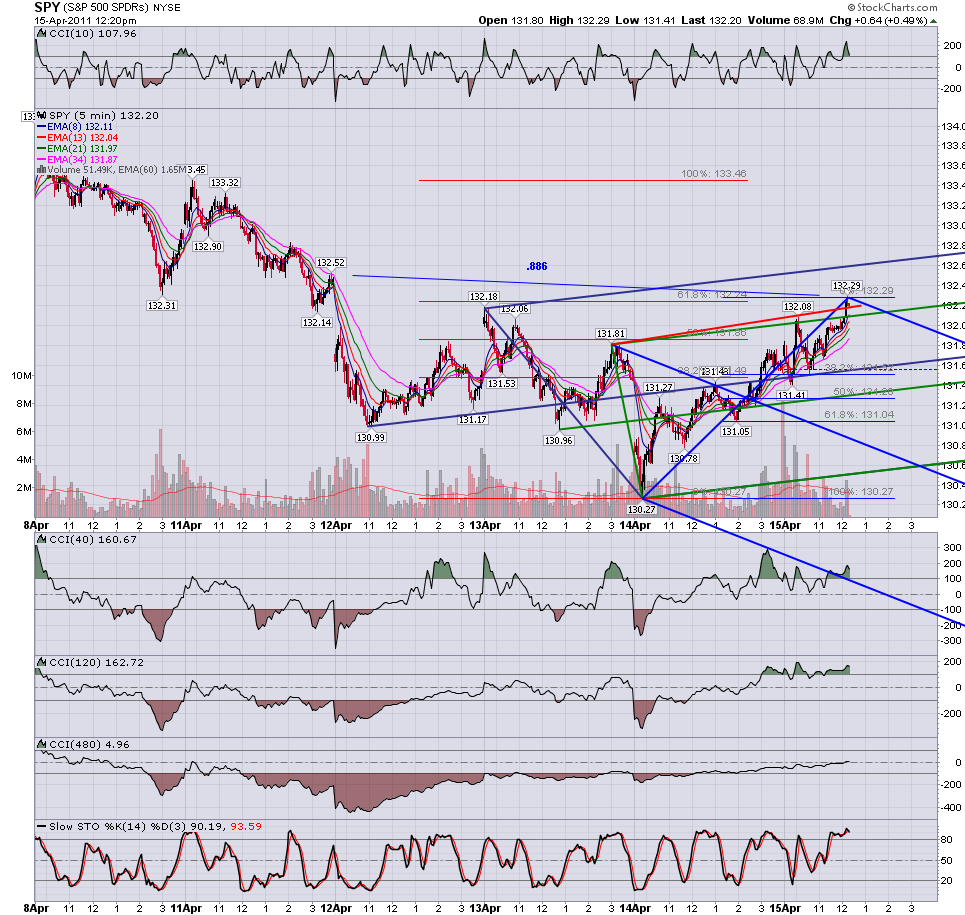
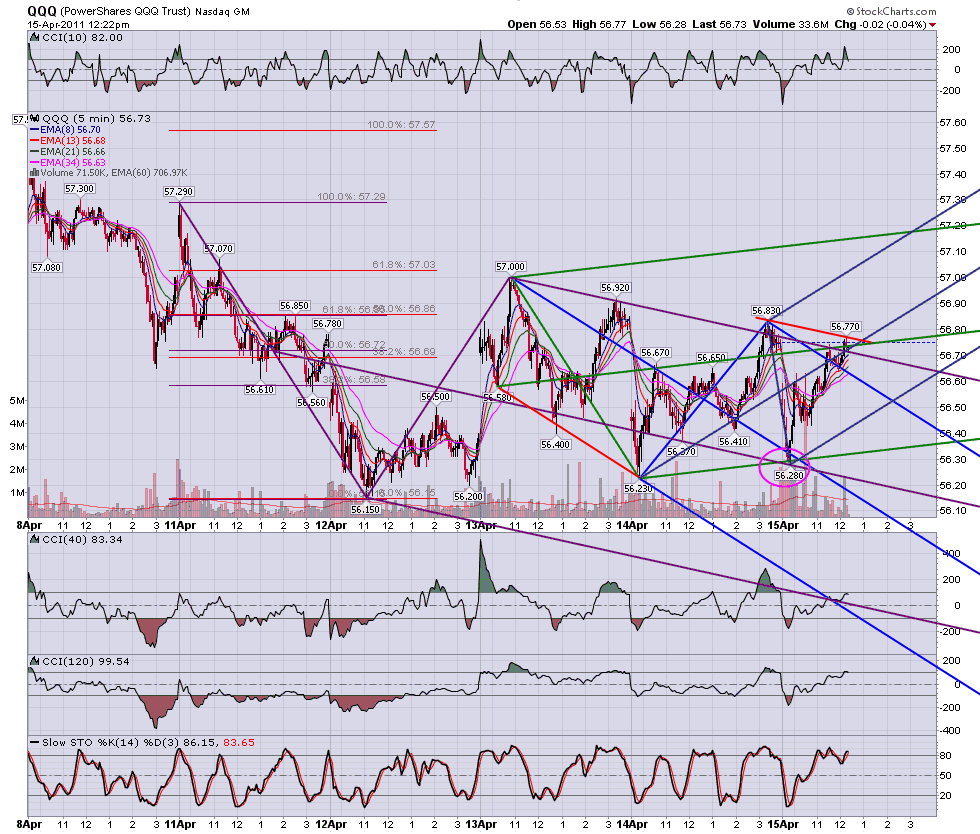
.886 again on qqq......886 and .618 on spy....good place for a long exit? do they really move down from here?

Click image for original size

Click image for original size
RA
rat89
Rep: 0
Posts: 7,015
1.128 and .685
Click image for original size
JI
jimkane
Rep: 3,058
Posts: 33,089
Yes, I'll post that, and a follow up on my GOOG point. As soon as I can take my eyes off the current ball I'll do it.


Originally posted by jarek

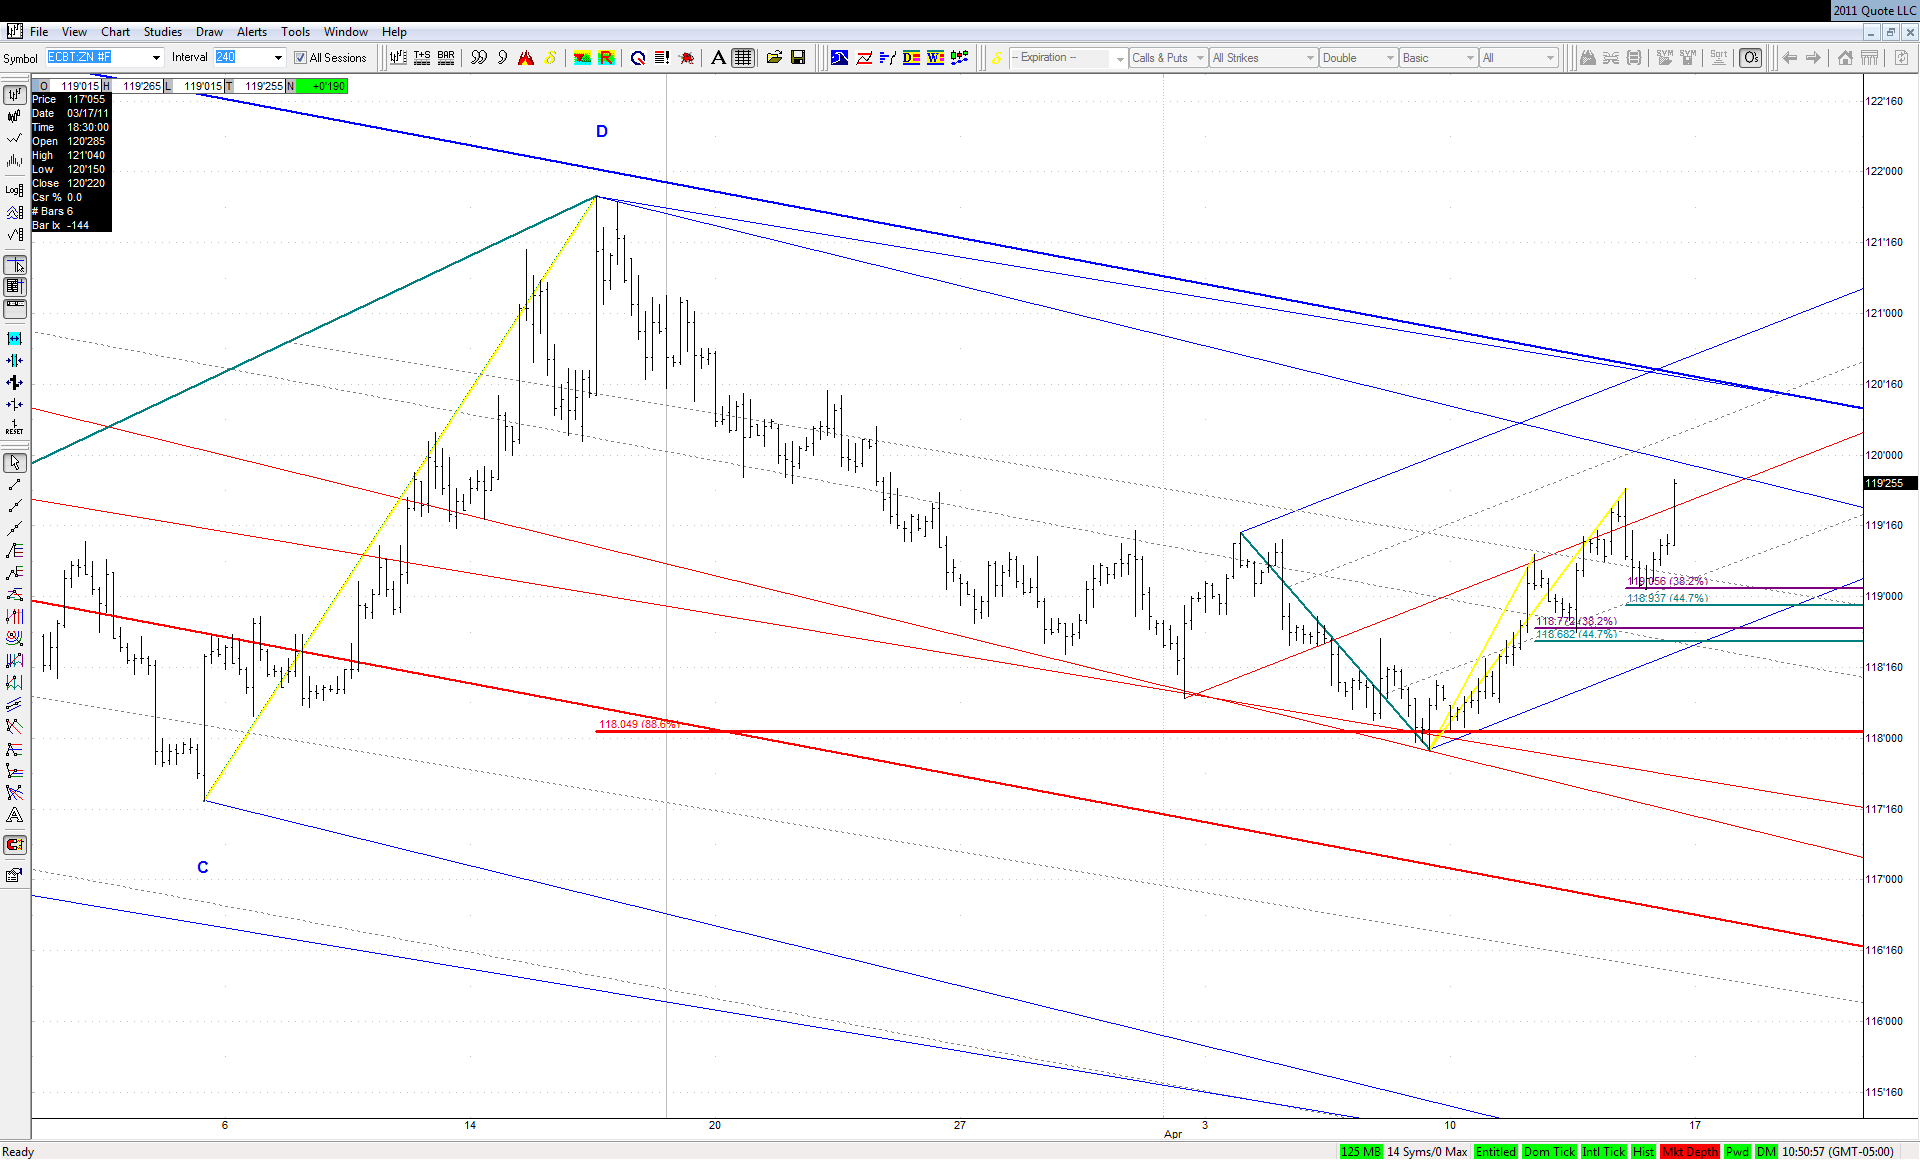
This is as close to free money in Bonds as one can get:

Click image for original size


And this is just the beginning IMO.
Jim - you were supposed to post your version of this story

JI
jimkane
Rep: 3,058
Posts: 33,089
No, it can only go up. It has to go up. "Get those brokers back in here. Turn those machines back on!!!!" (from 'Trading Places'). As I just mentioned, I'll post a follow up comment on this one shortly.

Originally posted by rat89

now this is funny


Click image for original size

JI
jimkane
Rep: 3,058
Posts: 33,089
The ES all-sessions is a very clear bearish ABCD in here. But, one would have to be bearish the market to consider that pattern for a trade premise. Are you bearish in here? If the market intends to go up, then this would be more like a 'W3' here, in the acceleration phase. What's the premise? The premise filters the trades.
JI
jimkane
Rep: 3,058
Posts: 33,089
Really great charts today, crew.
JI
jimkane
Rep: 3,058
Posts: 33,089
Gold looks to be making its next assault on another new high.
JI
jimkane
Rep: 3,058
Posts: 33,089
And there's the new all-time high for gold.
AL
albert
Rep: 99
Posts: 3,094
Here are some charts. I am really knocked out by the charts and comments I see here.

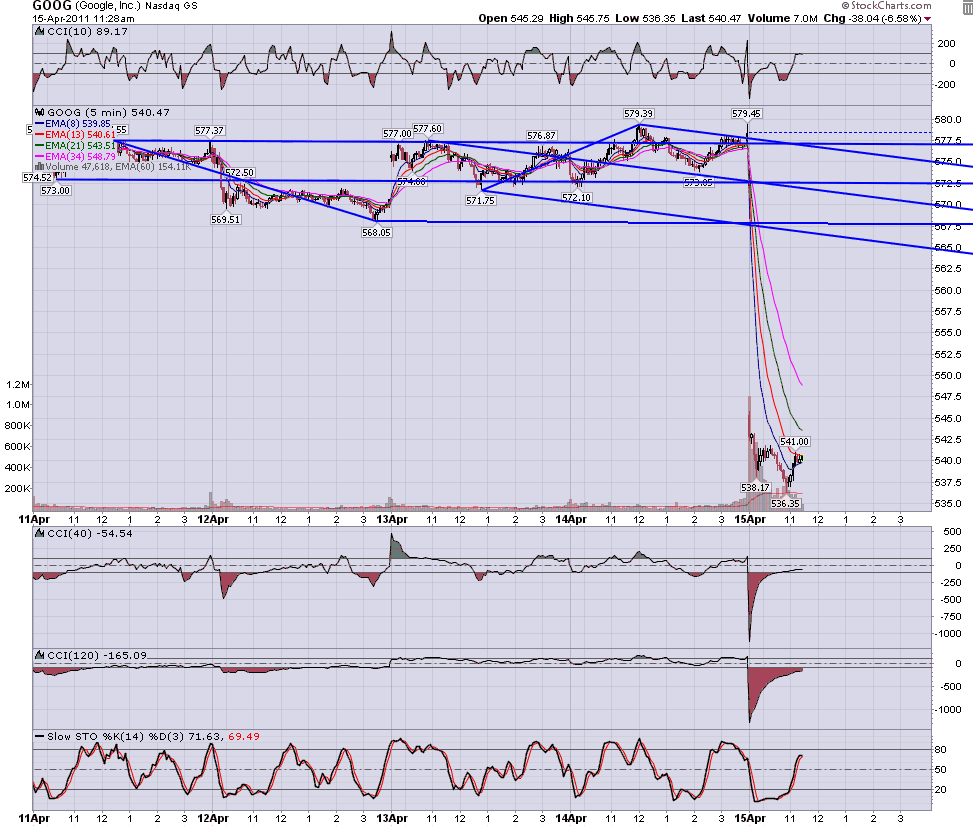
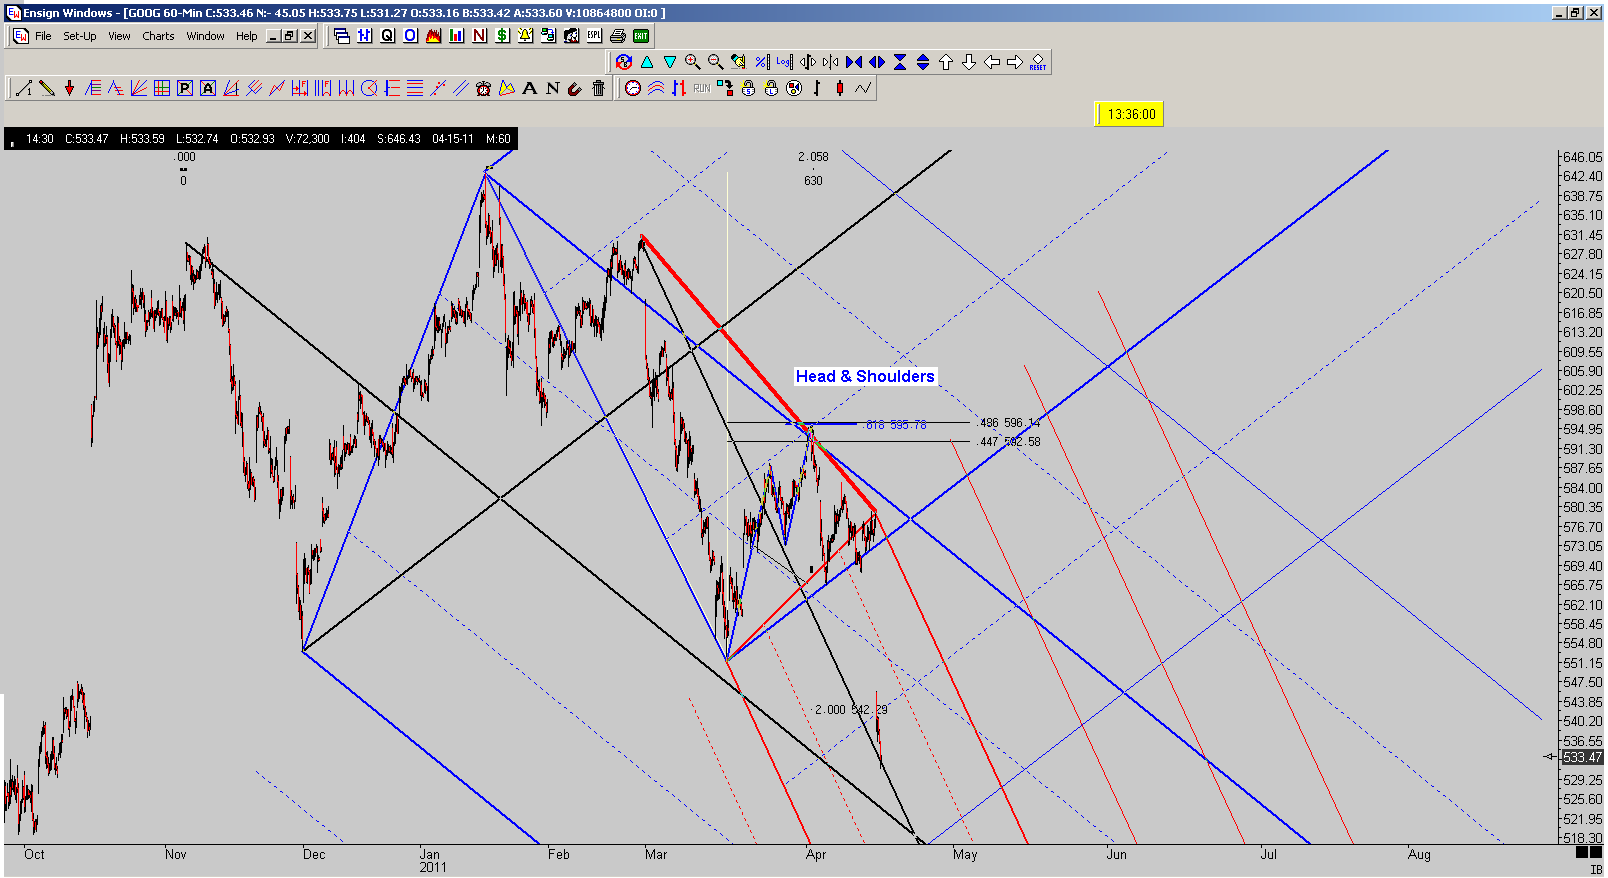
Google: I wish I had shorted Google stock a week or two ago!

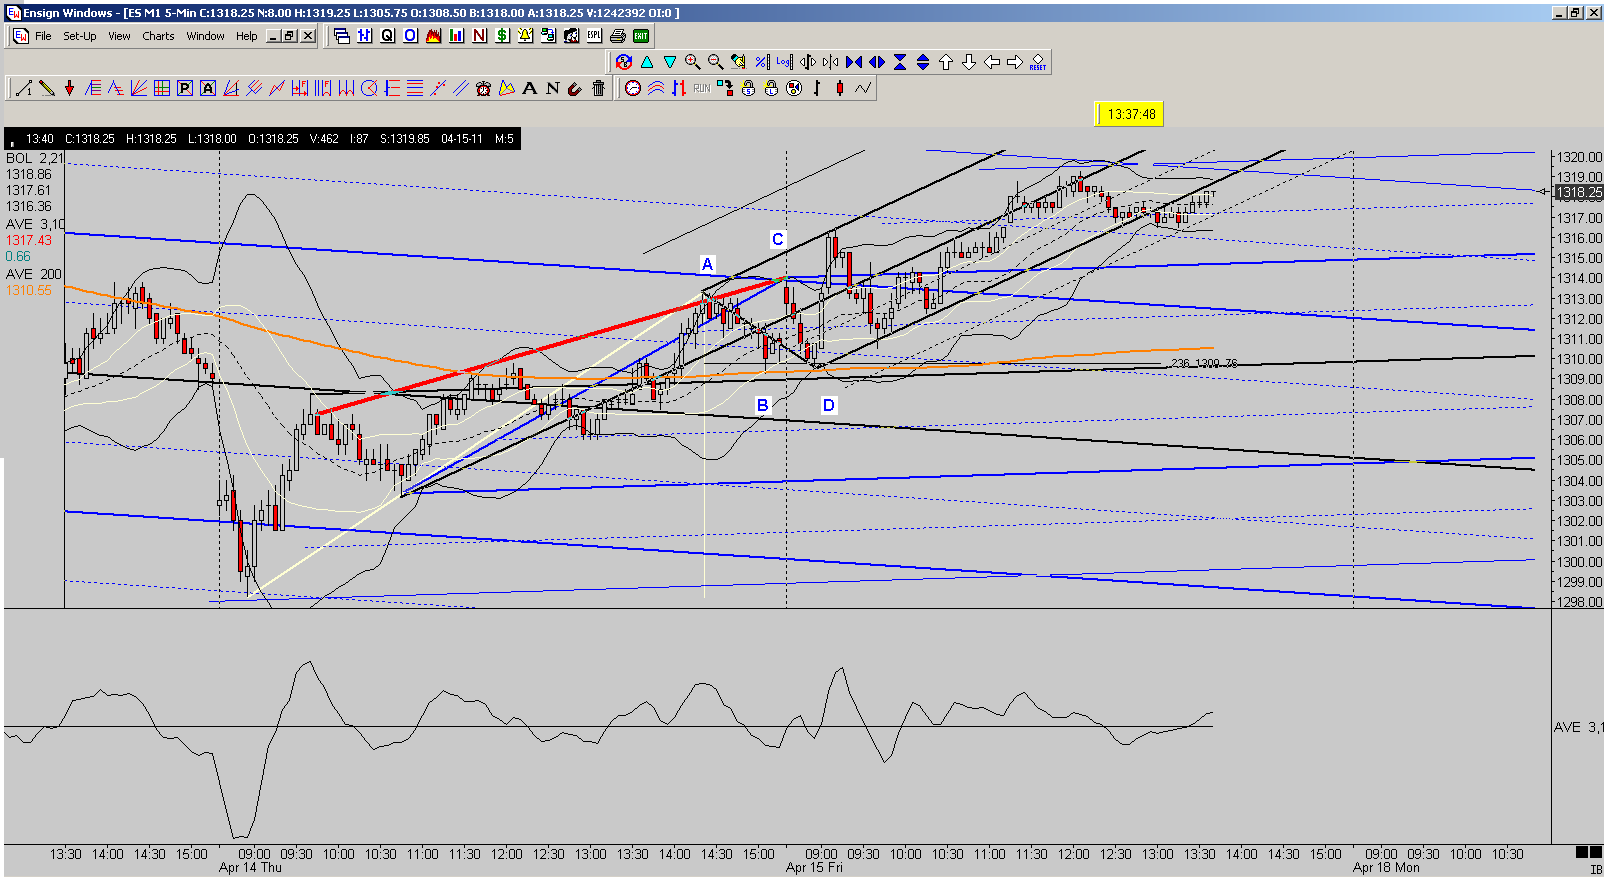
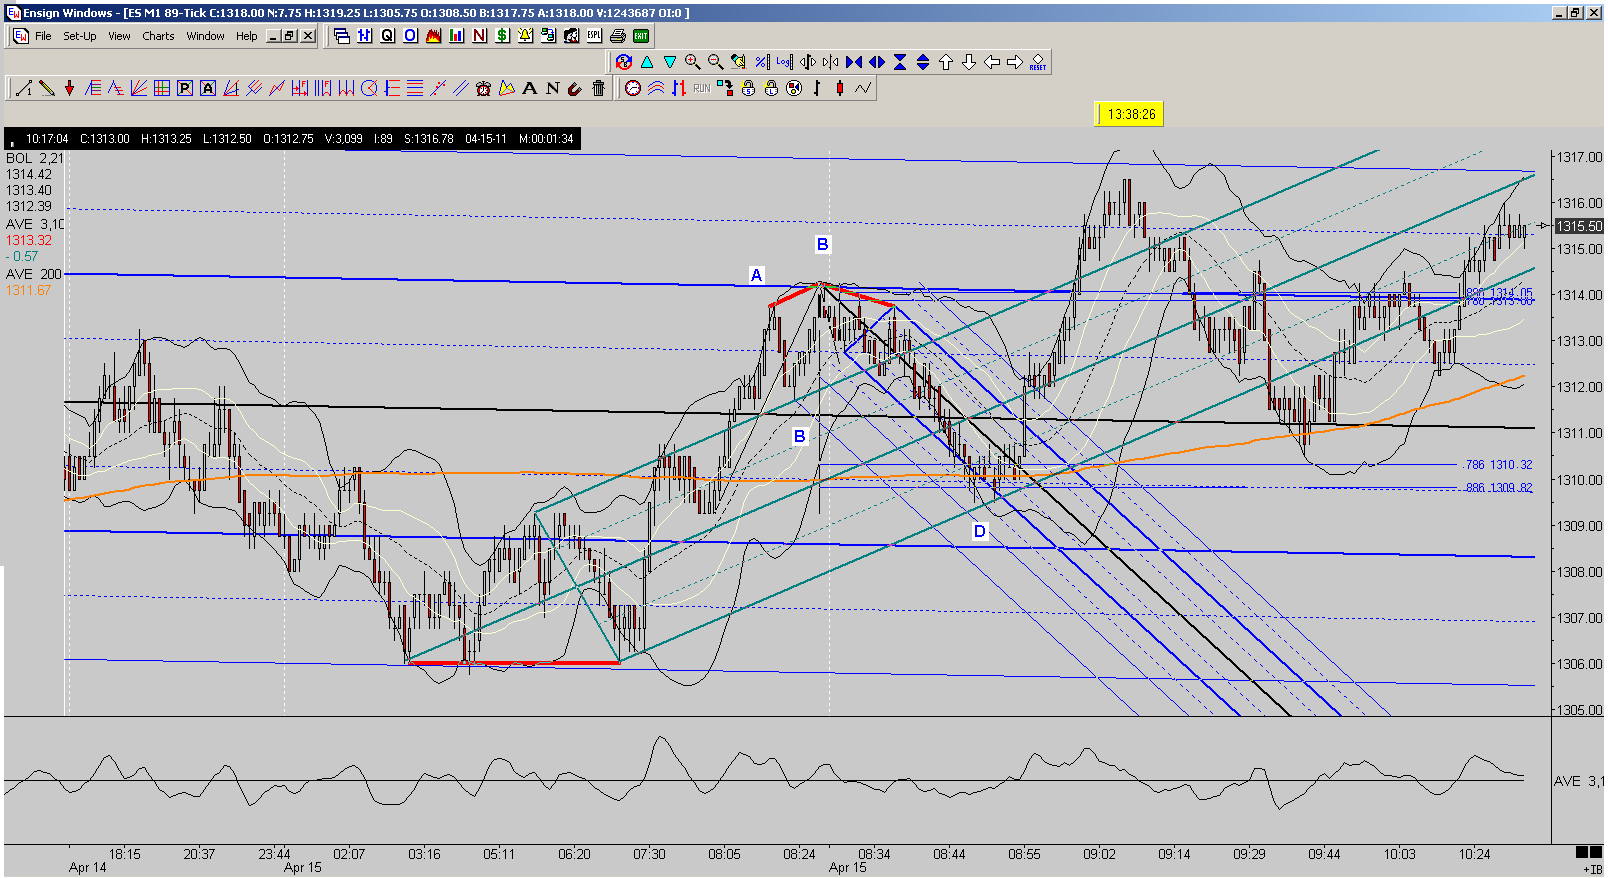
ES M1: Kane ABCDs at the OPEN: 5 Minute, Kane TD ABCD completing at 0.236 fibo.
89 Tick GLOBEX, This looks like a Kane DT ABCD with a long tail completing at 1.902 fibo, 0.886 fibo, and confluence of lower ML //, completing at 0.564 fibo. I am trying to address differences in "views" on 5 minute RTH and 5 minute GLOBEX and various GLOBEX tick charts and integrate them in my thinking.

Comments welcome.

Good Trading,

Al Kamego

Click image for original size

Click image for original size

Click image for original size
JI
jimkane
Rep: 3,058
Posts: 33,089
Watch this bullish 3-min ABCD in the ES here for clues. Big bearish ABCD, small bullish ABCD. Now we see.
JA
jarek
Rep: 94
Posts: 3,474
Originally posted by jimkane

... so the Gross post will be short...


I see that we have a new definition of "short"