CME Euro FX Futures 6E
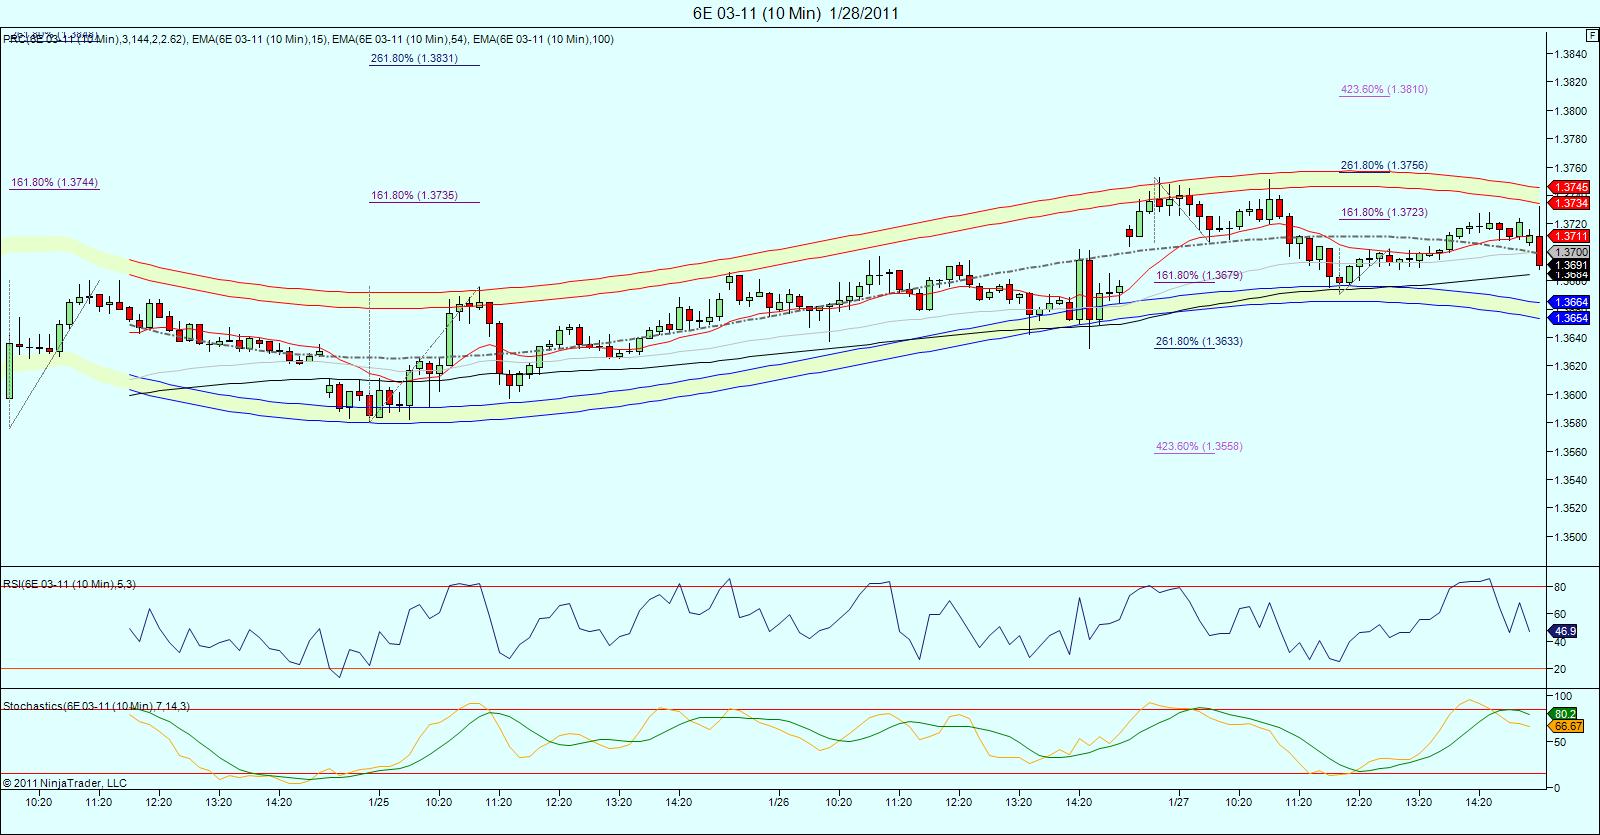
Red, sorry ,i was already asleep when you posted!.. I haven't had much time to look at it, but the daily chart indicates 1.3826 coming. Cycles are not very clear.... here's a real short term peak (10 min chart).. id be buying anywhere around the lower prc band...
Click image for original size
Well, shuh!
Originally posted by koolblue
Bingo!.. am i a genius ,or what?...lol
lol... at least for one brief moment in time!...
Hey, I'd say you've achieved even more than your '15 minutes of fame', so you are ahead of the game, my friend.
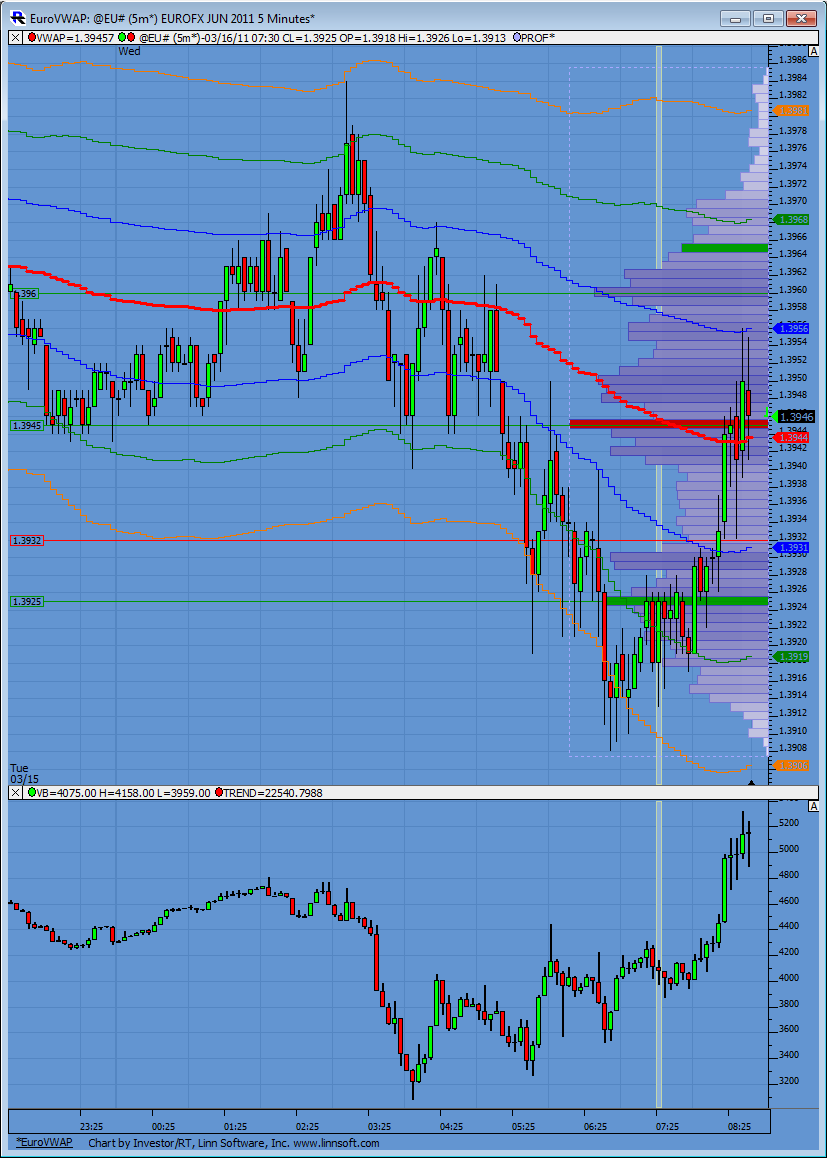
Notice the series of divergences on the CD as prices kept making new lows. Now watching to see if prices find support on VWAP and volume continues to come in.
Click image for original size
Click image for original size
Well we got 1.3848 .. pretty dam close so far!!!
Originally posted by redsixspeed
Originally posted by redsixspeed
I was looking for 1.386/1.388 .. the post is at this link:
http://www.mypivots.com/board/topic/6372/3/es-short-term-trading-01-27-2011
but I look for the mean so 1.387 is what I wanted .. we got to 1.3856
if we close below 1.3564 I will lose hope of getting to 1.387 at least for now
==================================================================
6e getting close to that 1.387 again .. maby hit it this time ..
I think this area is decision time for more up or the beginning
of a pull back .. a daily close above 1.387 is bullish imho
=====================================================================
The more we stay above 1.387 the "bullisher" <- .. it gets.
on the daily we have a hanging man confirmed with a close below ..
that is bearish .. 6e has moved above that and that is bullish ..
a close above the bear signal would give strength to more up
that is bearish .. 6e has moved above that and that is bullish ..
a close above the bear signal would give strength to more up
Originally posted by redsixspeed
1.387 is a key # for me the next # above that is 1.412 .. I look for
the mean = 1.3995 which is @ 1.400 that some are saying is resistance.
Resistance doesn't mean reversal ..
======================================================================
1.412 ..
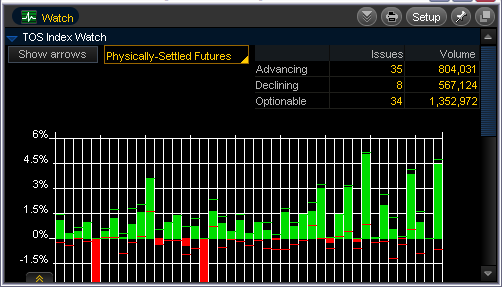
the two red are from the Japan market:
Click image for original size
- Page(s):
- 33
- 34
- 35
- 36
- 37
- 38
- 39
- 40
- 41
- 42
- 43
- 44
- 45
- 46
- 47
- 48
- 49
- 50
- 51
- 52
- 53
- 54
- 55
- 56
- 57
- 58
- 59
- 60
- 61
- 62
- 63
- 64
- 65
- 66
- 67
- 68
- 69
At $85 billion/month, it cost Bernanke a little over $1 million for each job created last month. Well done, professor. -Tim Knight
Emini Day Trading /
Daily Notes /
Forecast /
Economic Events /
Search /
Terms and Conditions /
Disclaimer /
Books /
Online Books /
Site Map /
Contact /
Privacy Policy /
Links /
About /
Day Trading Forum /
Investment Calculators /
Pivot Point Calculator /
Market Profile Generator /
Fibonacci Calculator /
Mailing List /
Advertise Here /
Articles /
Financial Terms /
Brokers /
Software /
Holidays /
Stock Split Calendar /
Mortgage Calculator /
Donate
Copyright © 2004-2023, MyPivots. All rights reserved.
Copyright © 2004-2023, MyPivots. All rights reserved.