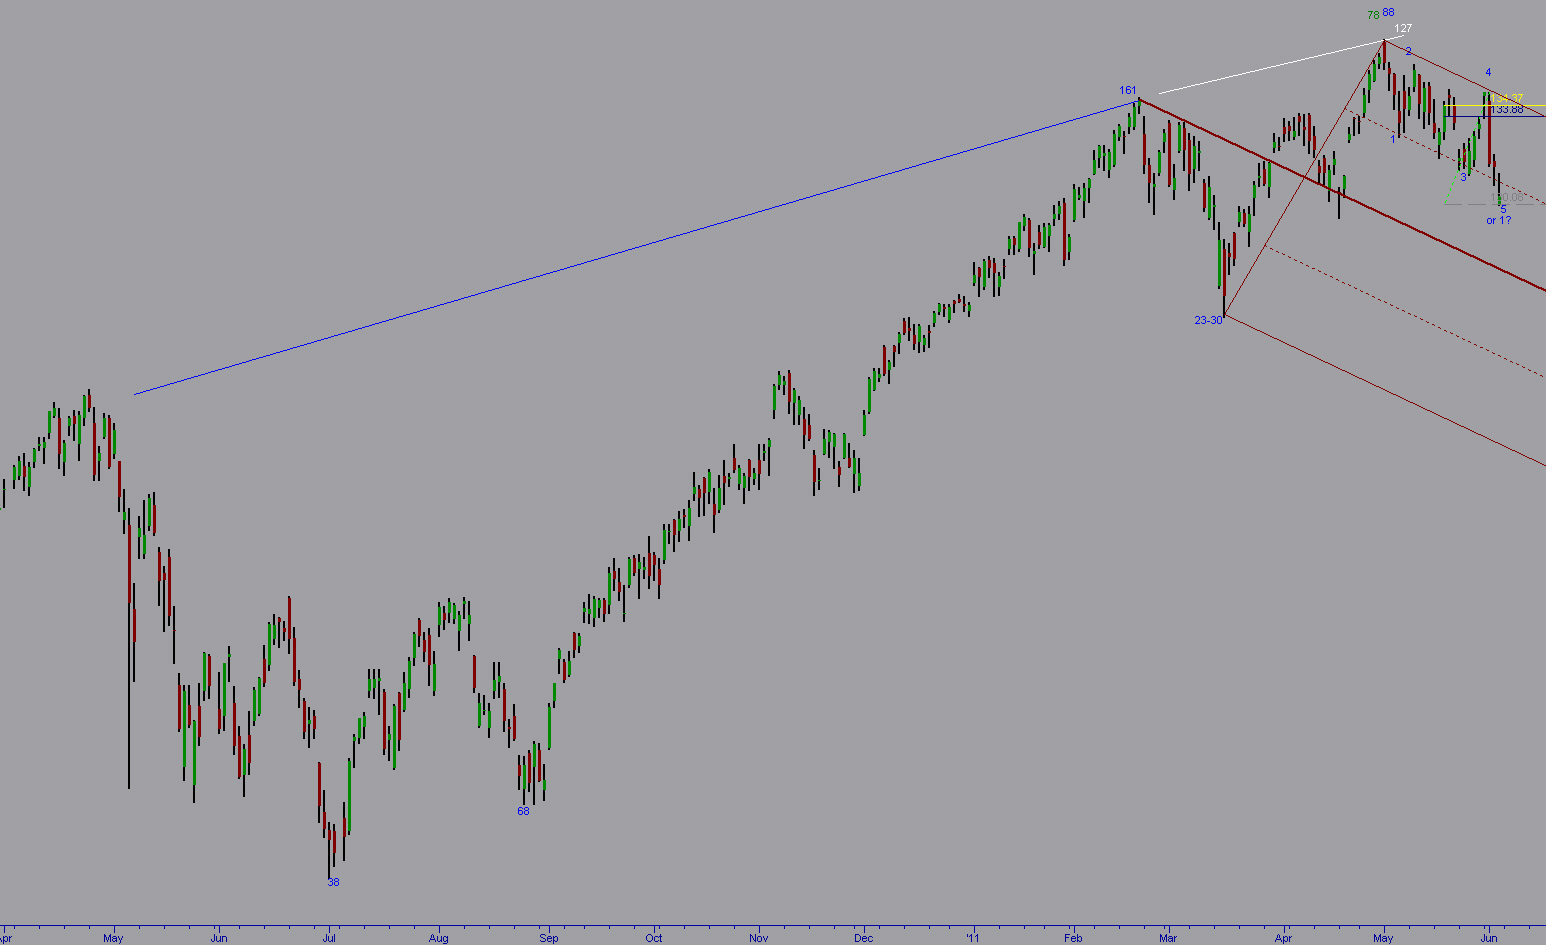
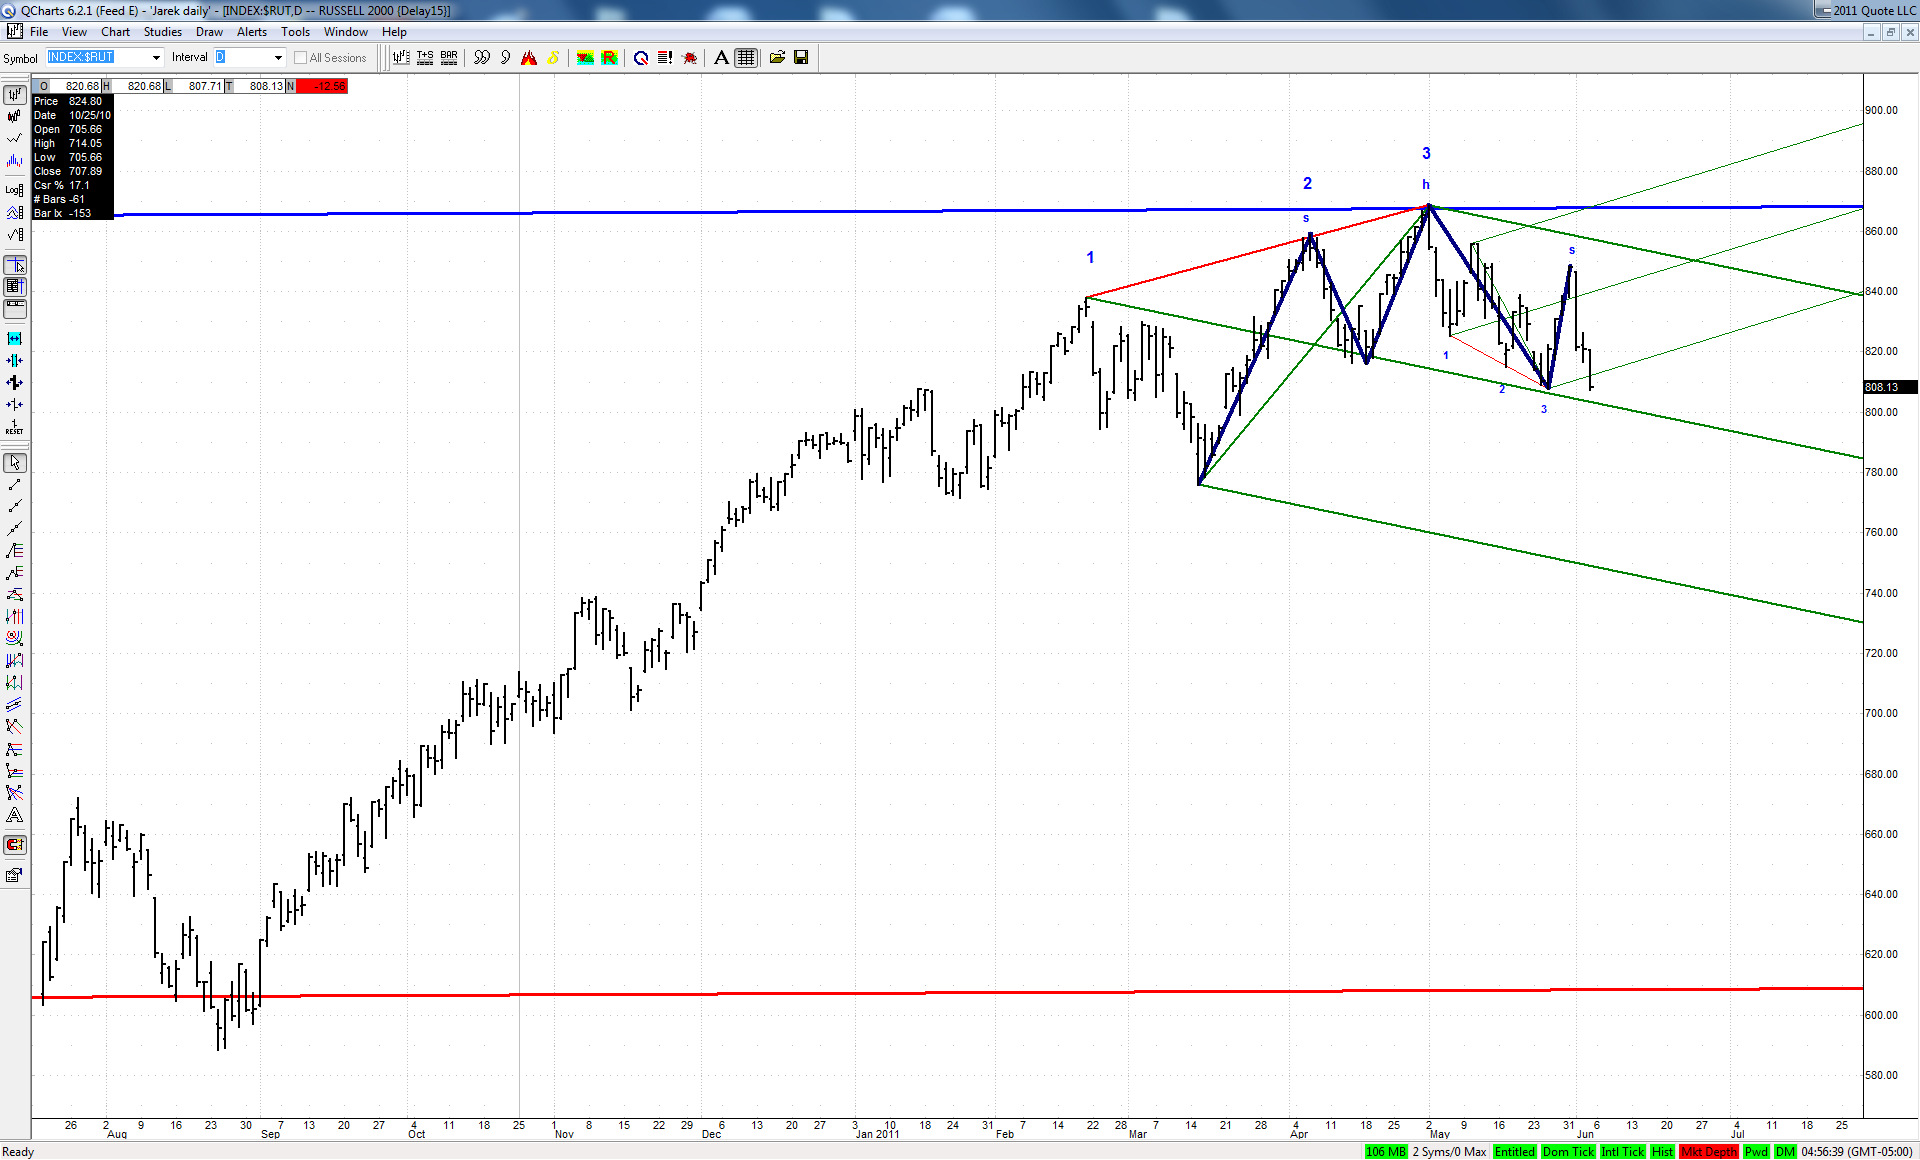
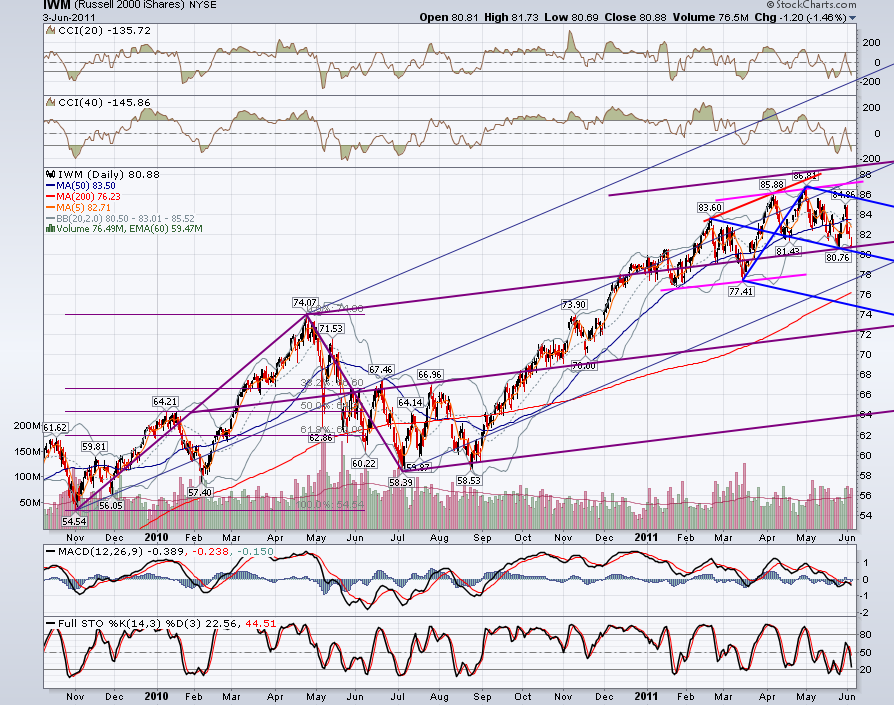
Jim suggested to take a look at daily charts of some secondary indexes and here is my current $RUT chart:
The green ML of a set based on big bearish 3D happens to be also a neckline of a classic head and shoulders. If bulls would not be able to defend this line next week, then a move to the lower ML should follow. This would also be a perfect fulfillment of a successful H&S pattern.
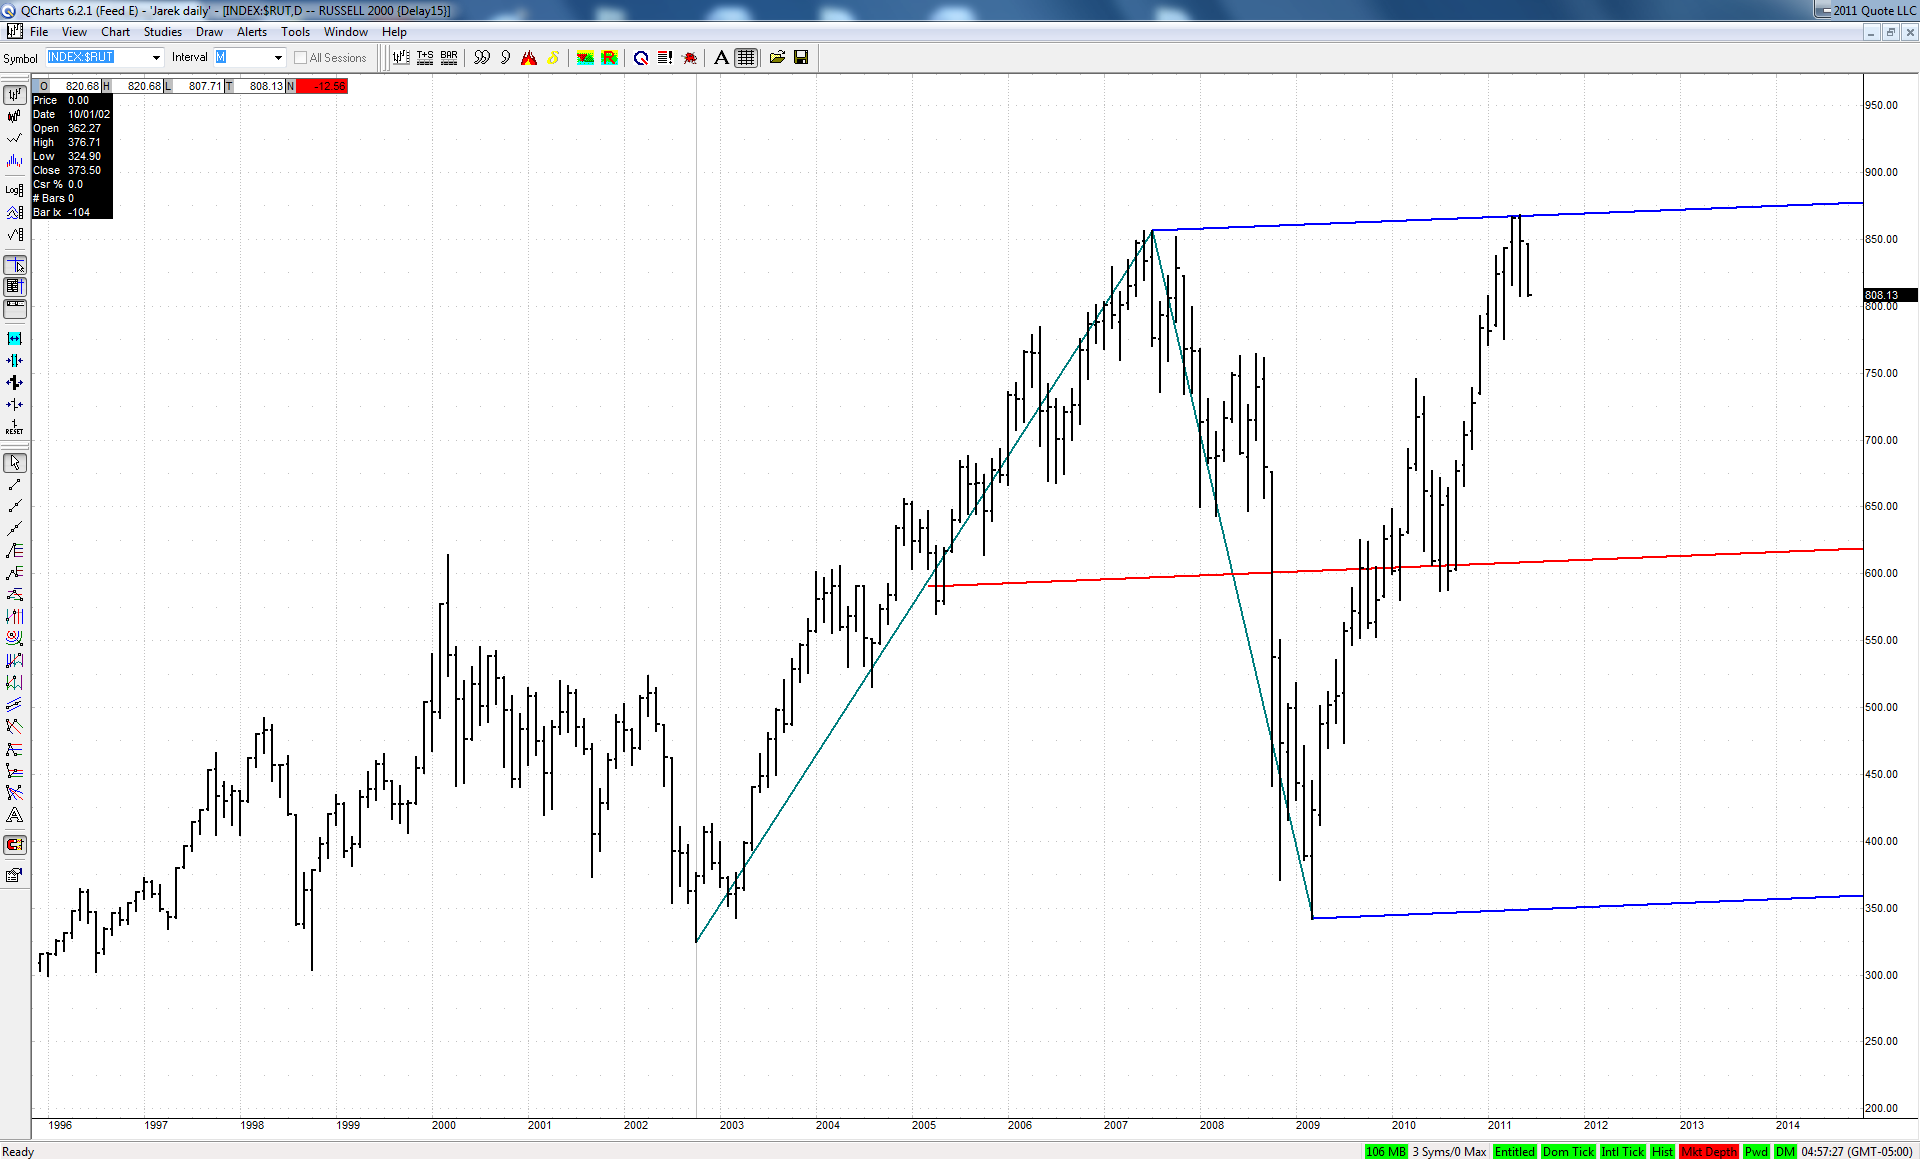
It is all the more interesting as this big bearish 3D fell dead on at the upper ML of a quite important set:
TX
tx_ches
Rep: -10
Posts: 514
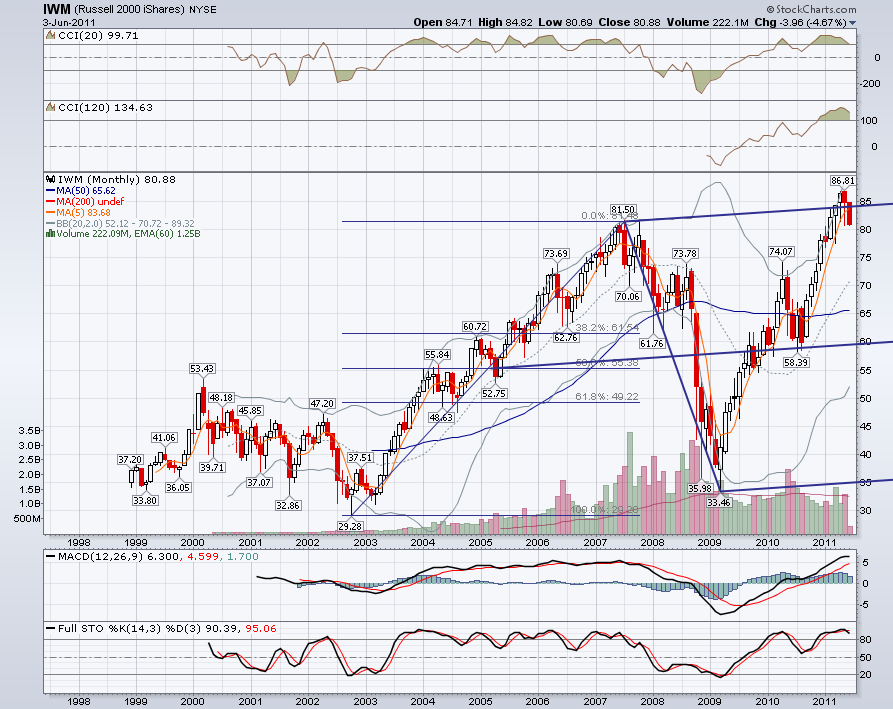
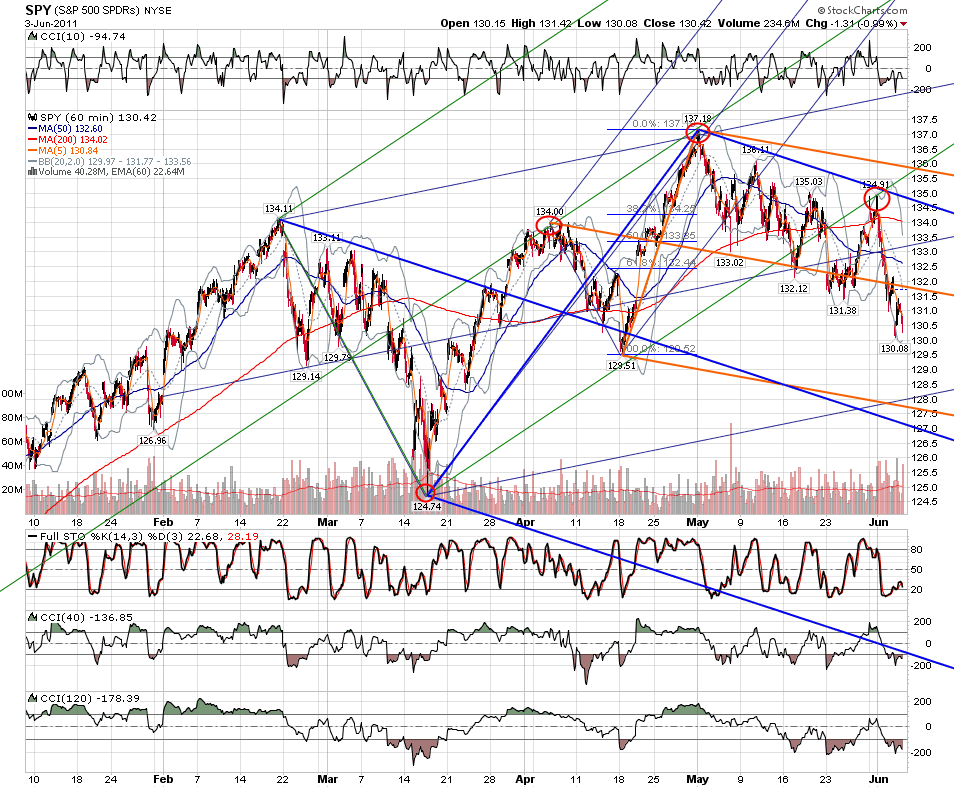
I looked at IWM for the Russell, MDY for the midcaps, and $TRAN index for the trannies, along with SPY.
They all have similar action on the daily's -- a series of lower highs and lower lows, giving them the look of rolling over that Jim mentioned.
But on the weekly timeframe, the down leg is barely noticeable. So no real damage done there.
I count 5 pivots in the down leg so time for a bounce? And I can certainly convince myself that the down leg has formed both a bear ABCD whose D is the last swing high and a bull ABCD with Friday's bar as its D.
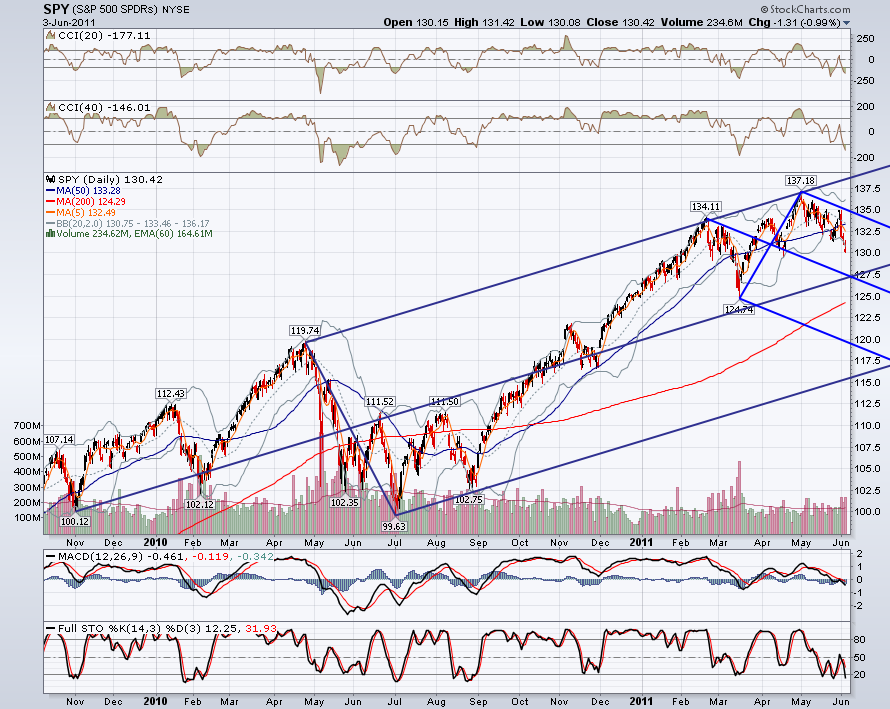
Spy Daily with lines marked for a retrace up to 78% or 88%. If it is a bear abcd that will continue, then the last swing leg down might be a wave 1 and a wave 2 could bounce up to the 78-88 zone which may intersect with a downsloping line.
For the hypothesis of a bull abcd, then the correction may end soon and on to higher highs.
Only the market knows.
TX
tx_ches
Rep: -10
Posts: 514
I'm pondering this second chance at this bull abcd on TNA (small cap bull 3x shares).
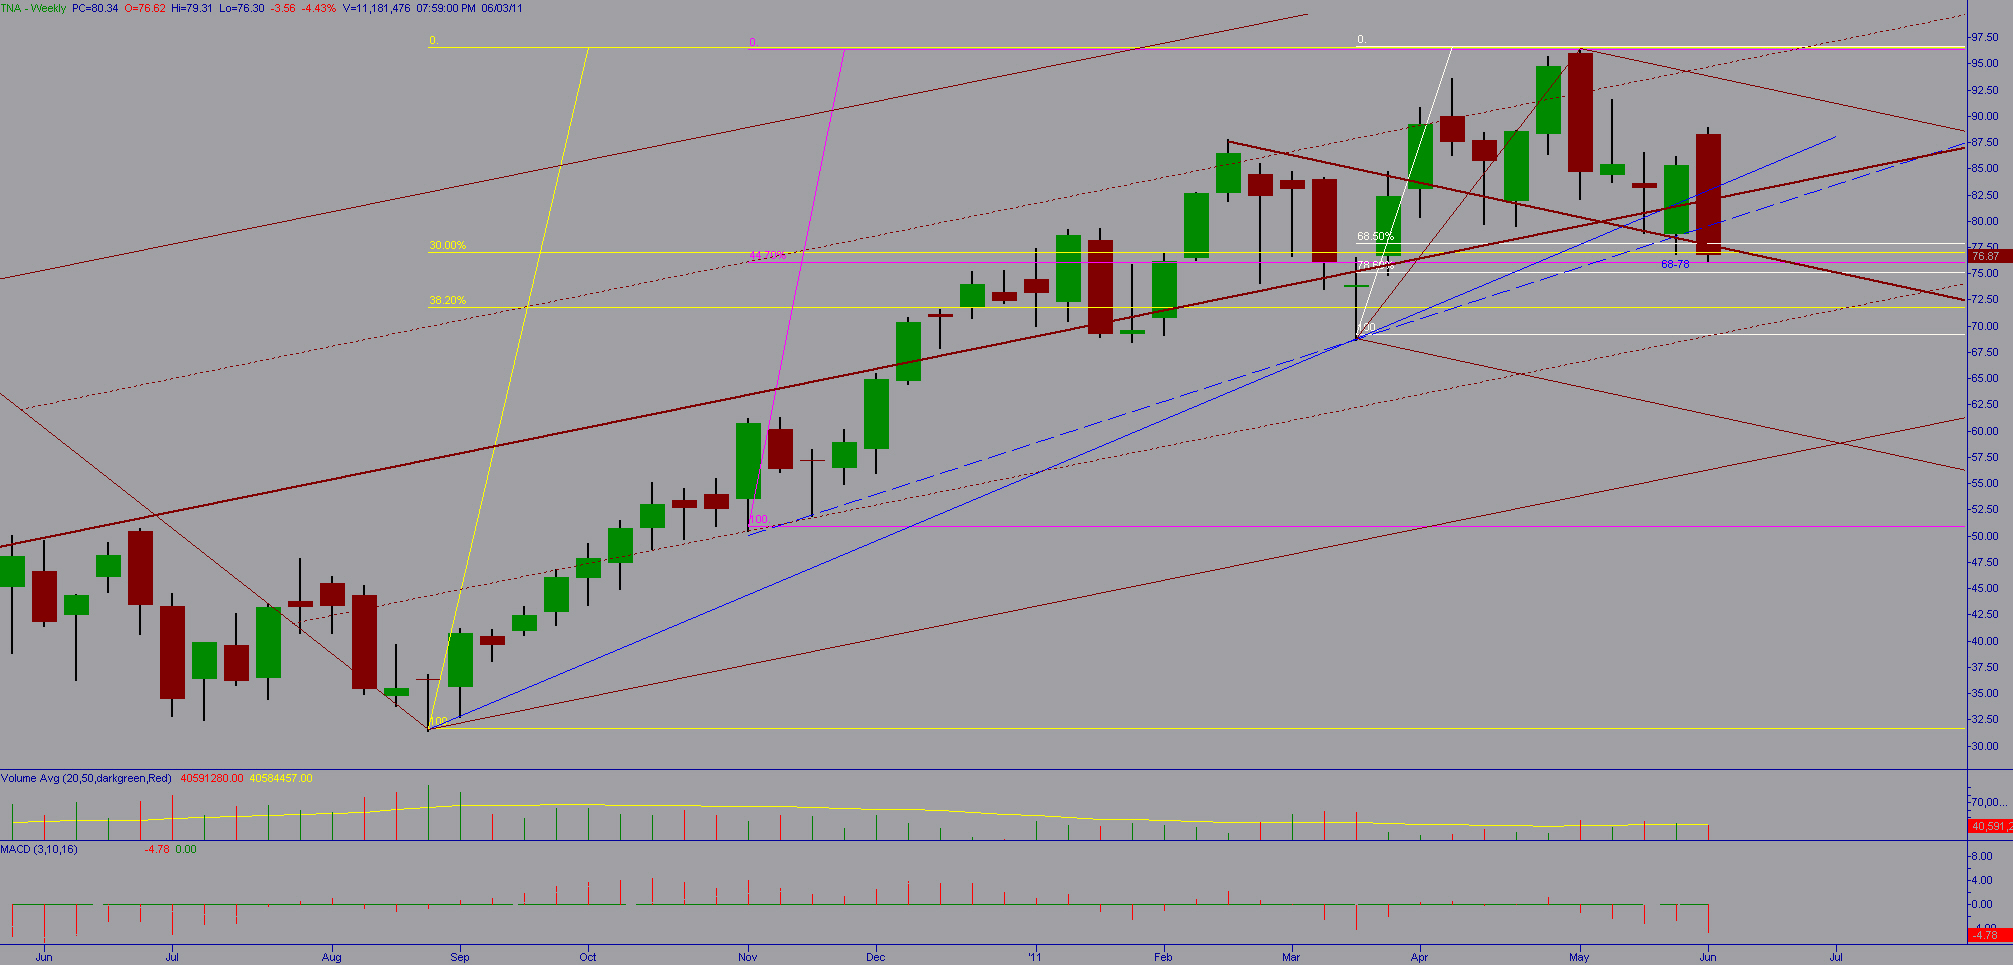
TNA weekly shows confluence in a KZ area with line.
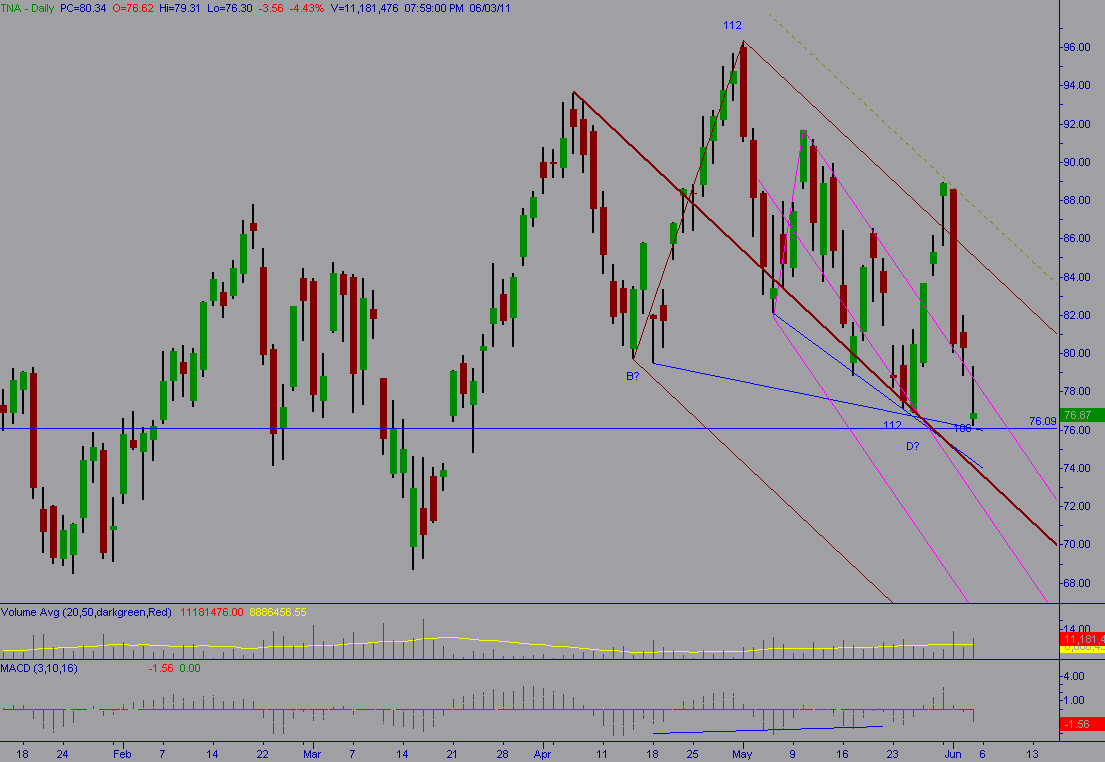
TNA daily shows a possible bull ABCD in that area. It shot up off the area and has now returned to it. Is this a second chance to take the ABCD? The structure of the legs is suspect -- BC is impulsive and CD is corrective. I'd need a high level of confirmation as my trigger.
Friday (added) seems to have spent the day forming another bull abcd with B and C at 78% and D at 127 of BC and almost an AB=CD.
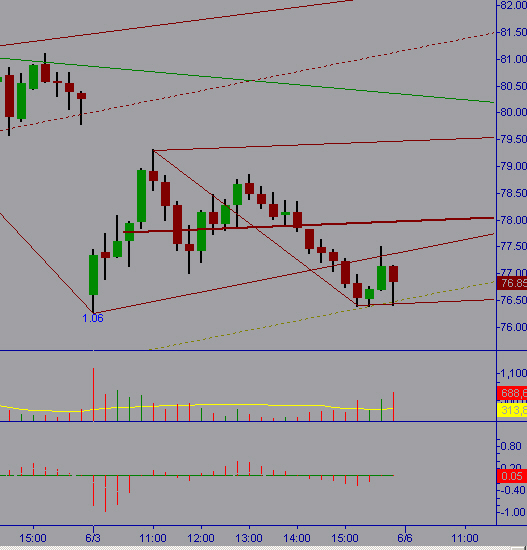
TNA 15 minute showing Friday's action.
TX
tx_ches
Rep: -10
Posts: 514
Hi, ISO,
Can you tell me what a timing high is? I haven't run across that before.
Originally posted by iso
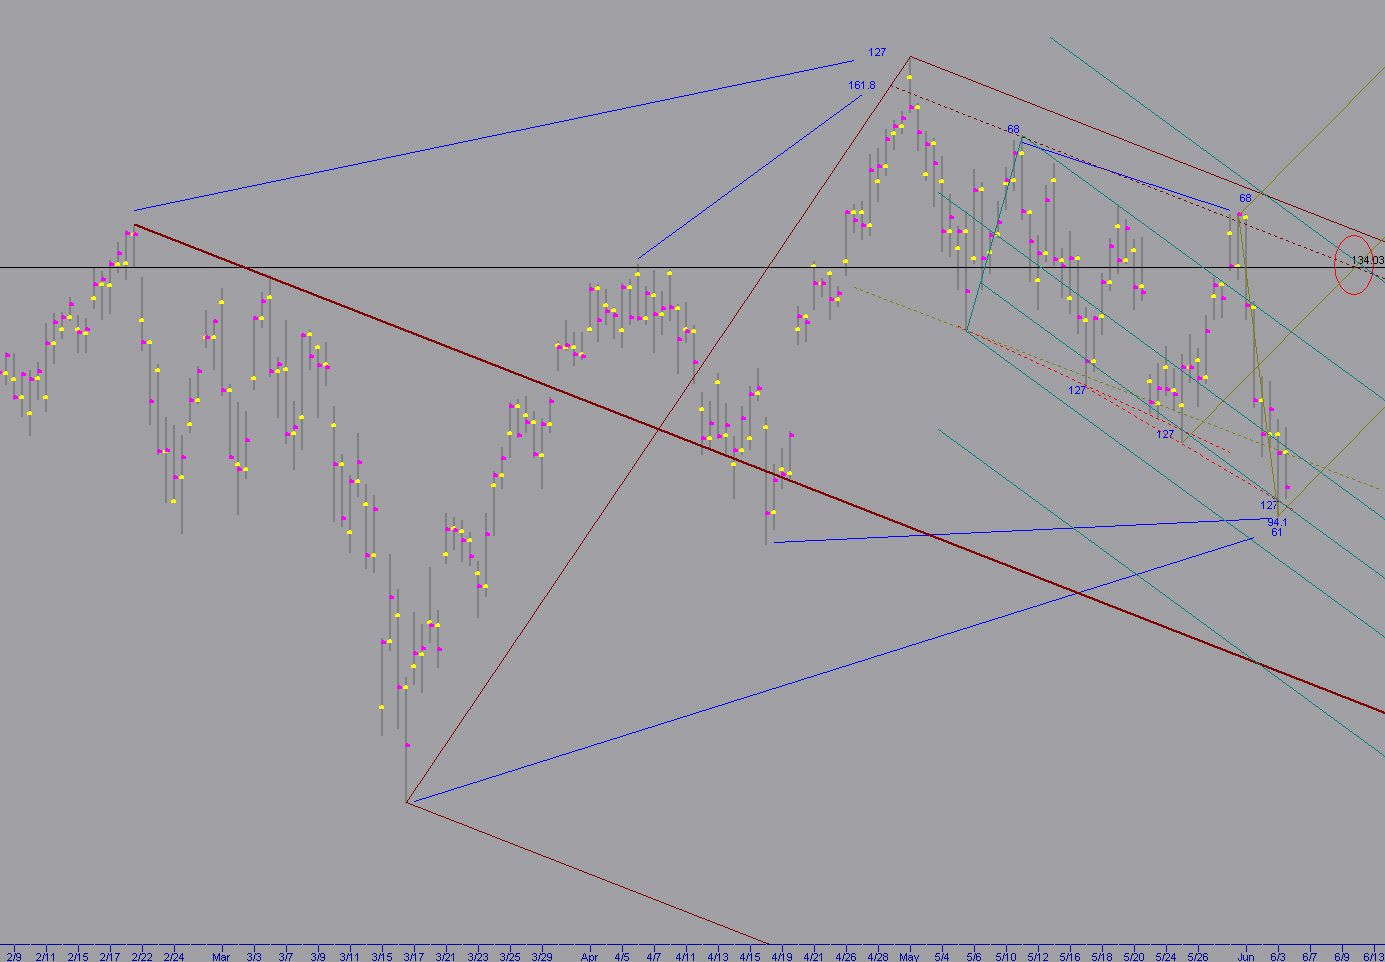
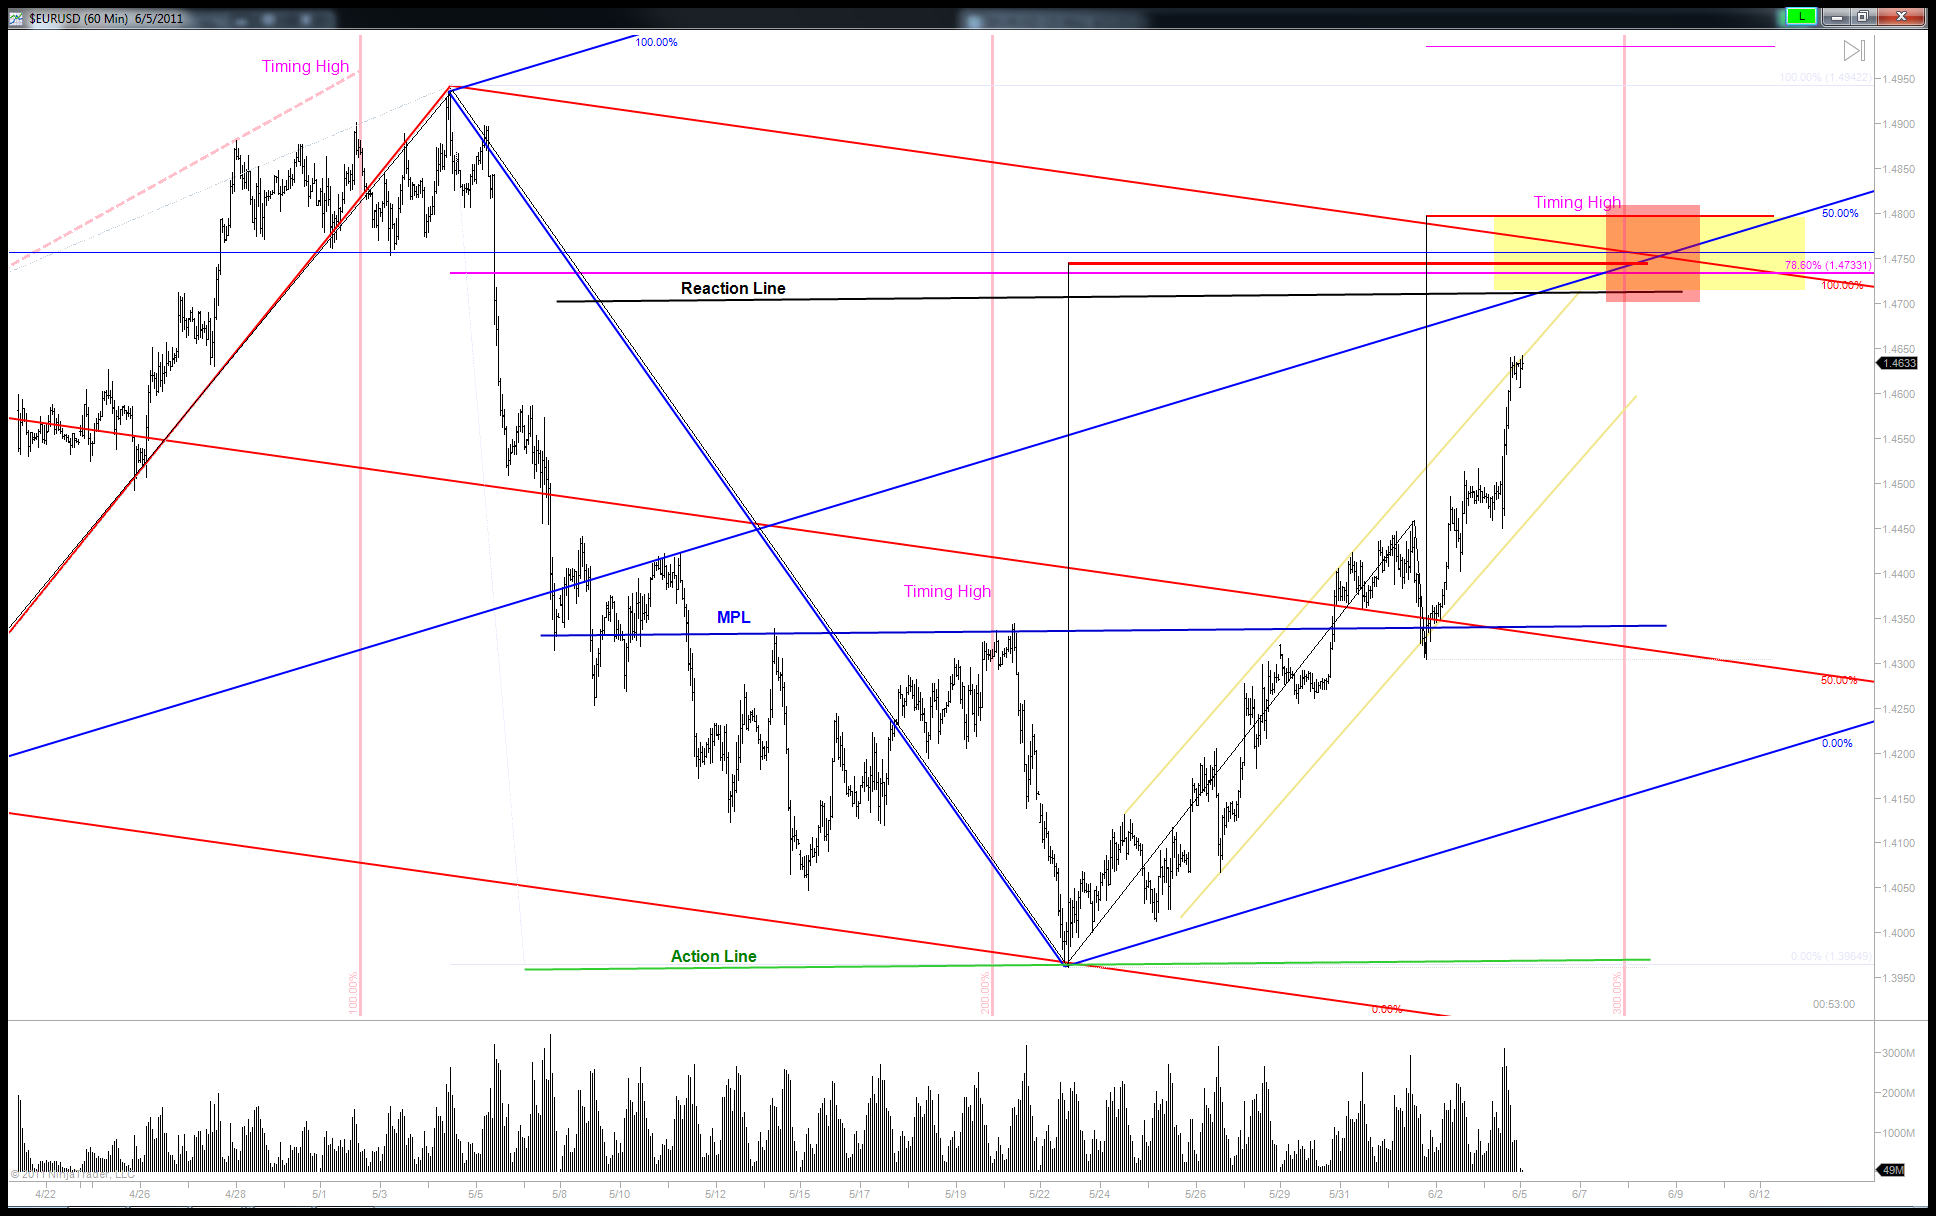
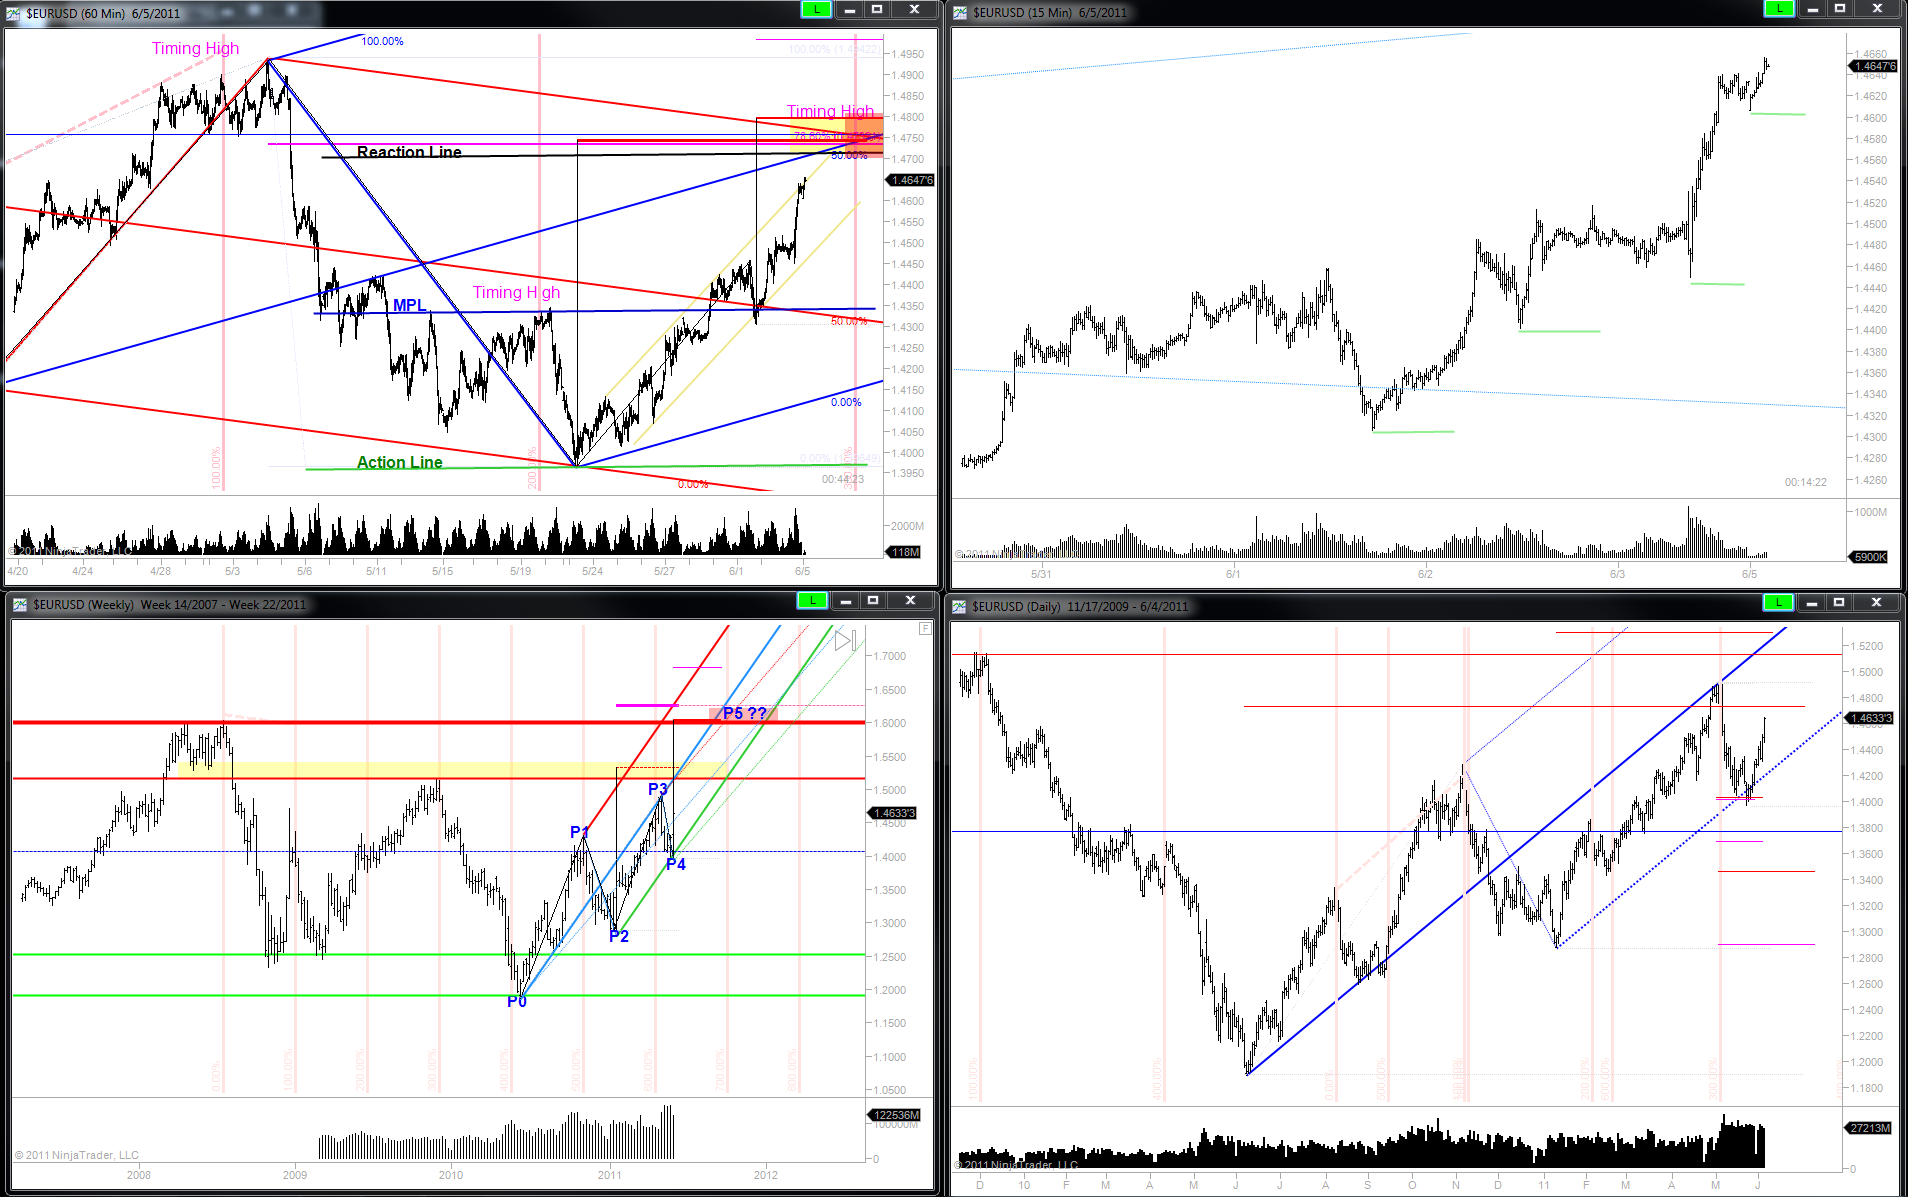
EURUSD work up, price and time 1.47-1.48 : 6/8 - 6/10
IS
iso
Rep: 0
Posts: 81
Much of the line work will have timing built into it. The timing lines on there, are a time measurement from one high to the next high projected out into the future. But you can see that the 2 median lines (the up and down) are creating an energy point that has price and time built into it.