MyPivots
Sign In
JA
jarek
Rep: 94
Posts: 3,474
Jim suggested to take a look at daily charts of some secondary indexes and here is my current $RUT chart:

Click image for original size
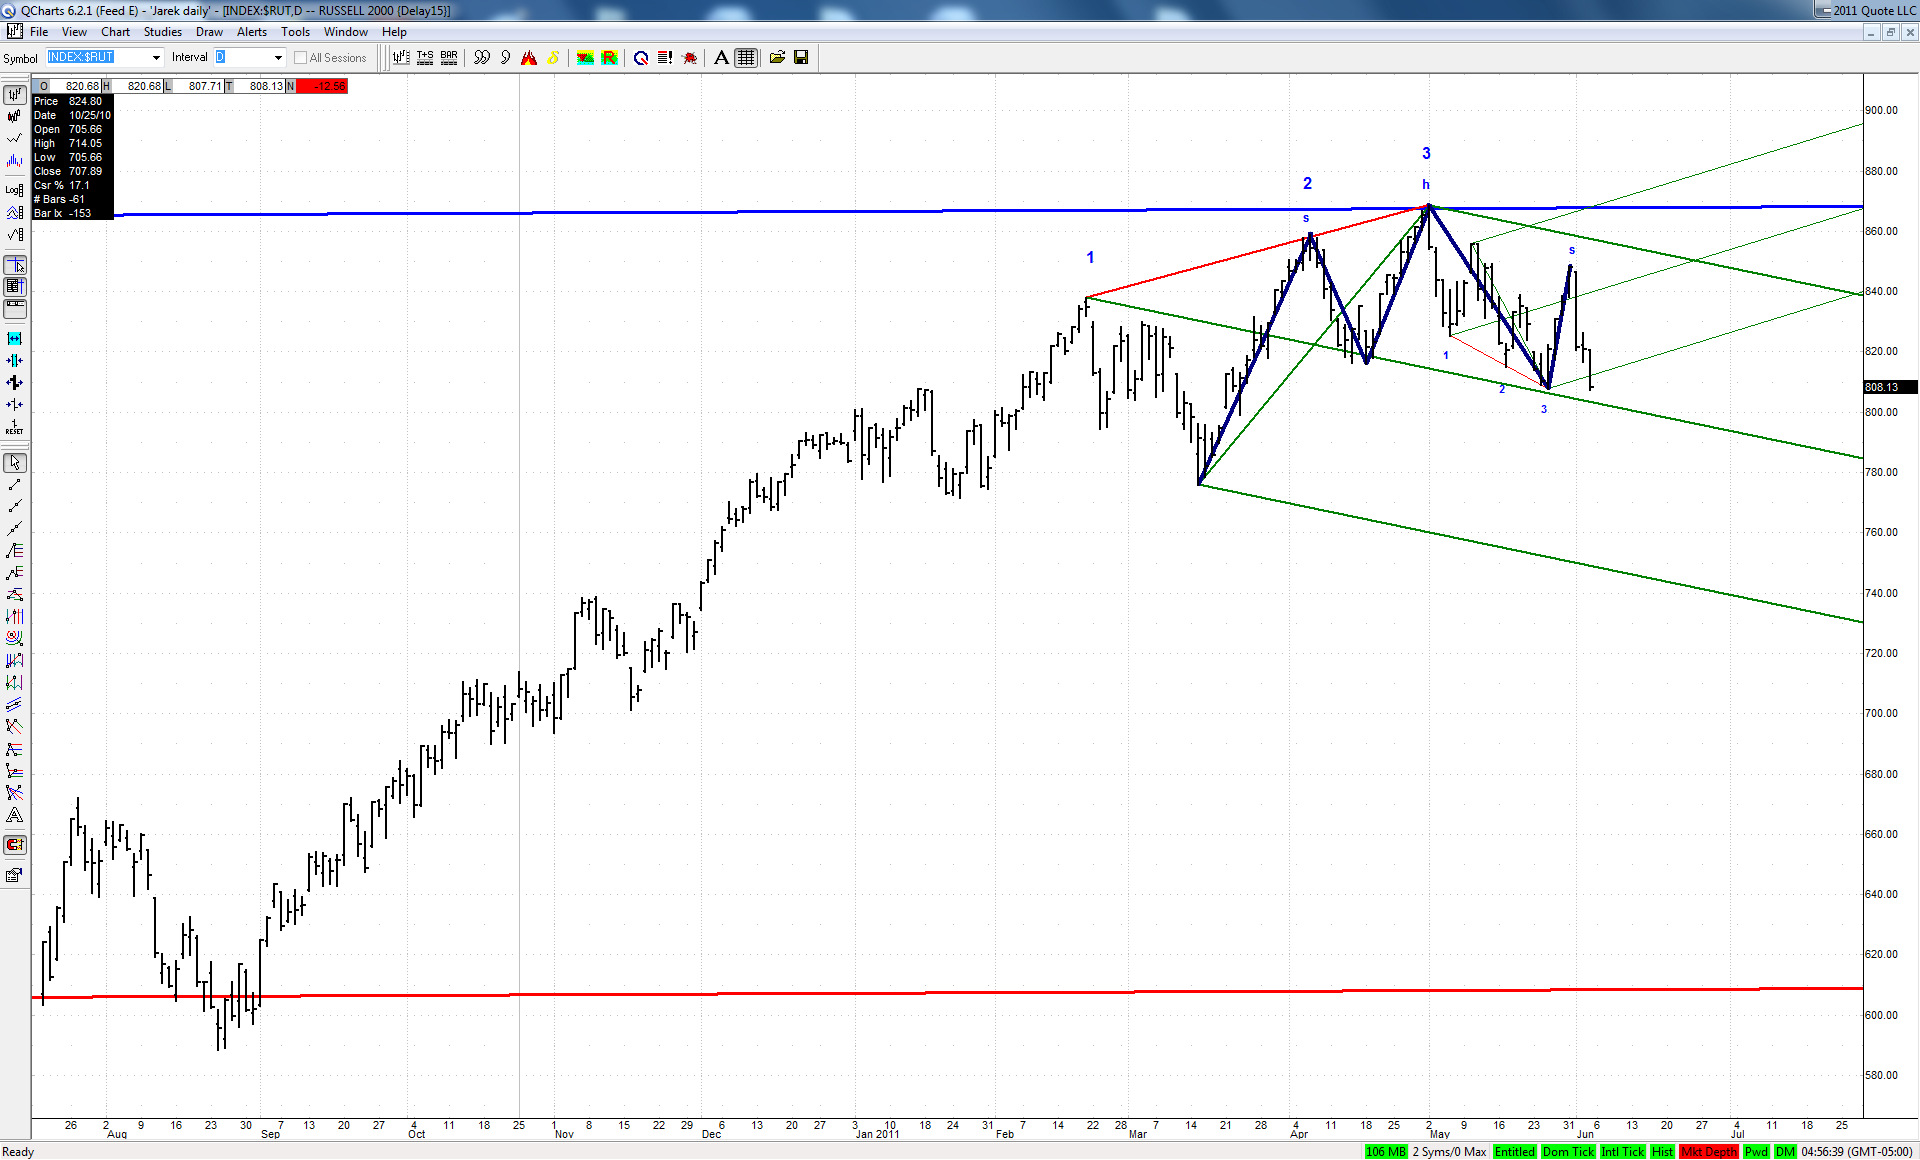

The green ML of a set based on big bearish 3D happens to be also a neckline of a classic head and shoulders. If bulls would not be able to defend this line next week, then a move to the lower ML should follow. This would also be a perfect fulfillment of a successful H&S pattern.
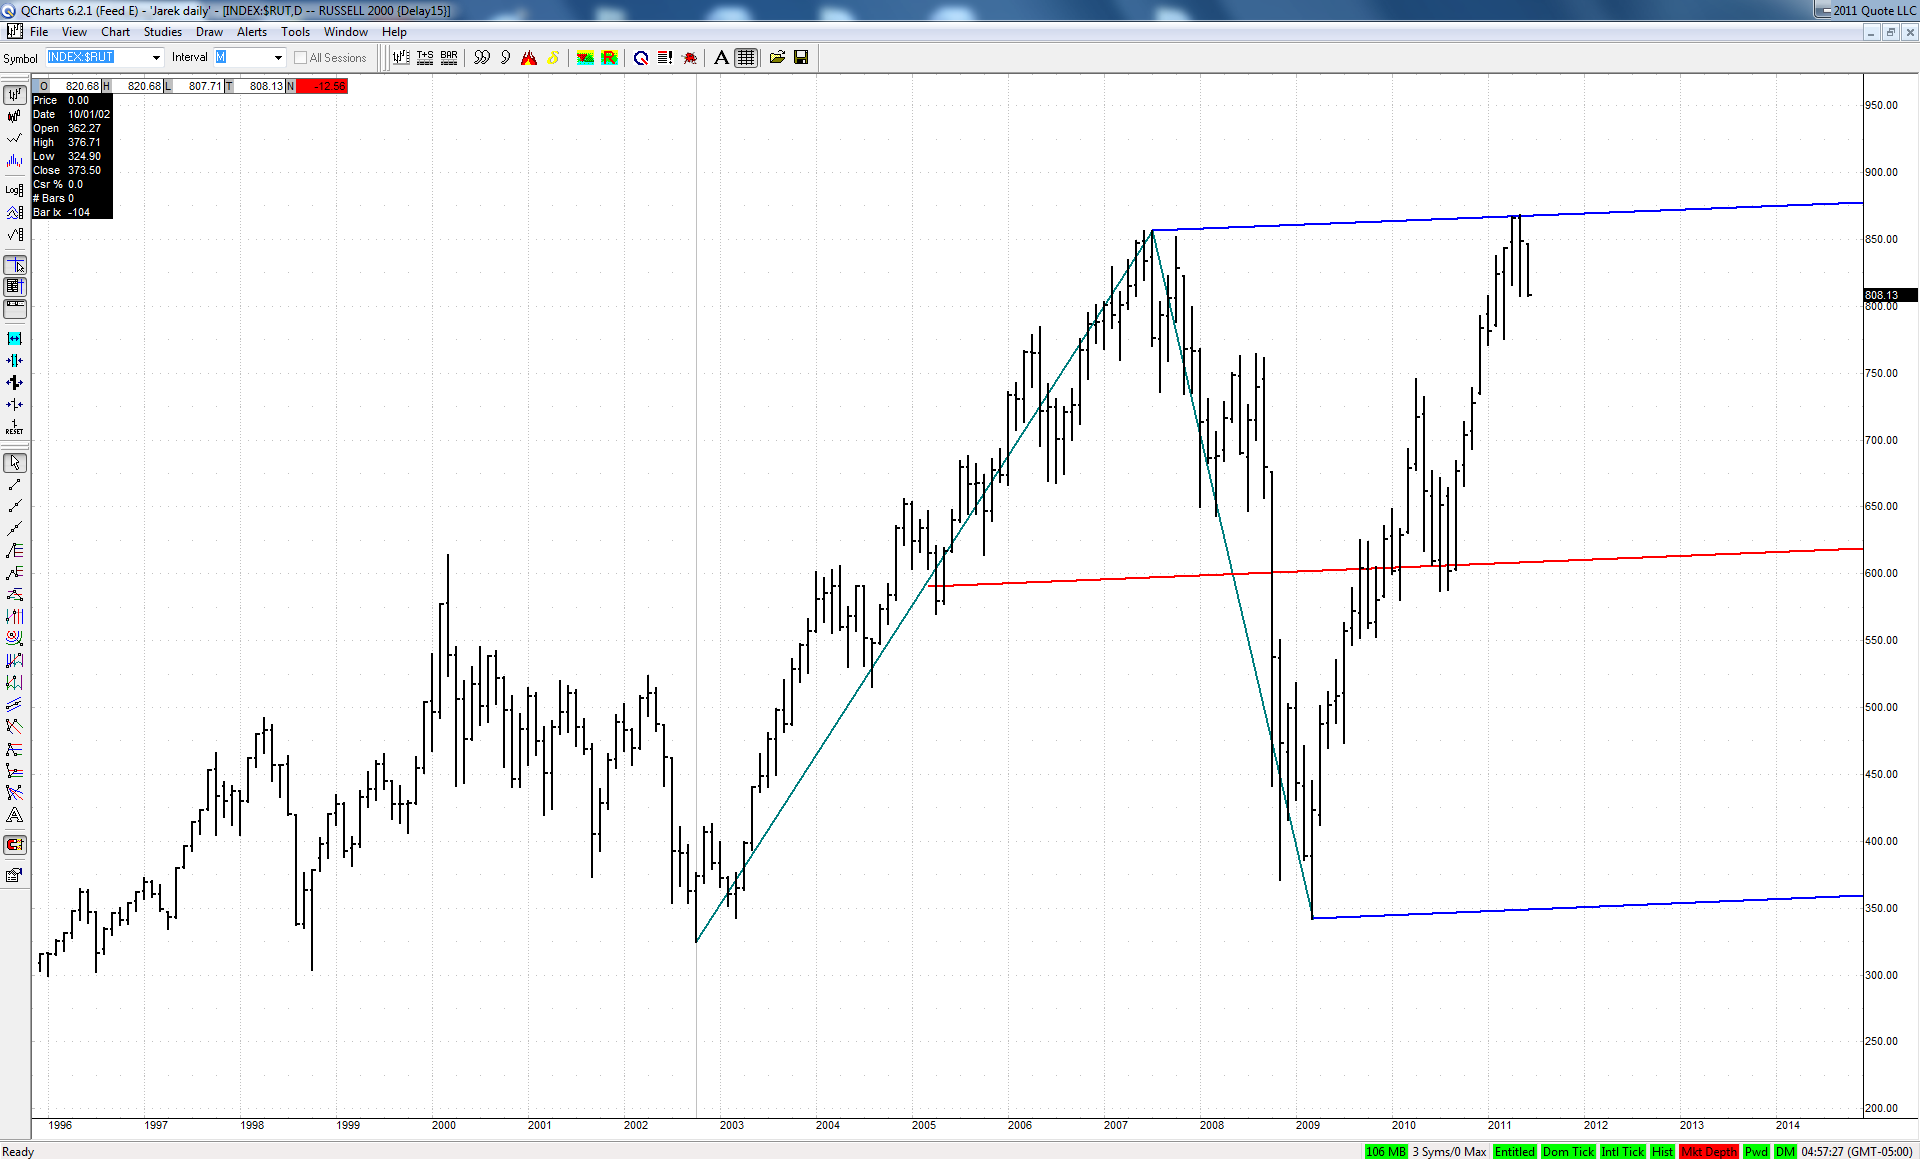
It is all the more interesting as this big bearish 3D fell dead on at the upper ML of a quite important set:

Click image for original size
JA
jarek
Rep: 94
Posts: 3,474
Will this bearish 3D at SL let it to the second area just above?

Click image for original size
TX
tx_ches
Rep: -10
Posts: 514
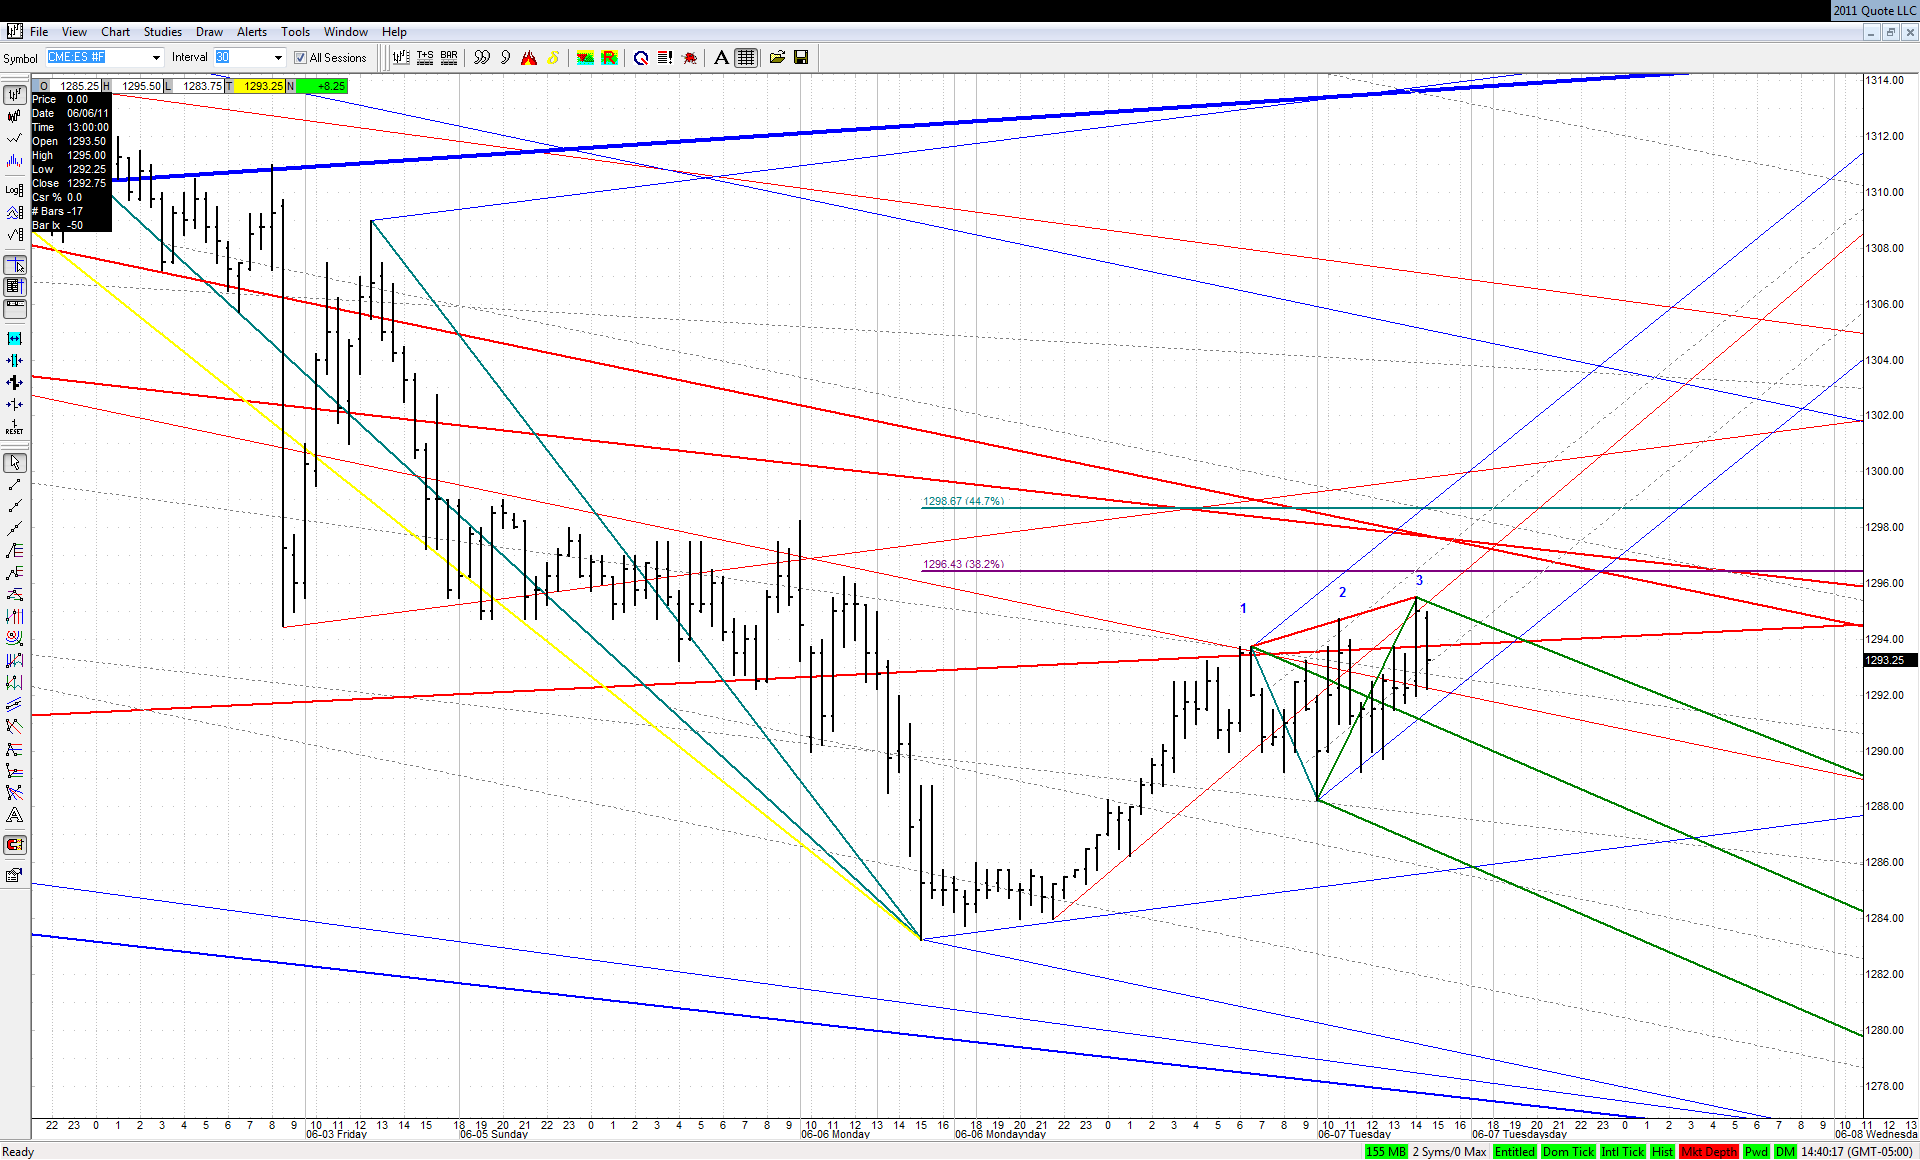
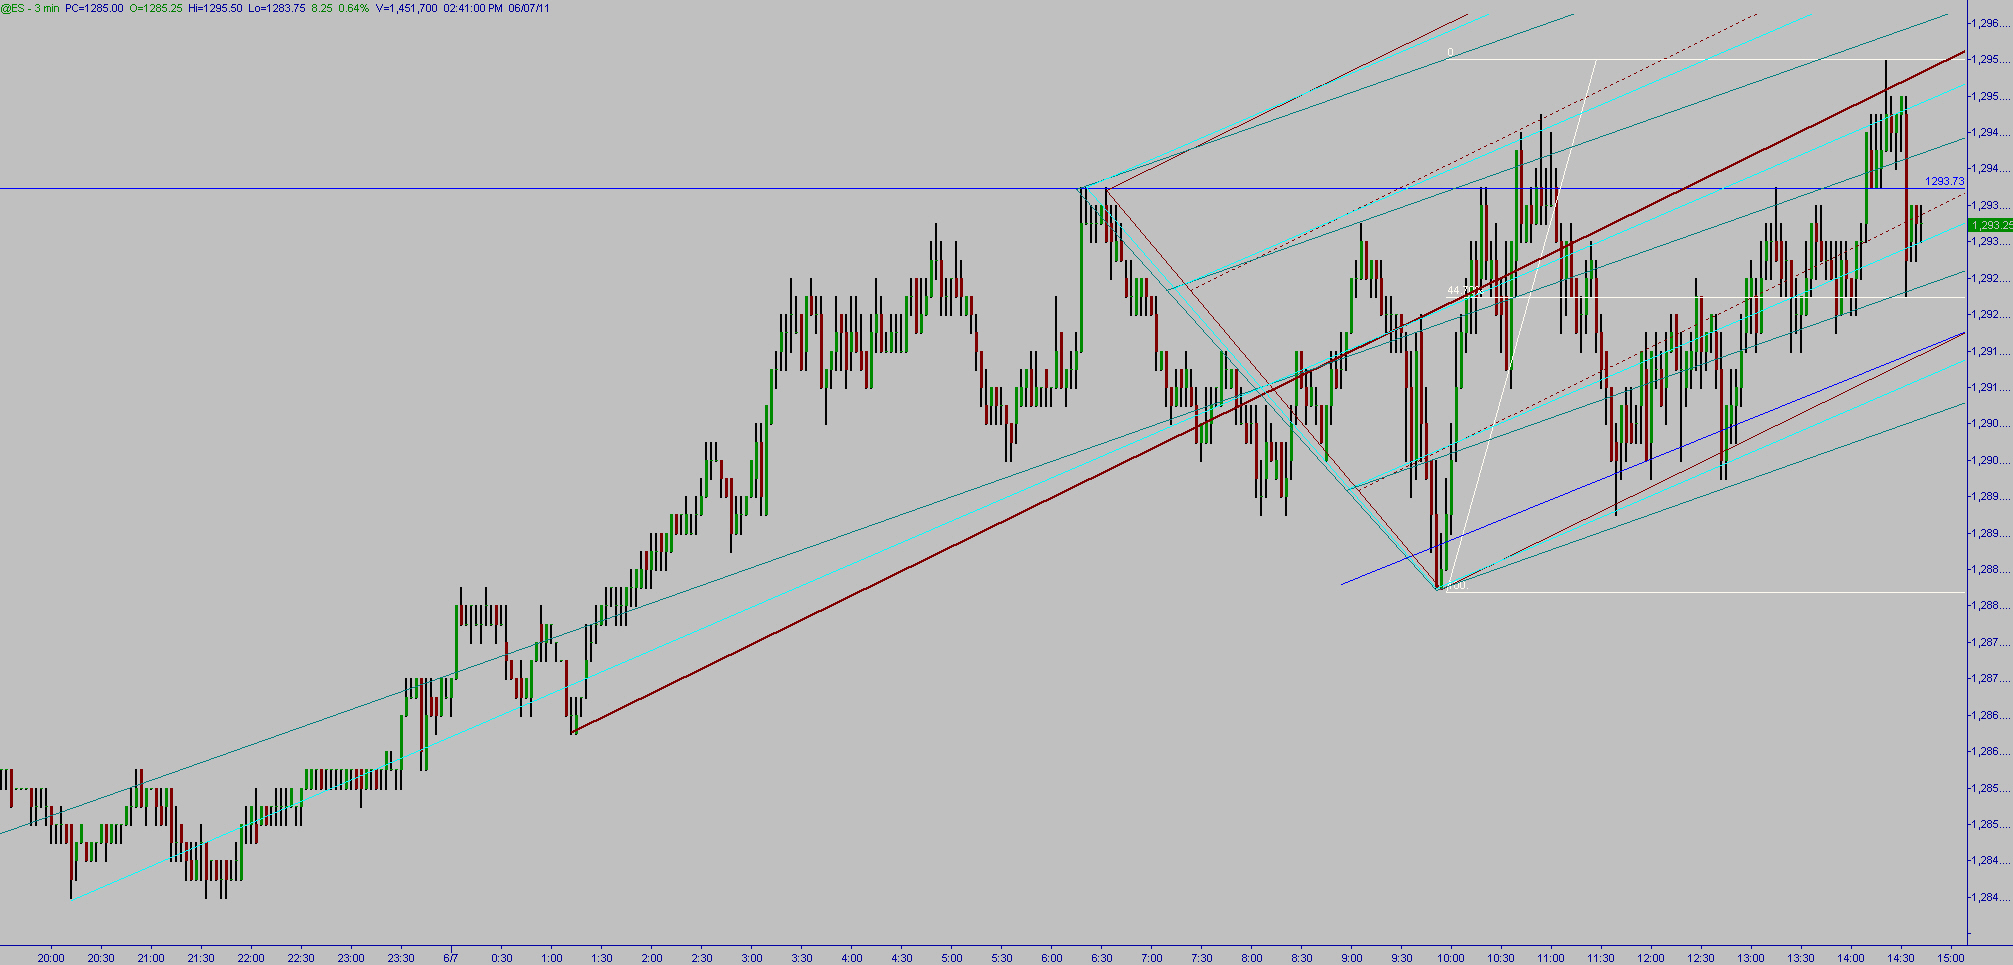
ES 3 minute. It pulled back to 44.7 but I don't know if it'll hold with the manic rush to get there.

Click image for original size
JA
jarek
Rep: 94
Posts: 3,474
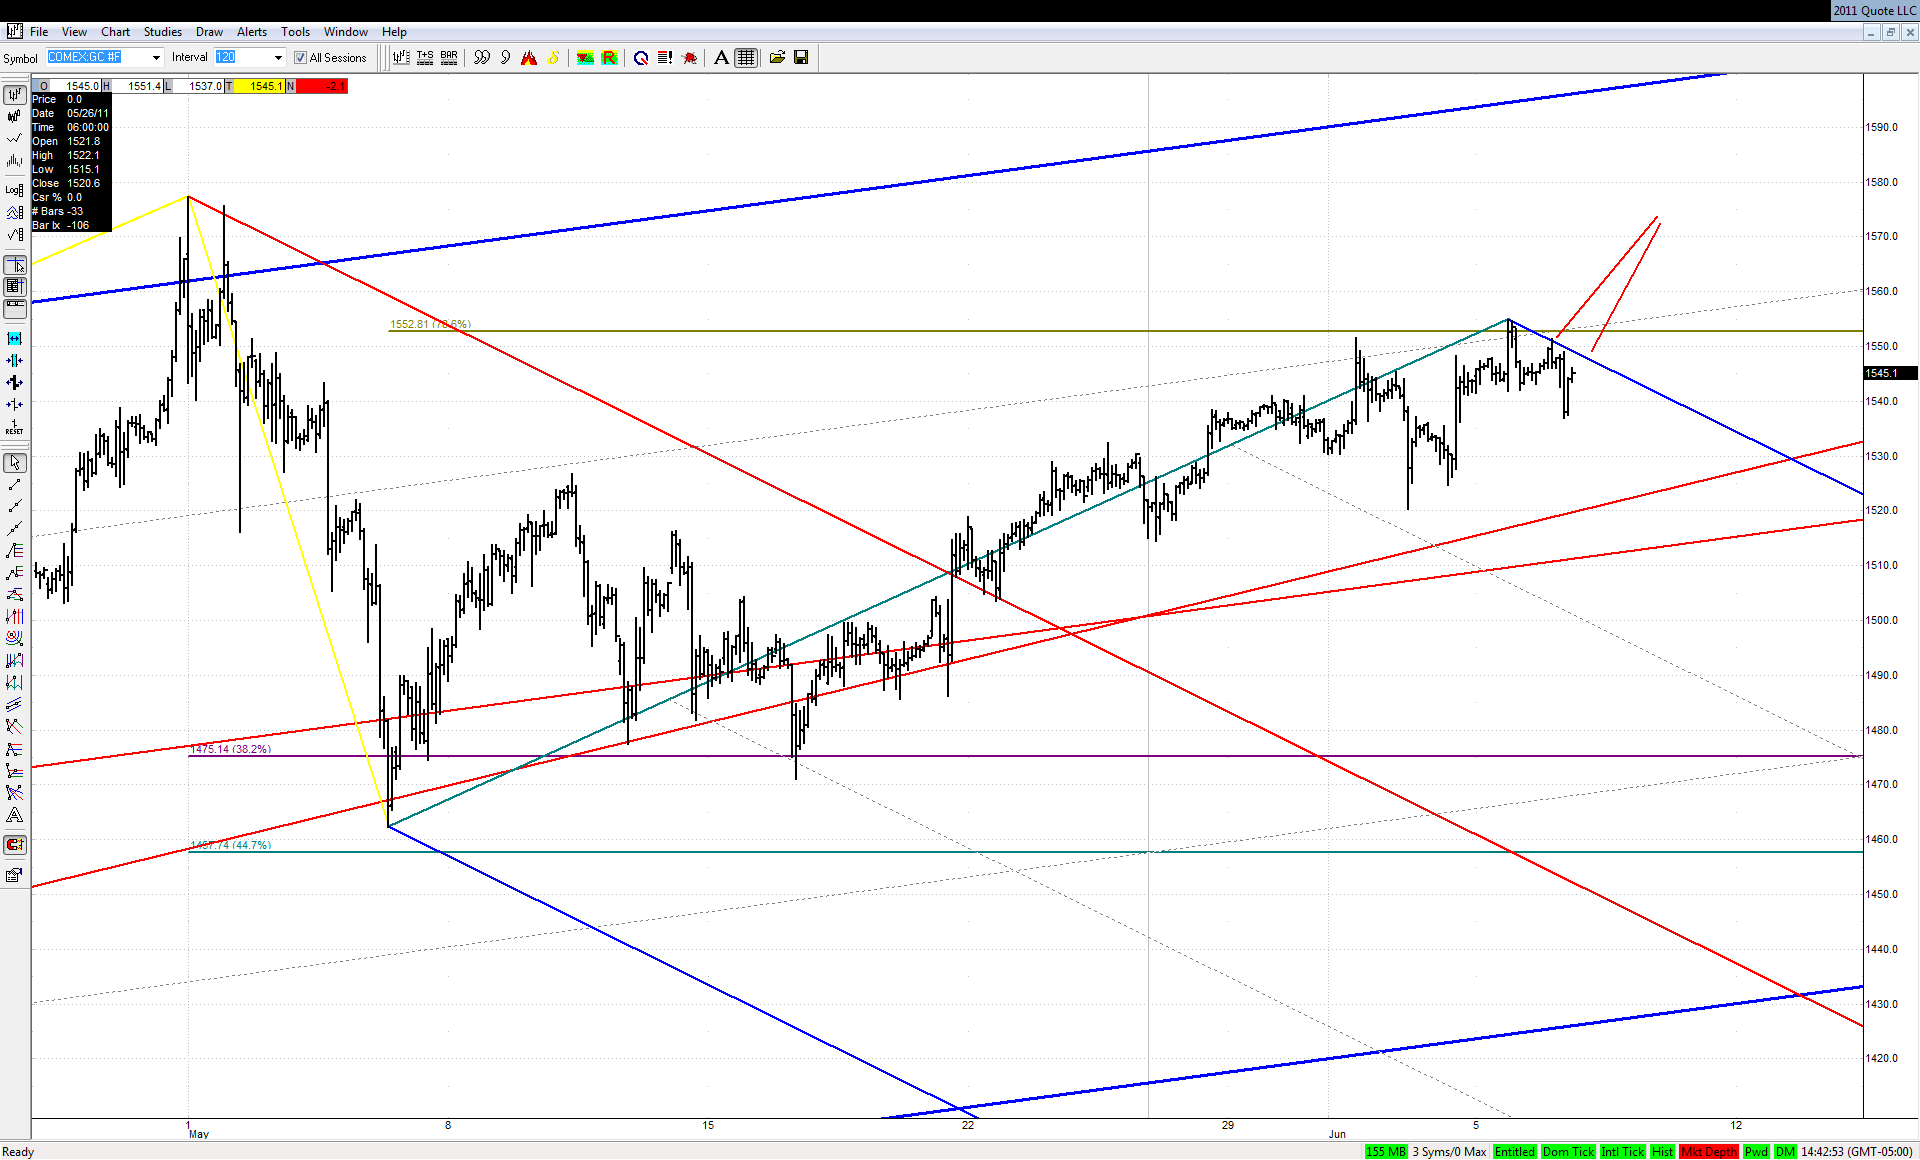
Little more effort and we will have a well known here setup in Gold:

Click image for original size
RA
rat89
Rep: 0
Posts: 7,015
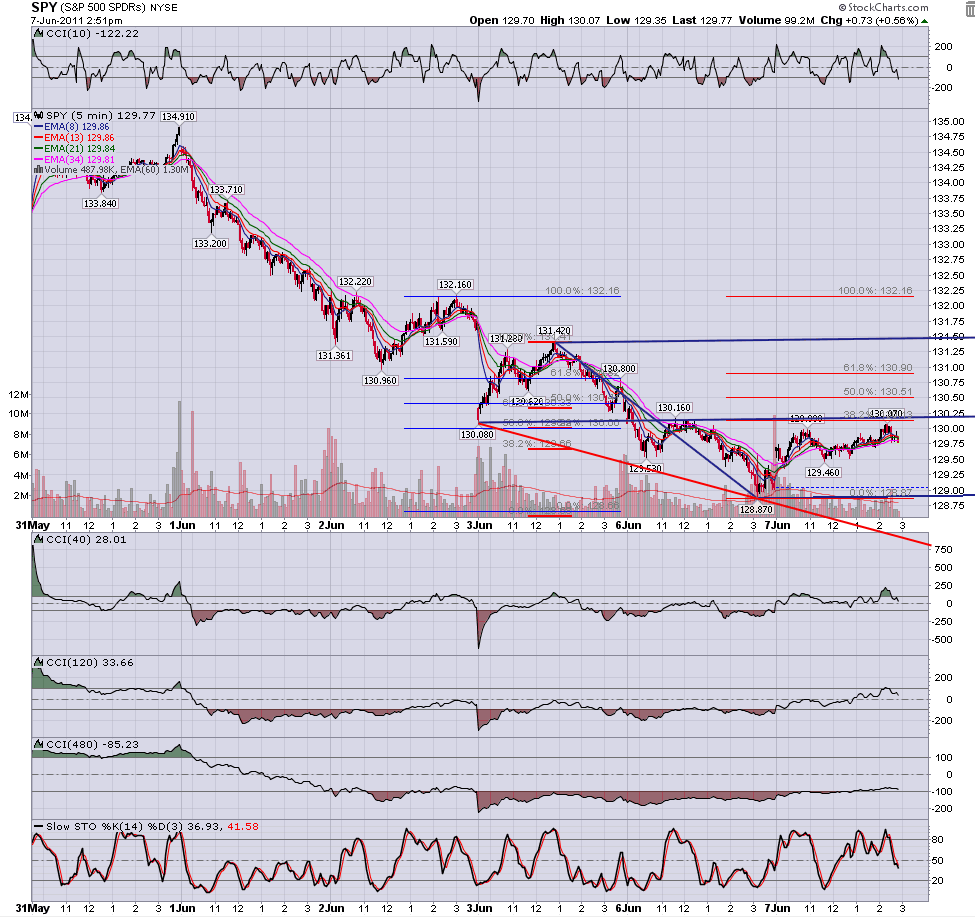
all this time to get here?


Click image for original size
JI
jimkane
Rep: 3,058
Posts: 33,089
Top of the hour credit report.
JI
jimkane
Rep: 3,058
Posts: 33,089
Same TL comes in around 90...
JI
jimkane
Rep: 3,058
Posts: 33,089
But a lot is calling this at 86.
JI
jimkane
Rep: 3,058
Posts: 33,089
Off course we all see the 1-min SL and three pushes, too, right here.
JI
jimkane
Rep: 3,058
Posts: 33,089
But mostly this is all trying to figure out tick chart slop chop, as it slop chops around.
JI
jimkane
Rep: 3,058
Posts: 33,089
That move in crude was something, eh? There's always action somewhere.
RA
rat89
Rep: 0
Posts: 7,015
it might have to, and we'll find out soon


Originally posted by tx_ches

I could certainly see it going lower though.