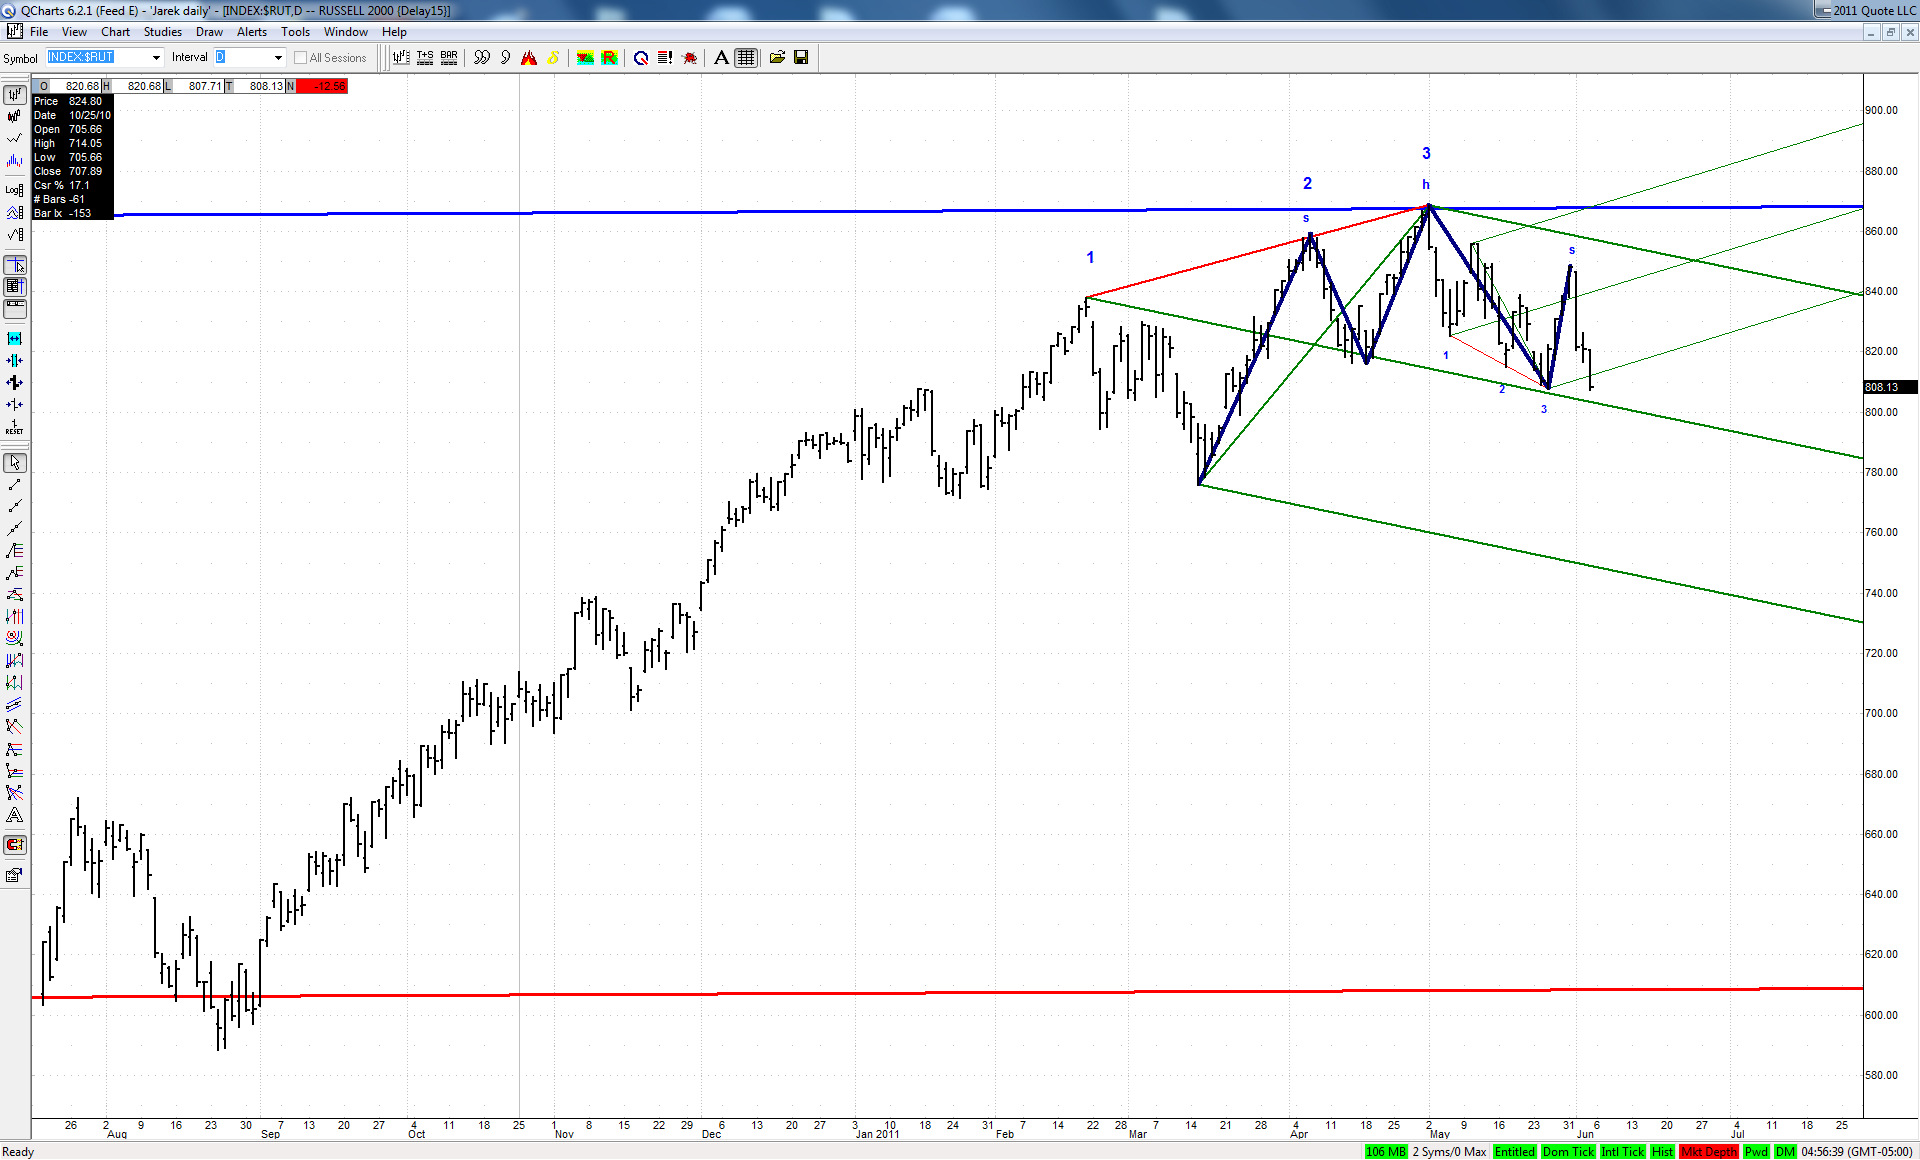
Jim suggested to take a look at daily charts of some secondary indexes and here is my current $RUT chart:
The green ML of a set based on big bearish 3D happens to be also a neckline of a classic head and shoulders. If bulls would not be able to defend this line next week, then a move to the lower ML should follow. This would also be a perfect fulfillment of a successful H&S pattern.
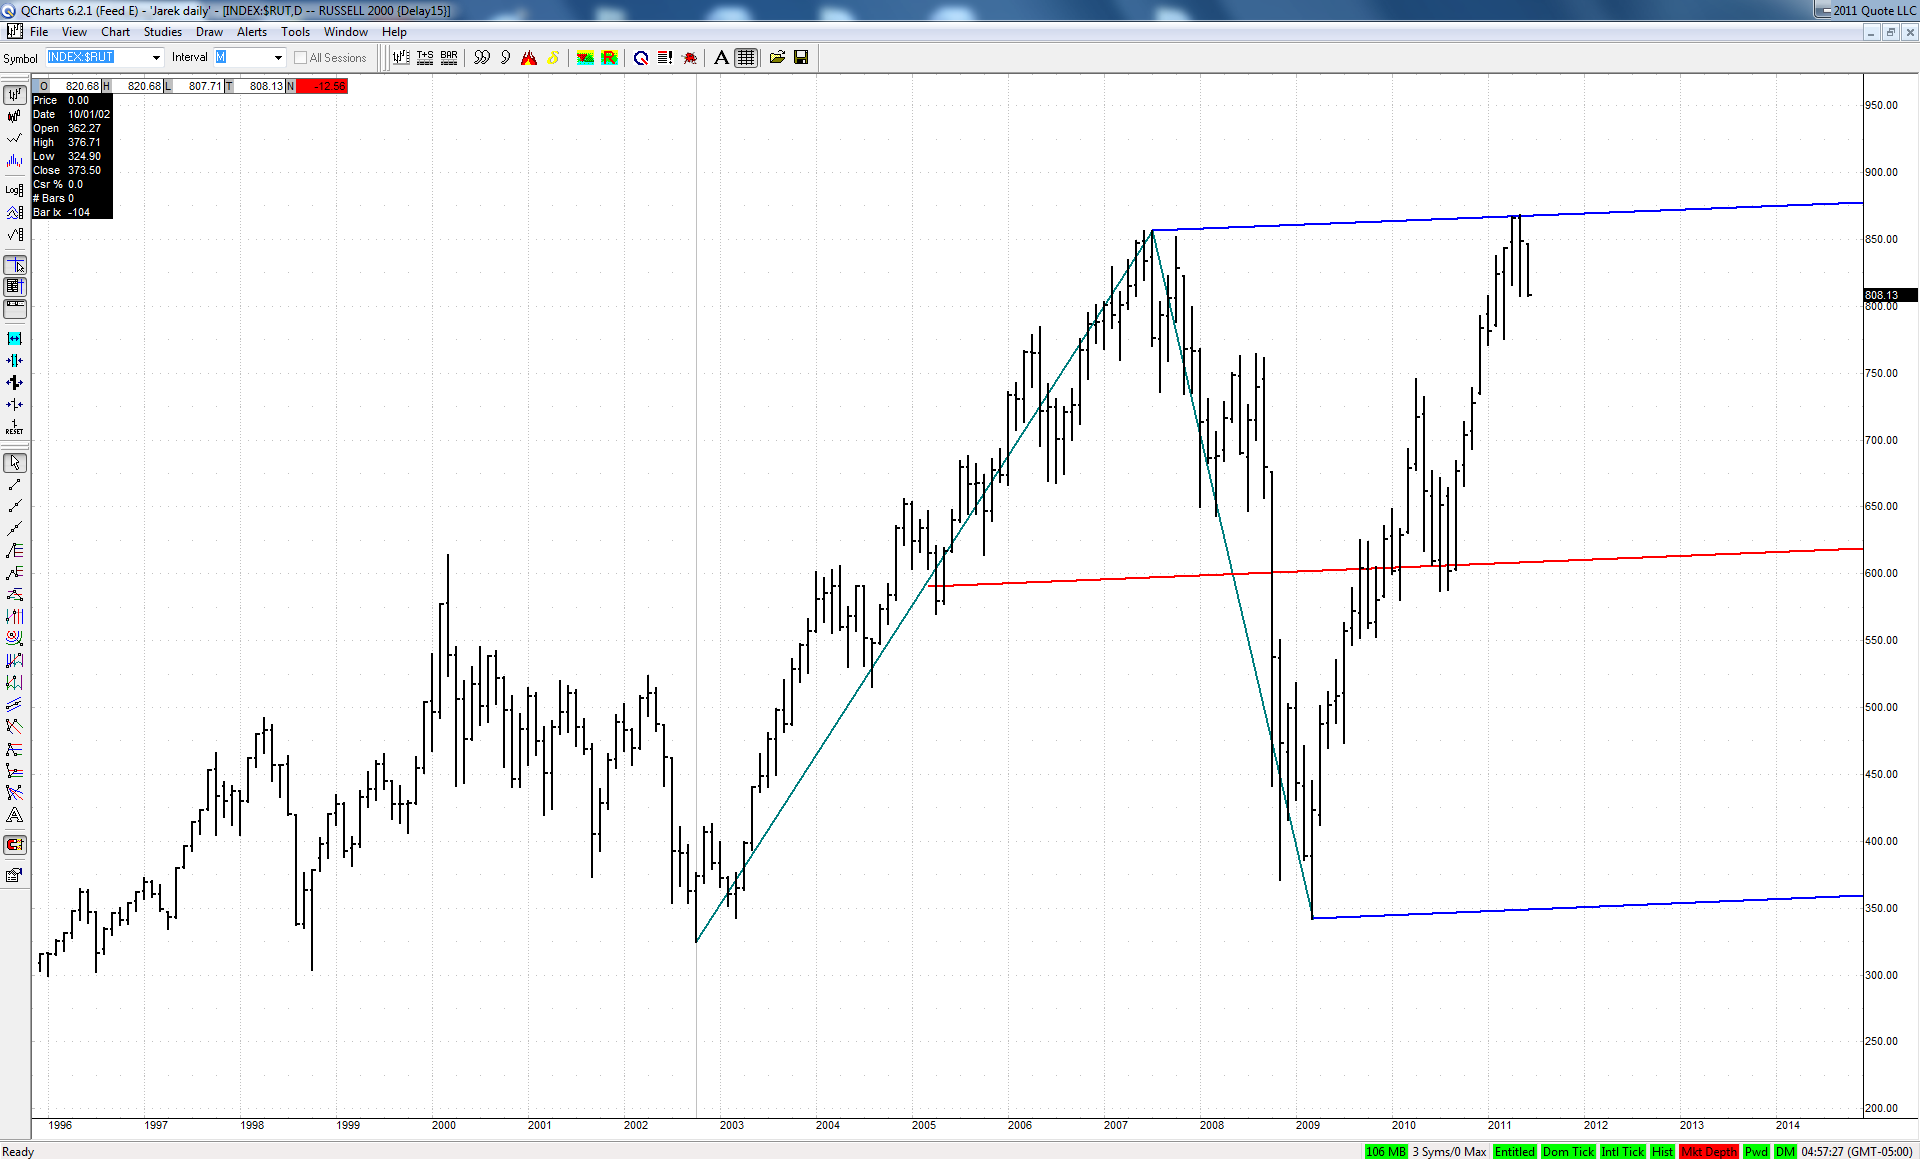
It is all the more interesting as this big bearish 3D fell dead on at the upper ML of a quite important set:
JA
jarek
Rep: 94
Posts: 3,474
Originally posted by jarek
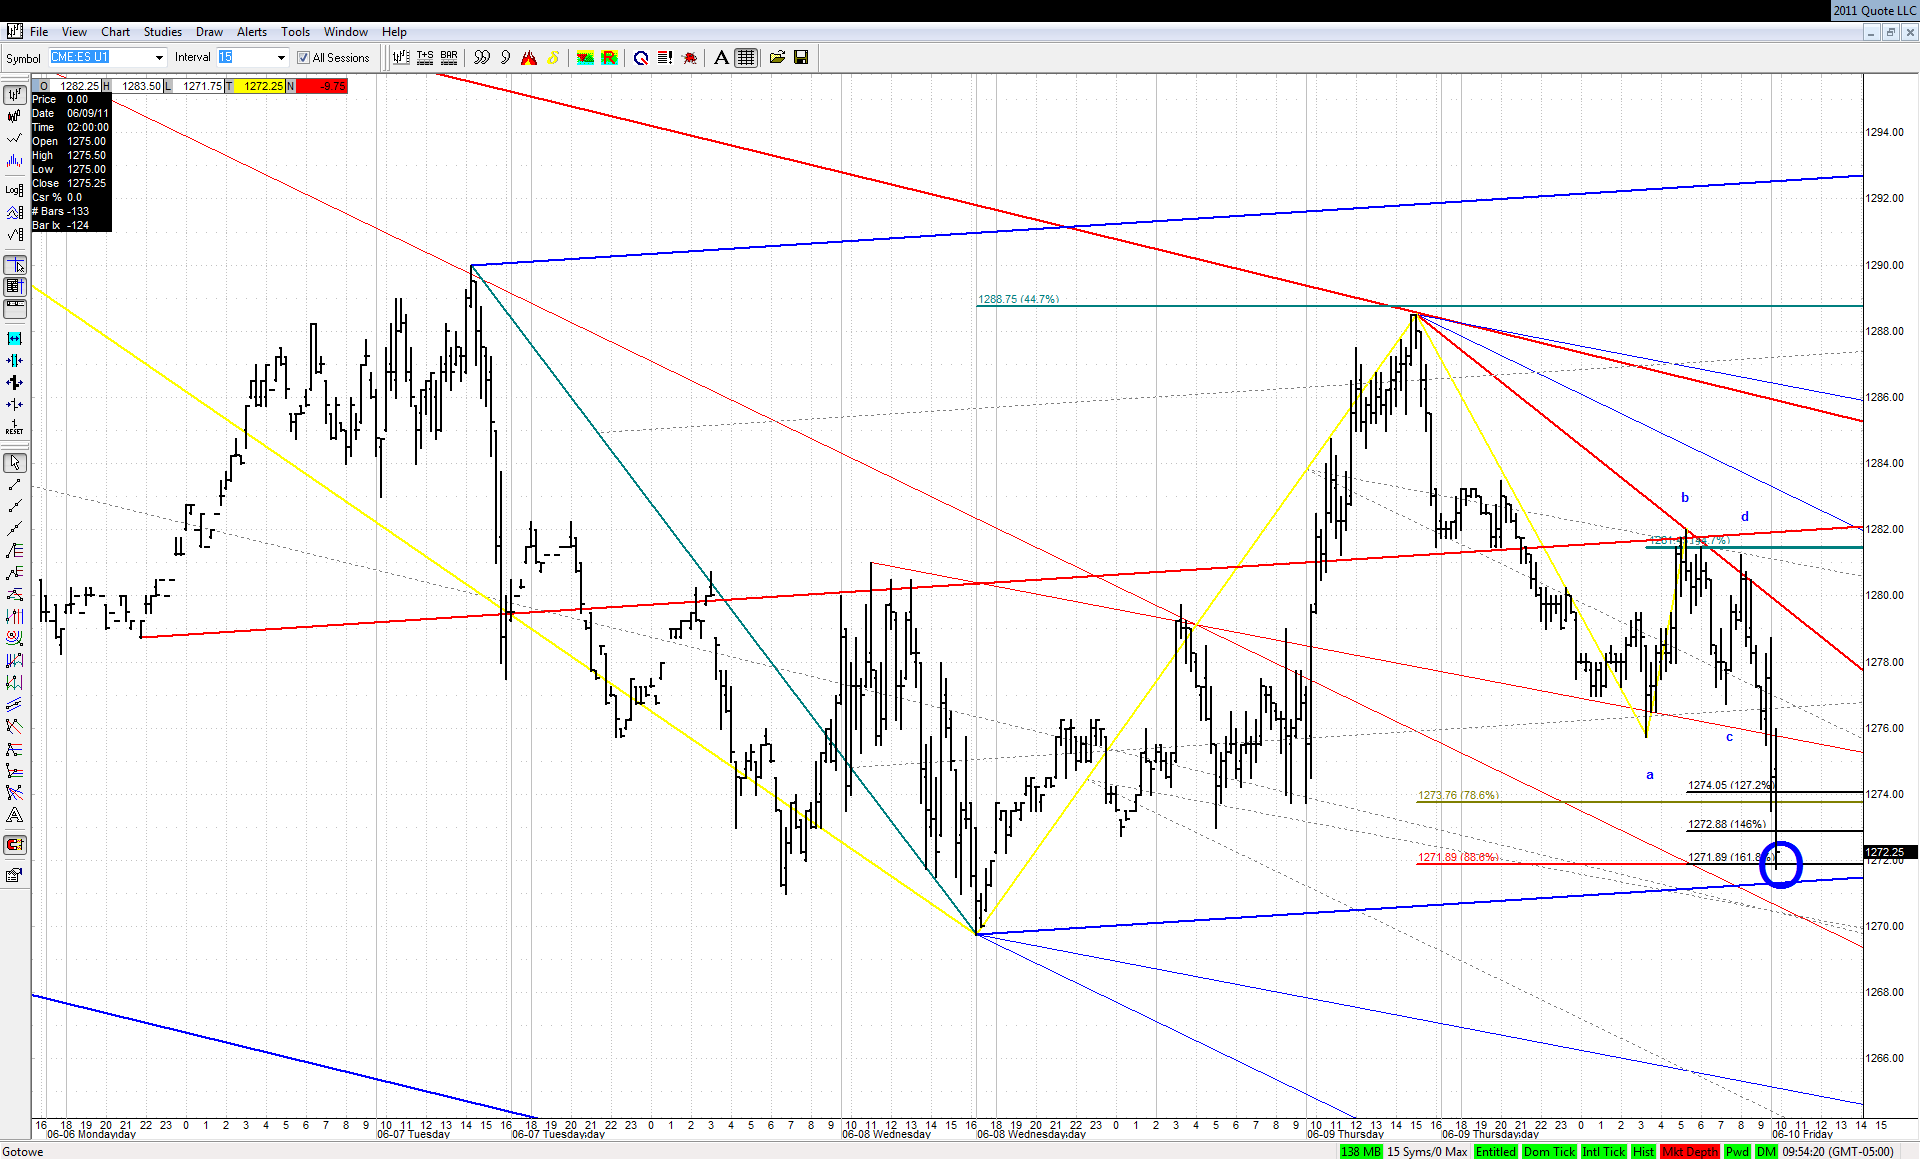
This area will be crucial for the bullish case here:
That would be quite a bulls eye if they started an upmove from here!
They didn't, so it wasn't...
We have a new low for the whole downmove that started in early May
RA
rat89
Rep: 0
Posts: 7,015
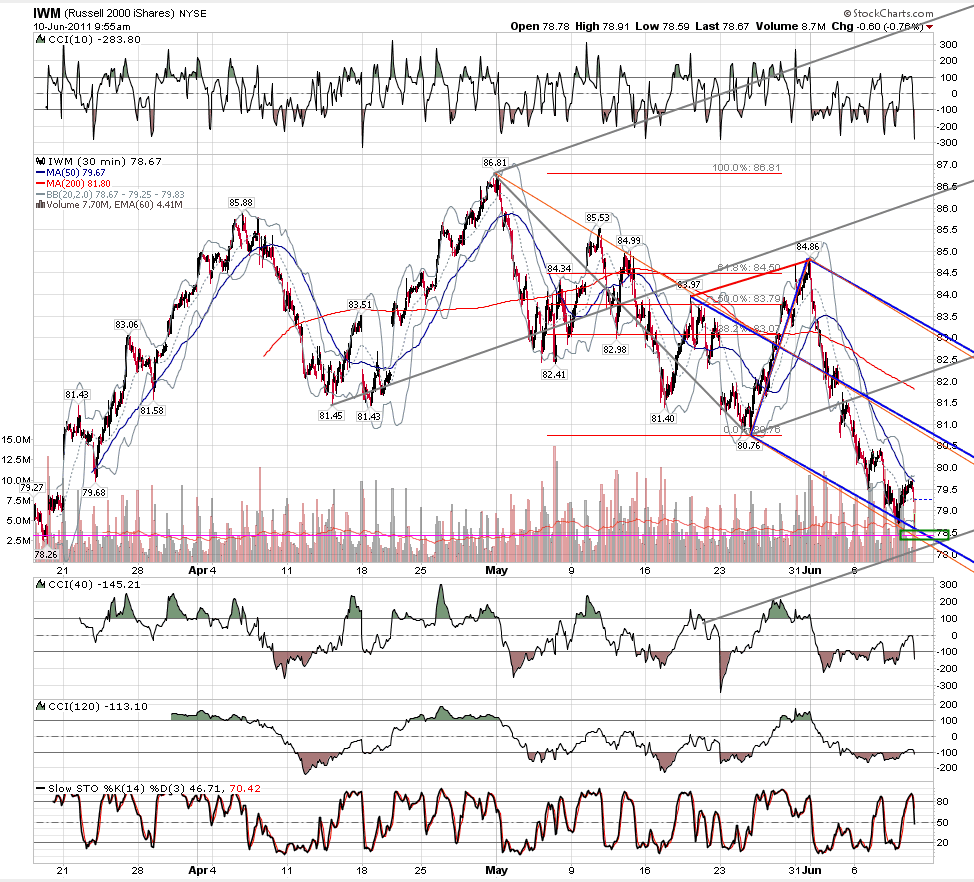
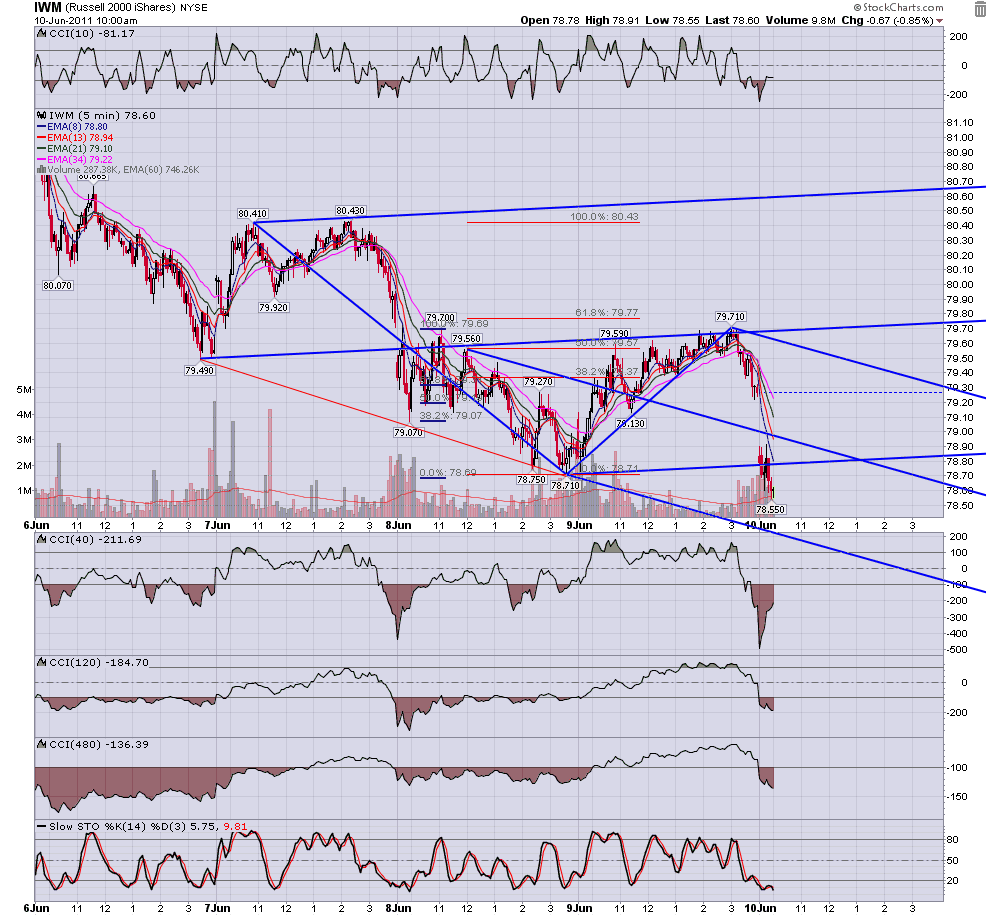
iwm hit that 2845 I was eyeing earlier this week.....and 1.27 of last swing.....let's see what they want to do with this now
TX
tx_ches
Rep: -10
Posts: 514
Your next level is the 1.618 dbs at 7823-11. Looks like it'll go for it.
Originally posted by rat89
iwm hit that 2845 I was eyeing earlier this week.....and 1.27 of last swing.....let's see what they want to do with this now