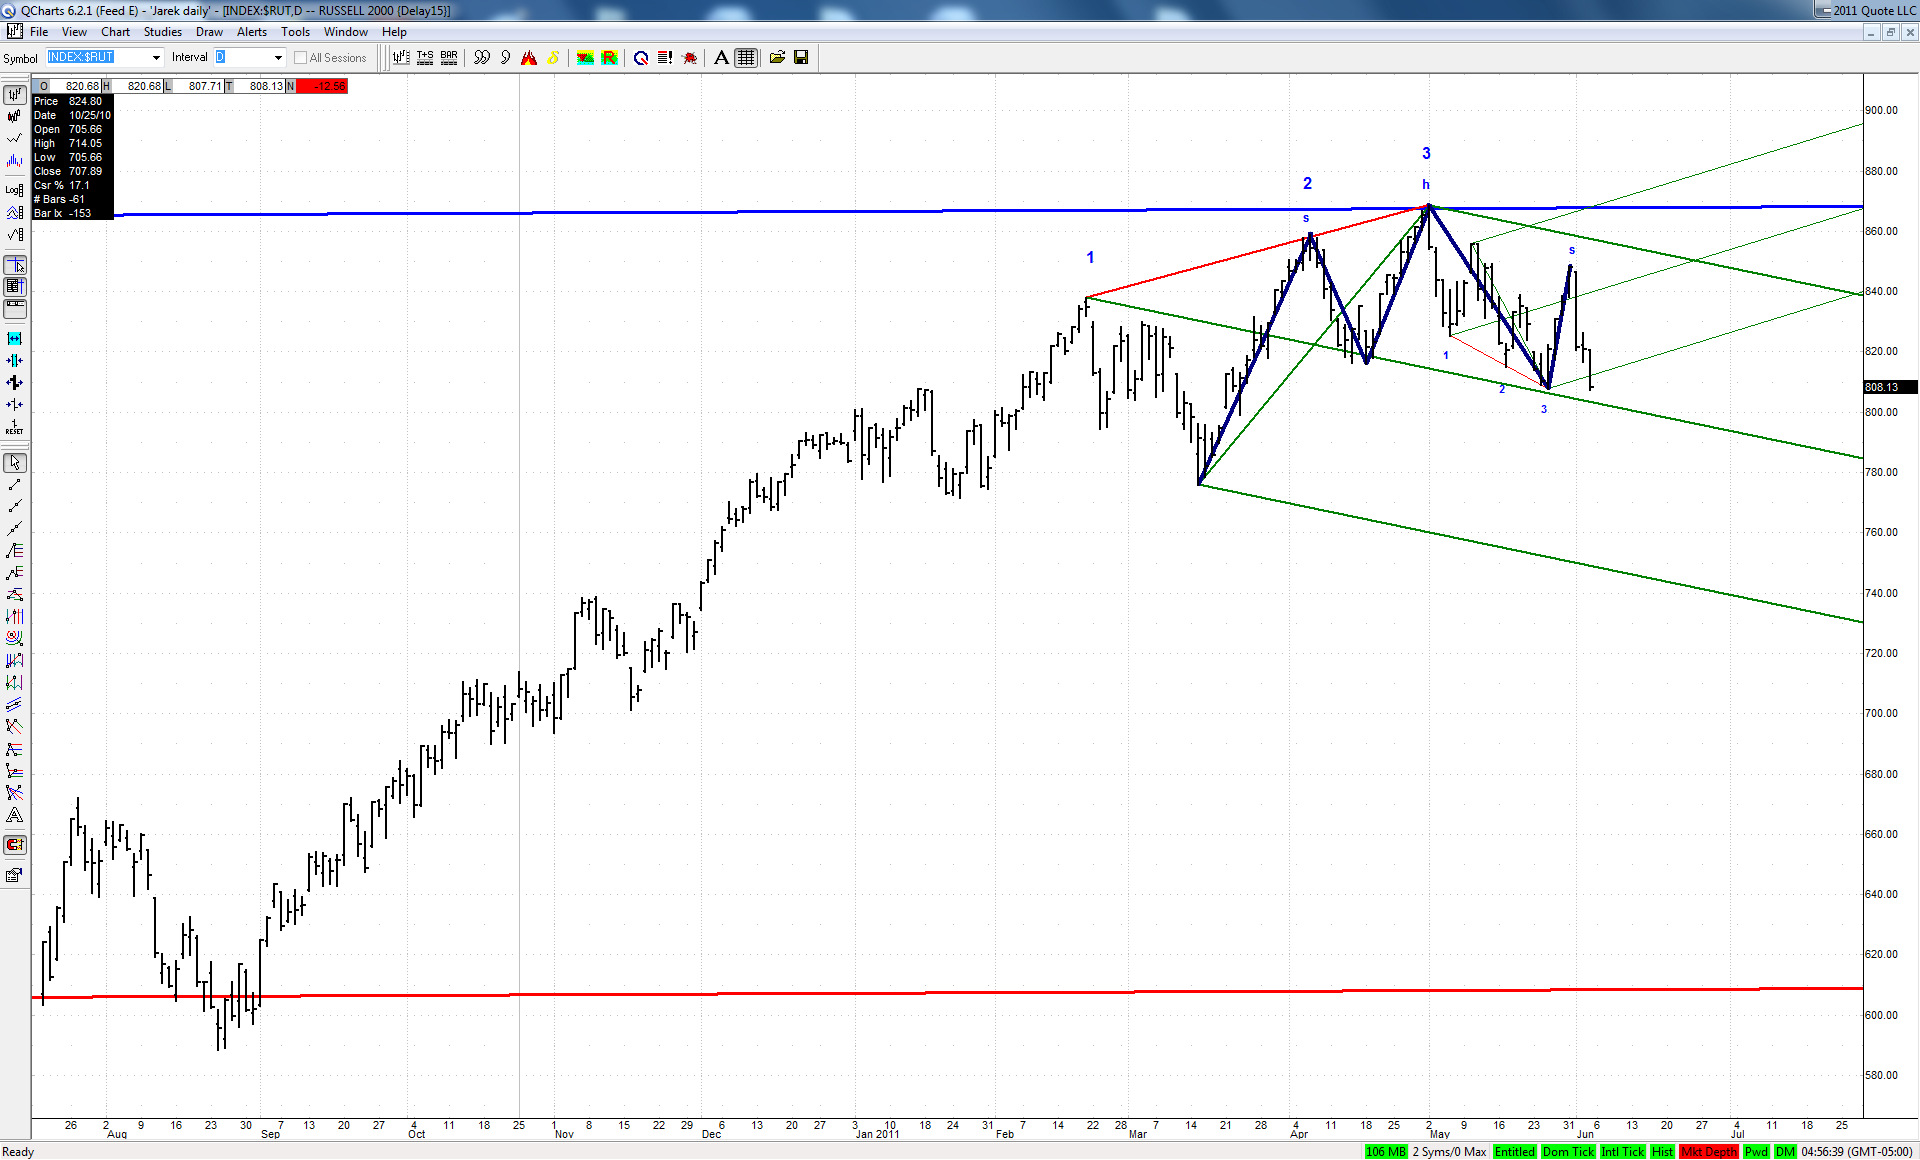
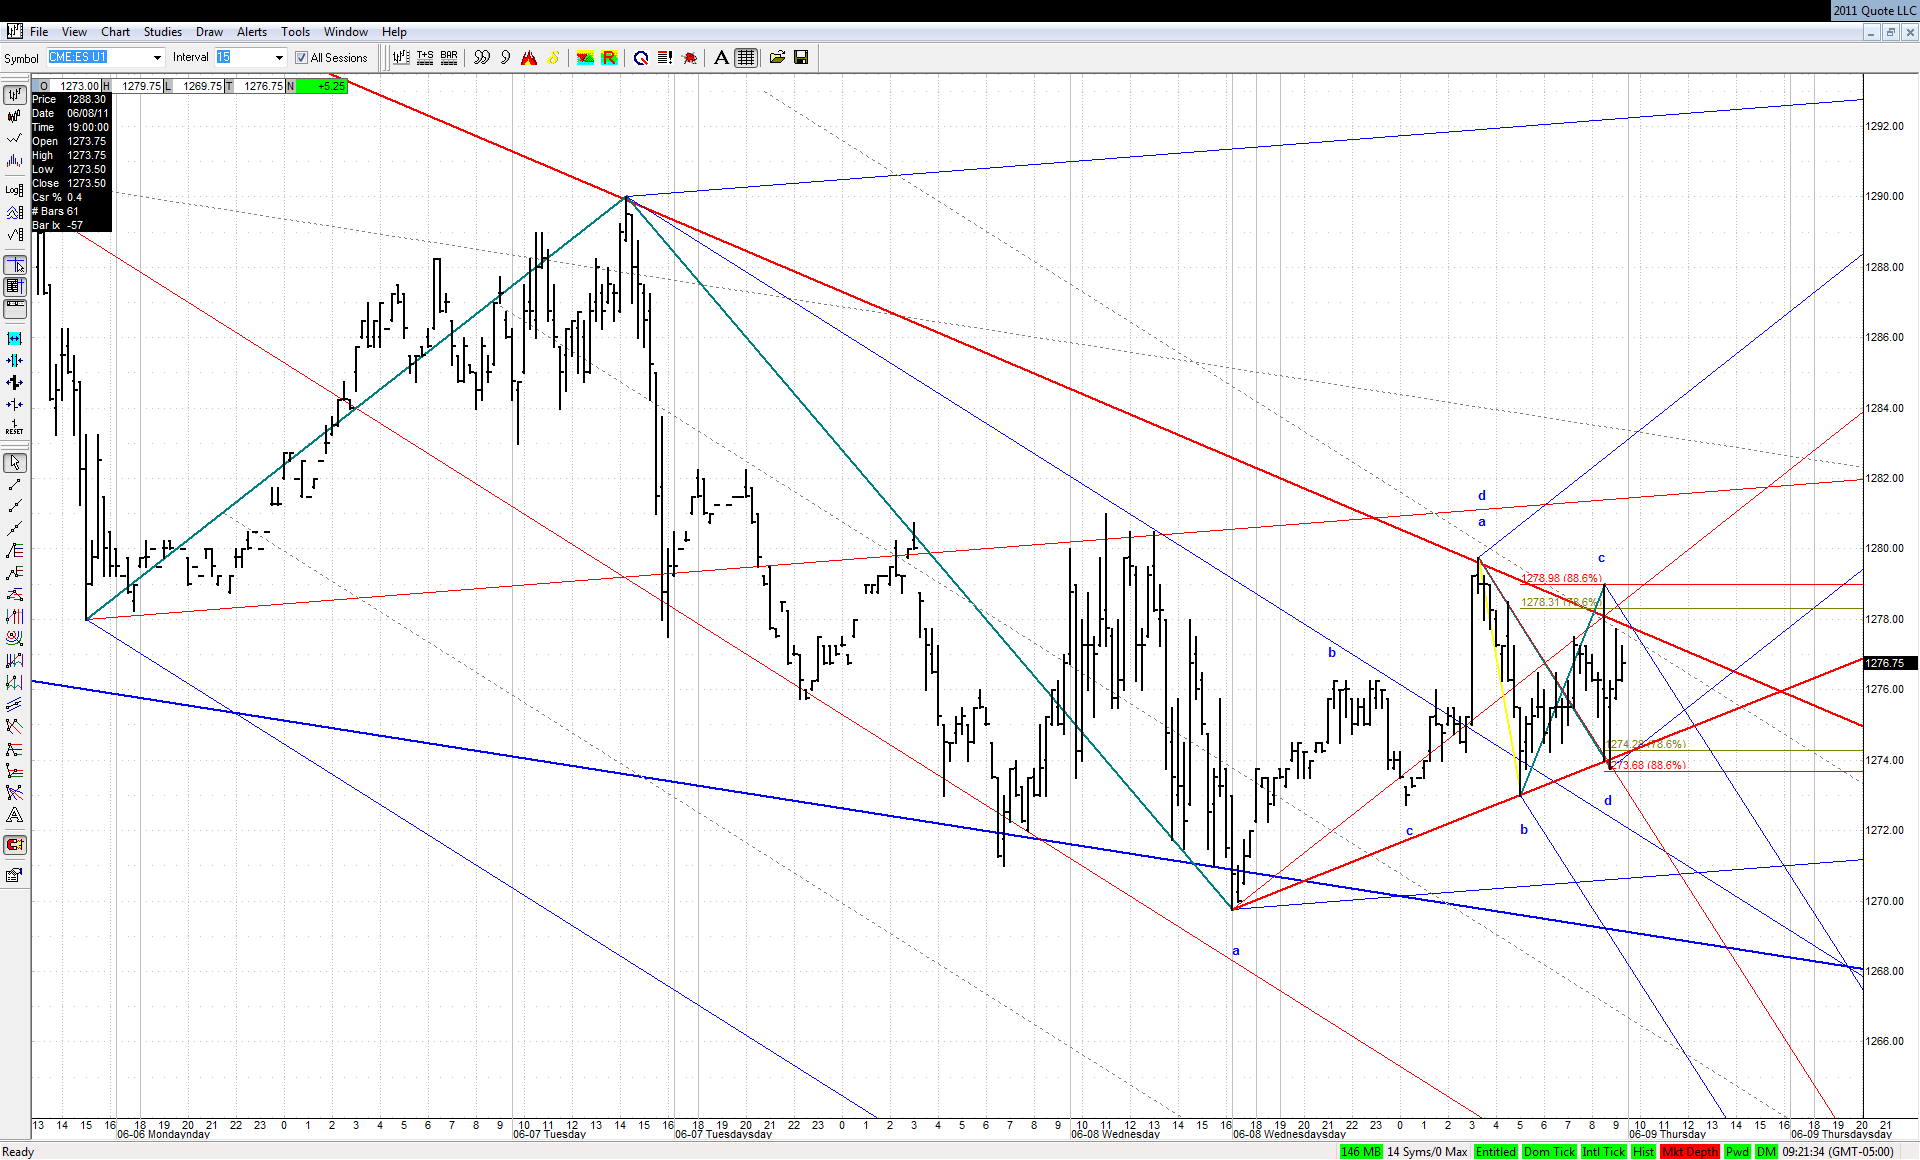
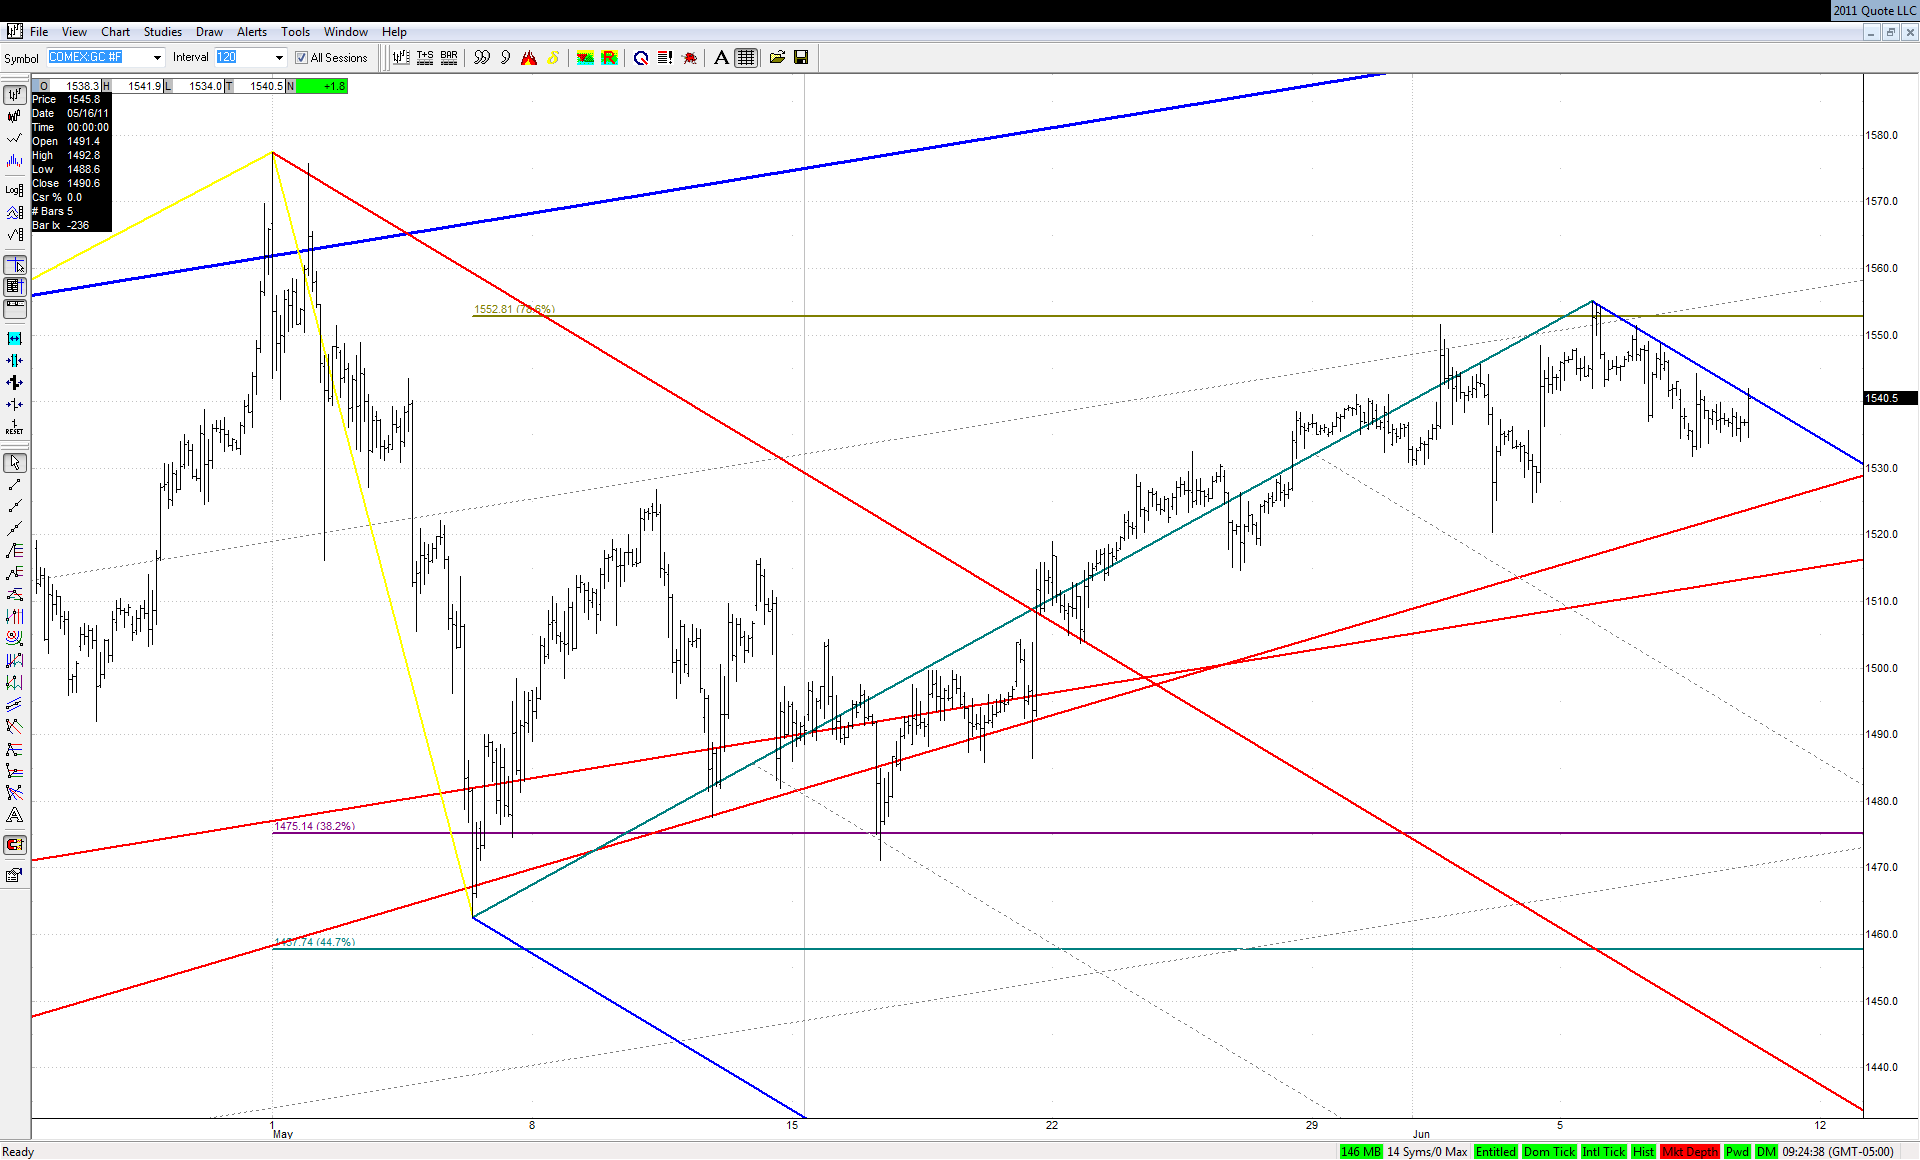
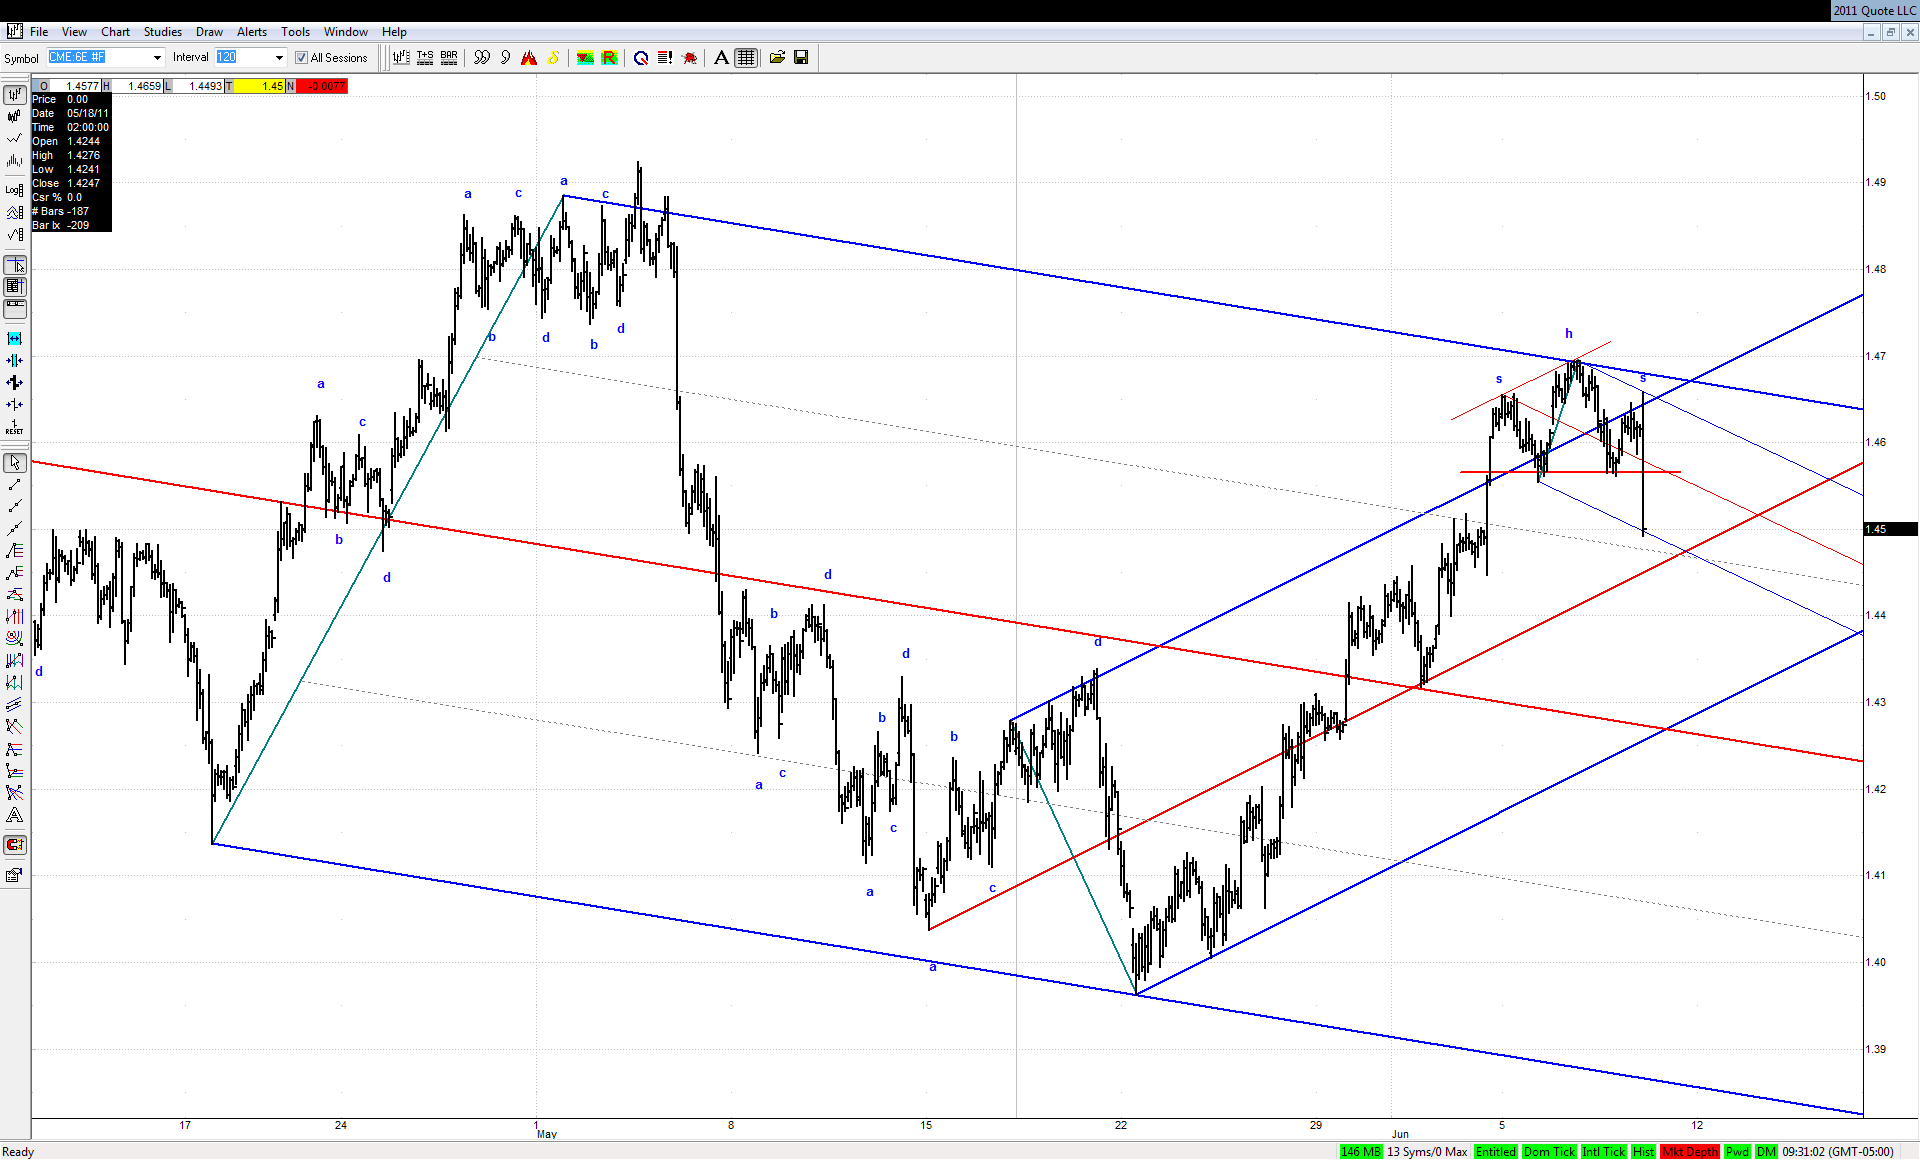
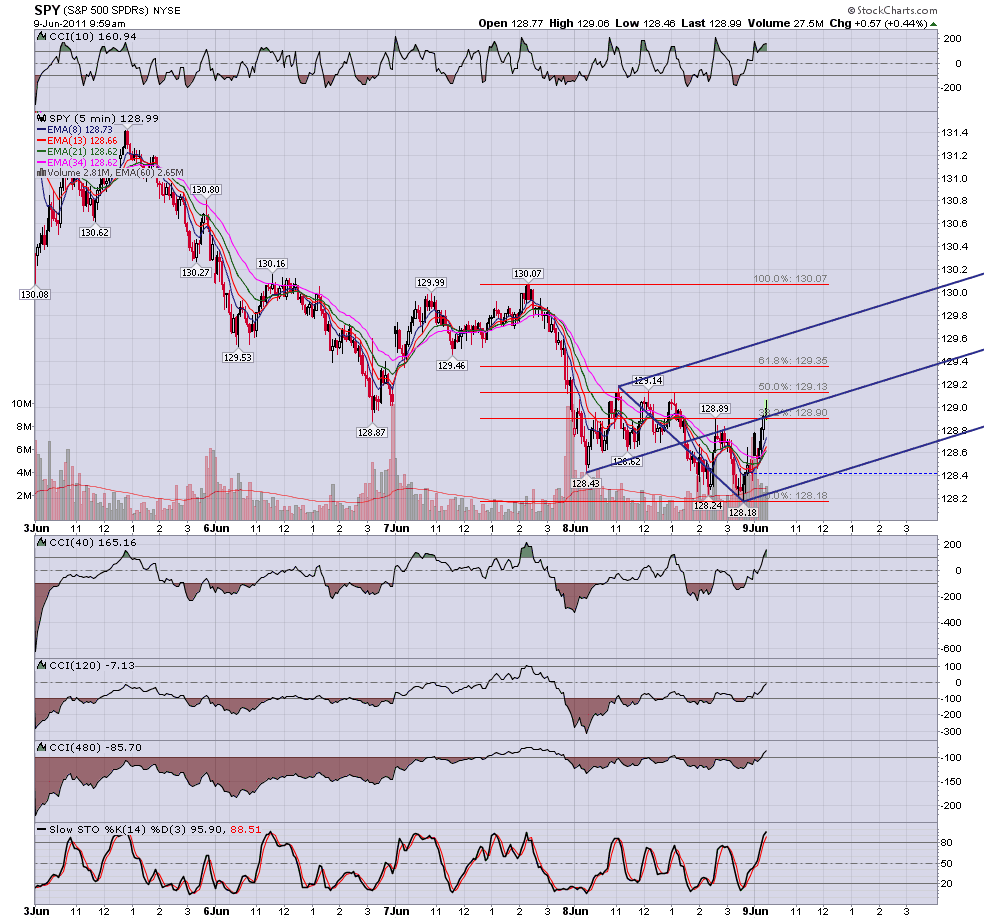
Jim suggested to take a look at daily charts of some secondary indexes and here is my current $RUT chart:
The green ML of a set based on big bearish 3D happens to be also a neckline of a classic head and shoulders. If bulls would not be able to defend this line next week, then a move to the lower ML should follow. This would also be a perfect fulfillment of a successful H&S pattern.
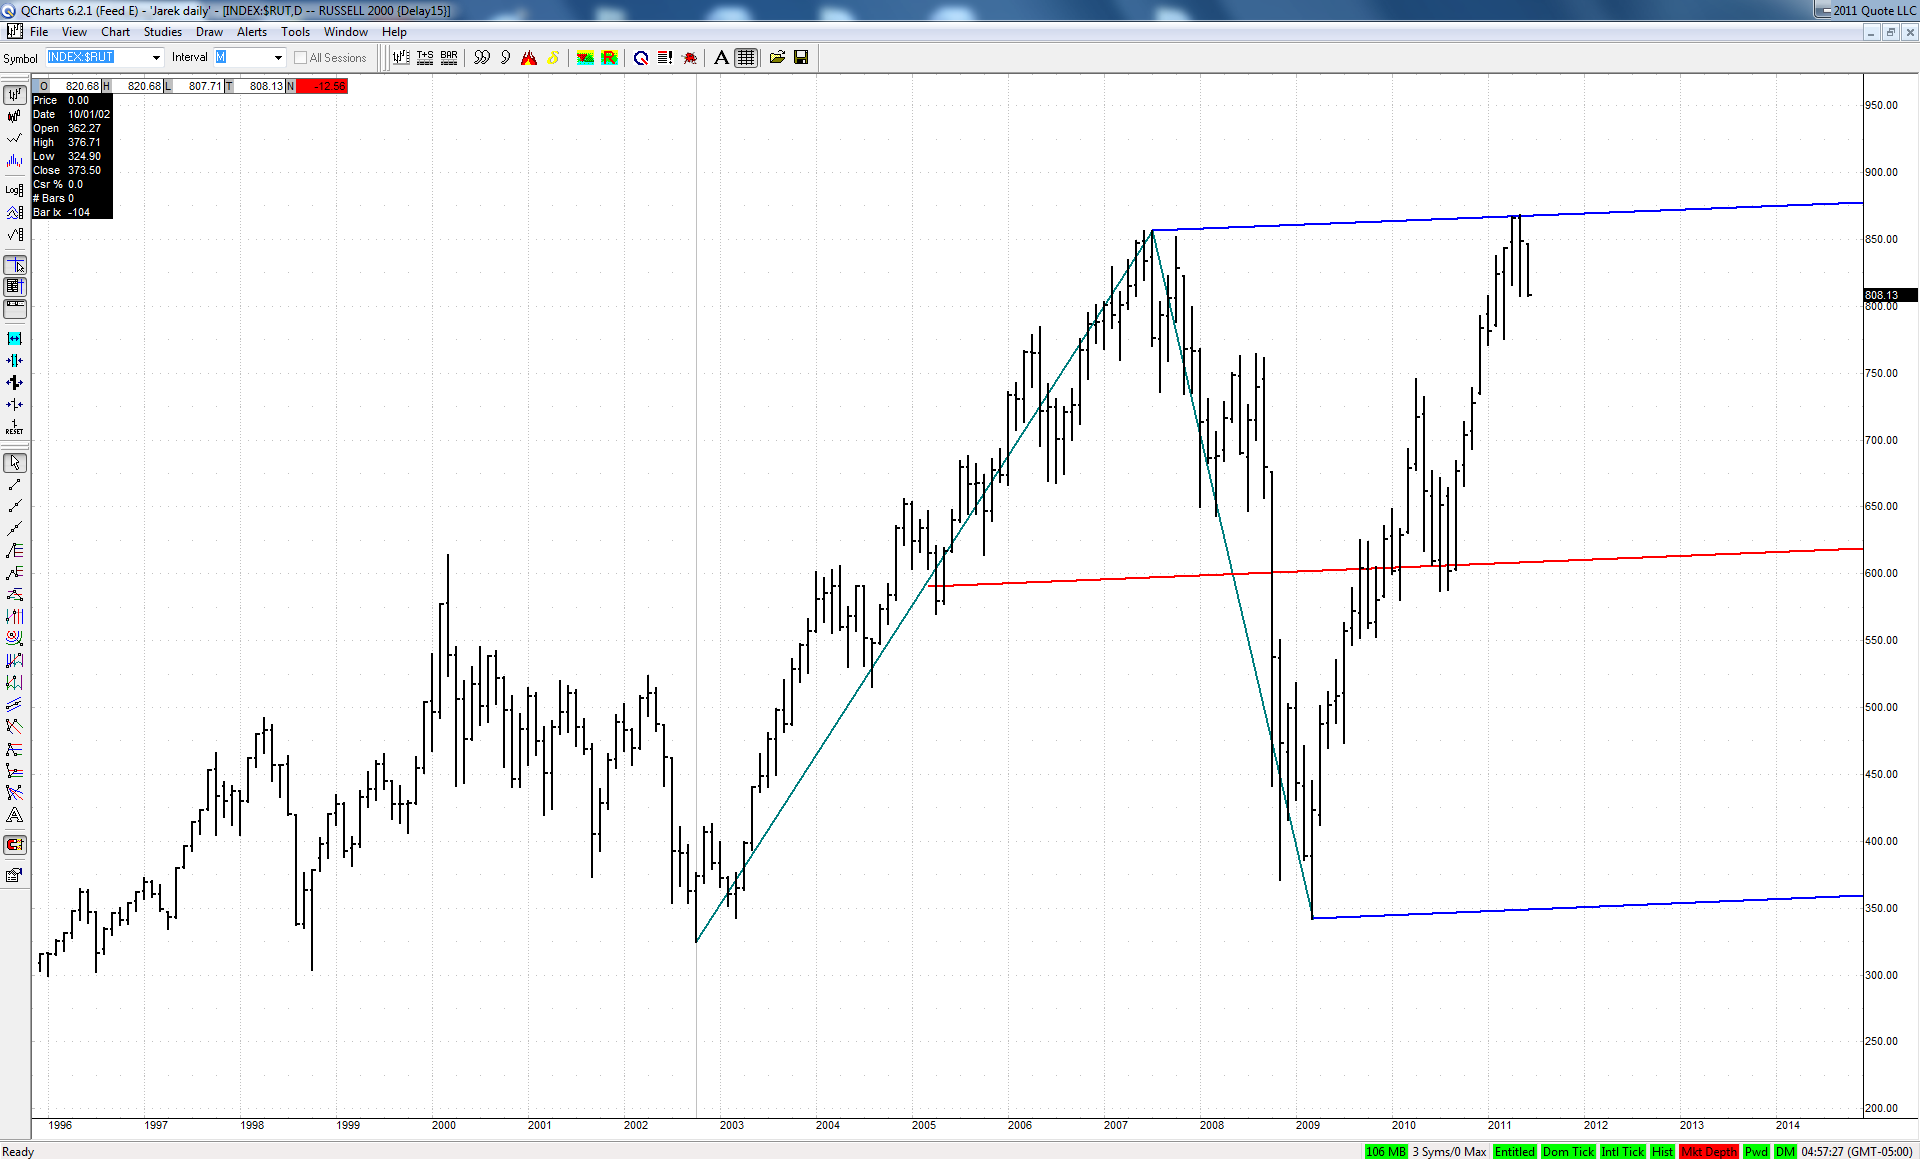
It is all the more interesting as this big bearish 3D fell dead on at the upper ML of a quite important set:
TX
tx_ches
Rep: -10
Posts: 514
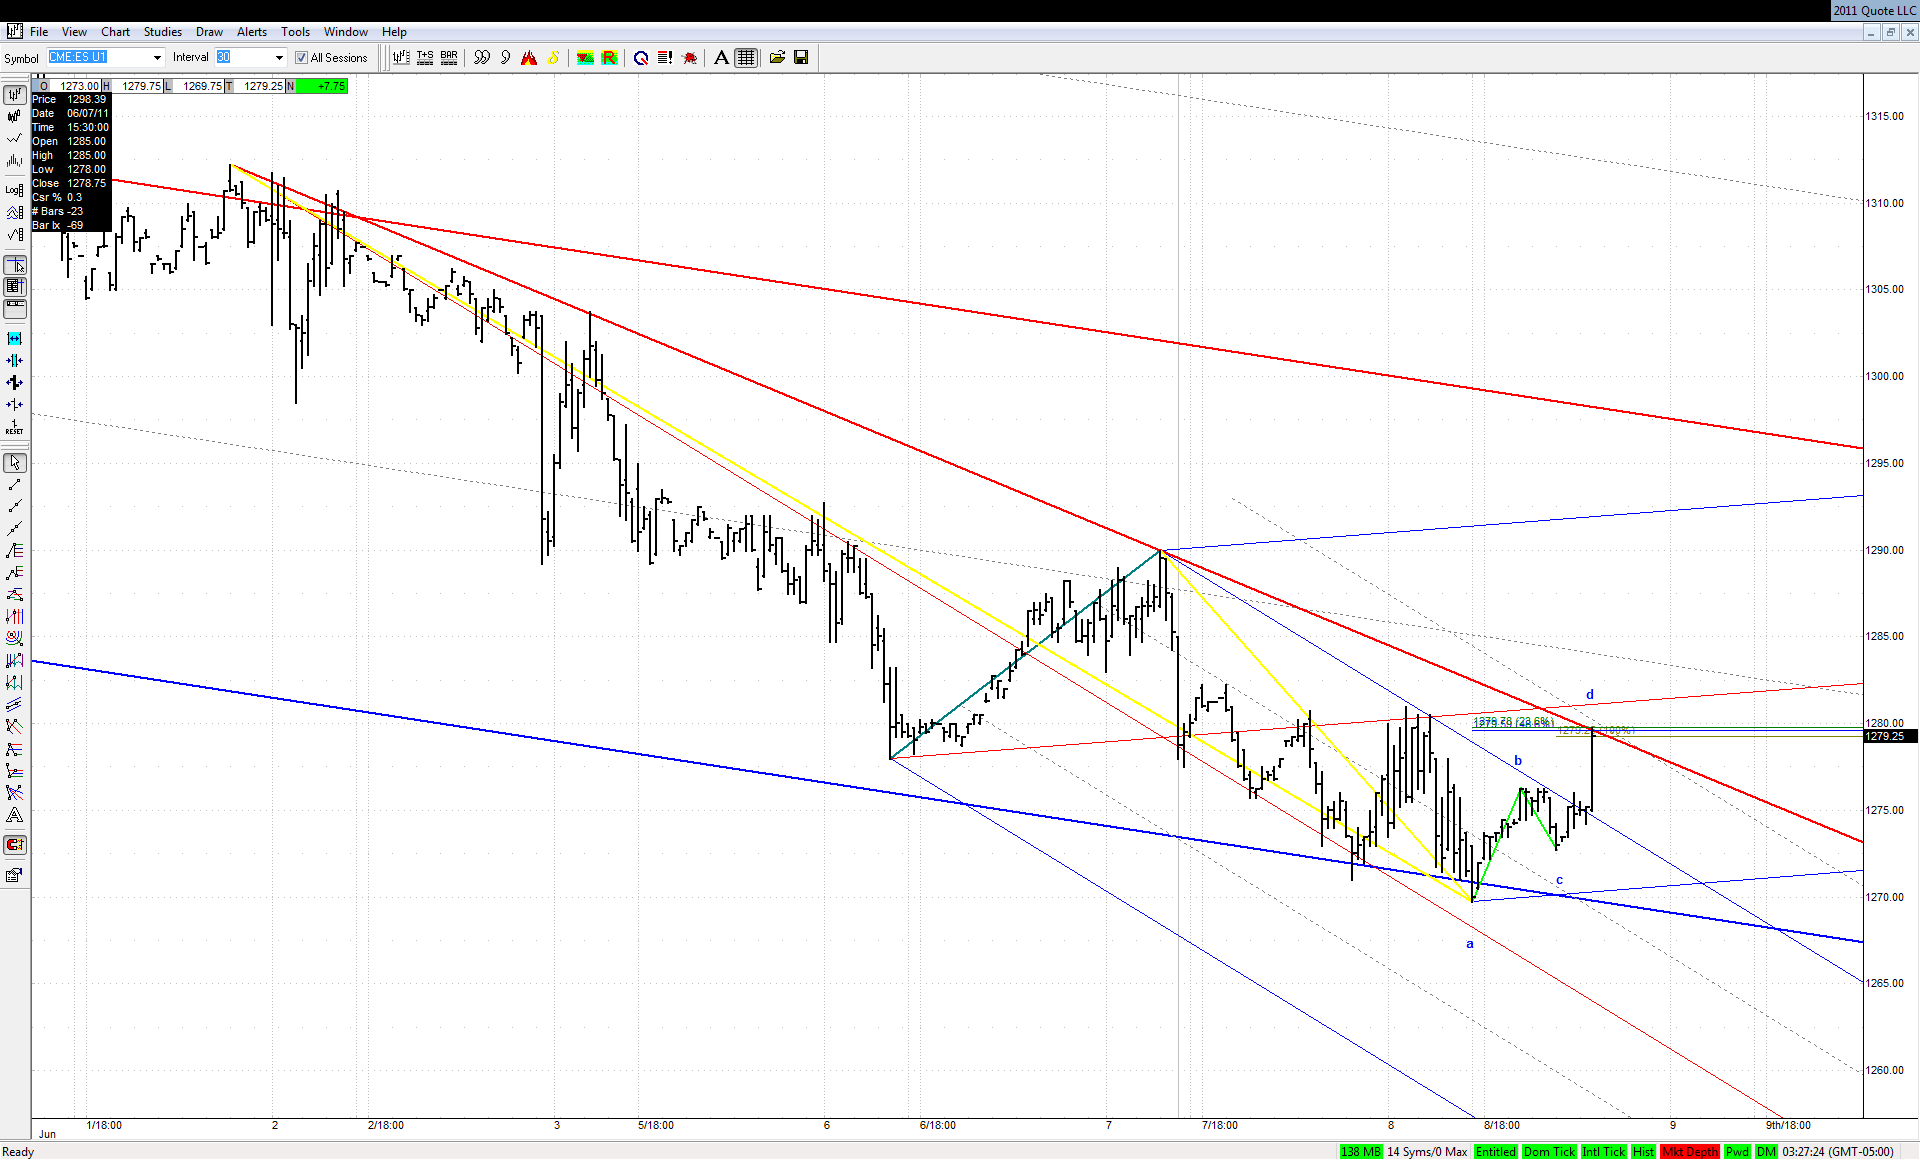
Or a bear 4pt? If you take out the first abcd and call that the ab leg? Not likely due to corrective vs impulse look. Just trying to stay mentally flexible.
P.S. Doing that way gives a lot of overlap to the targets of 2 bear abcds.
Originally posted by jarek
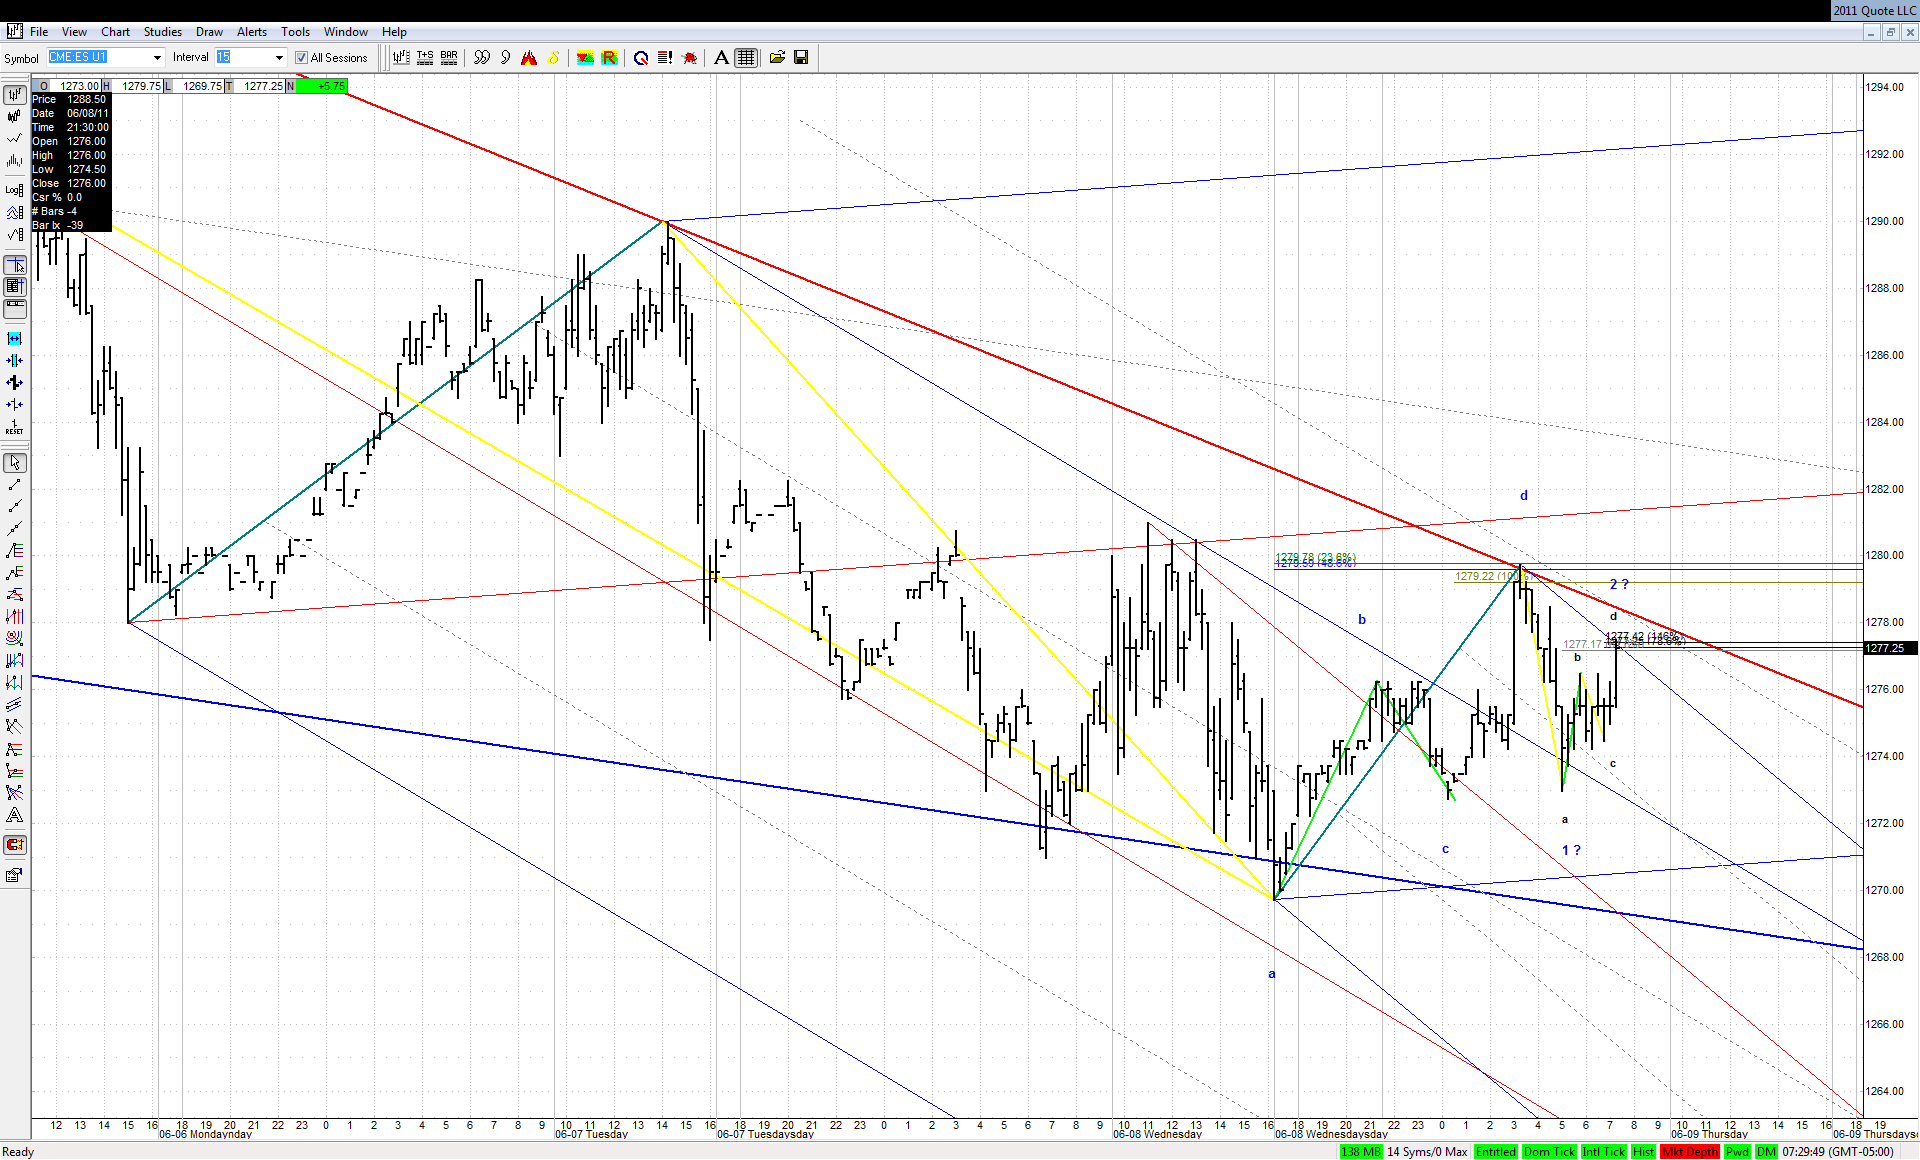
The smaller ABCD didn't hold and now it's the previous bearish ABCD against a bullish 4PT:
P.S. Doing that way gives a lot of overlap to the targets of 2 bear abcds.