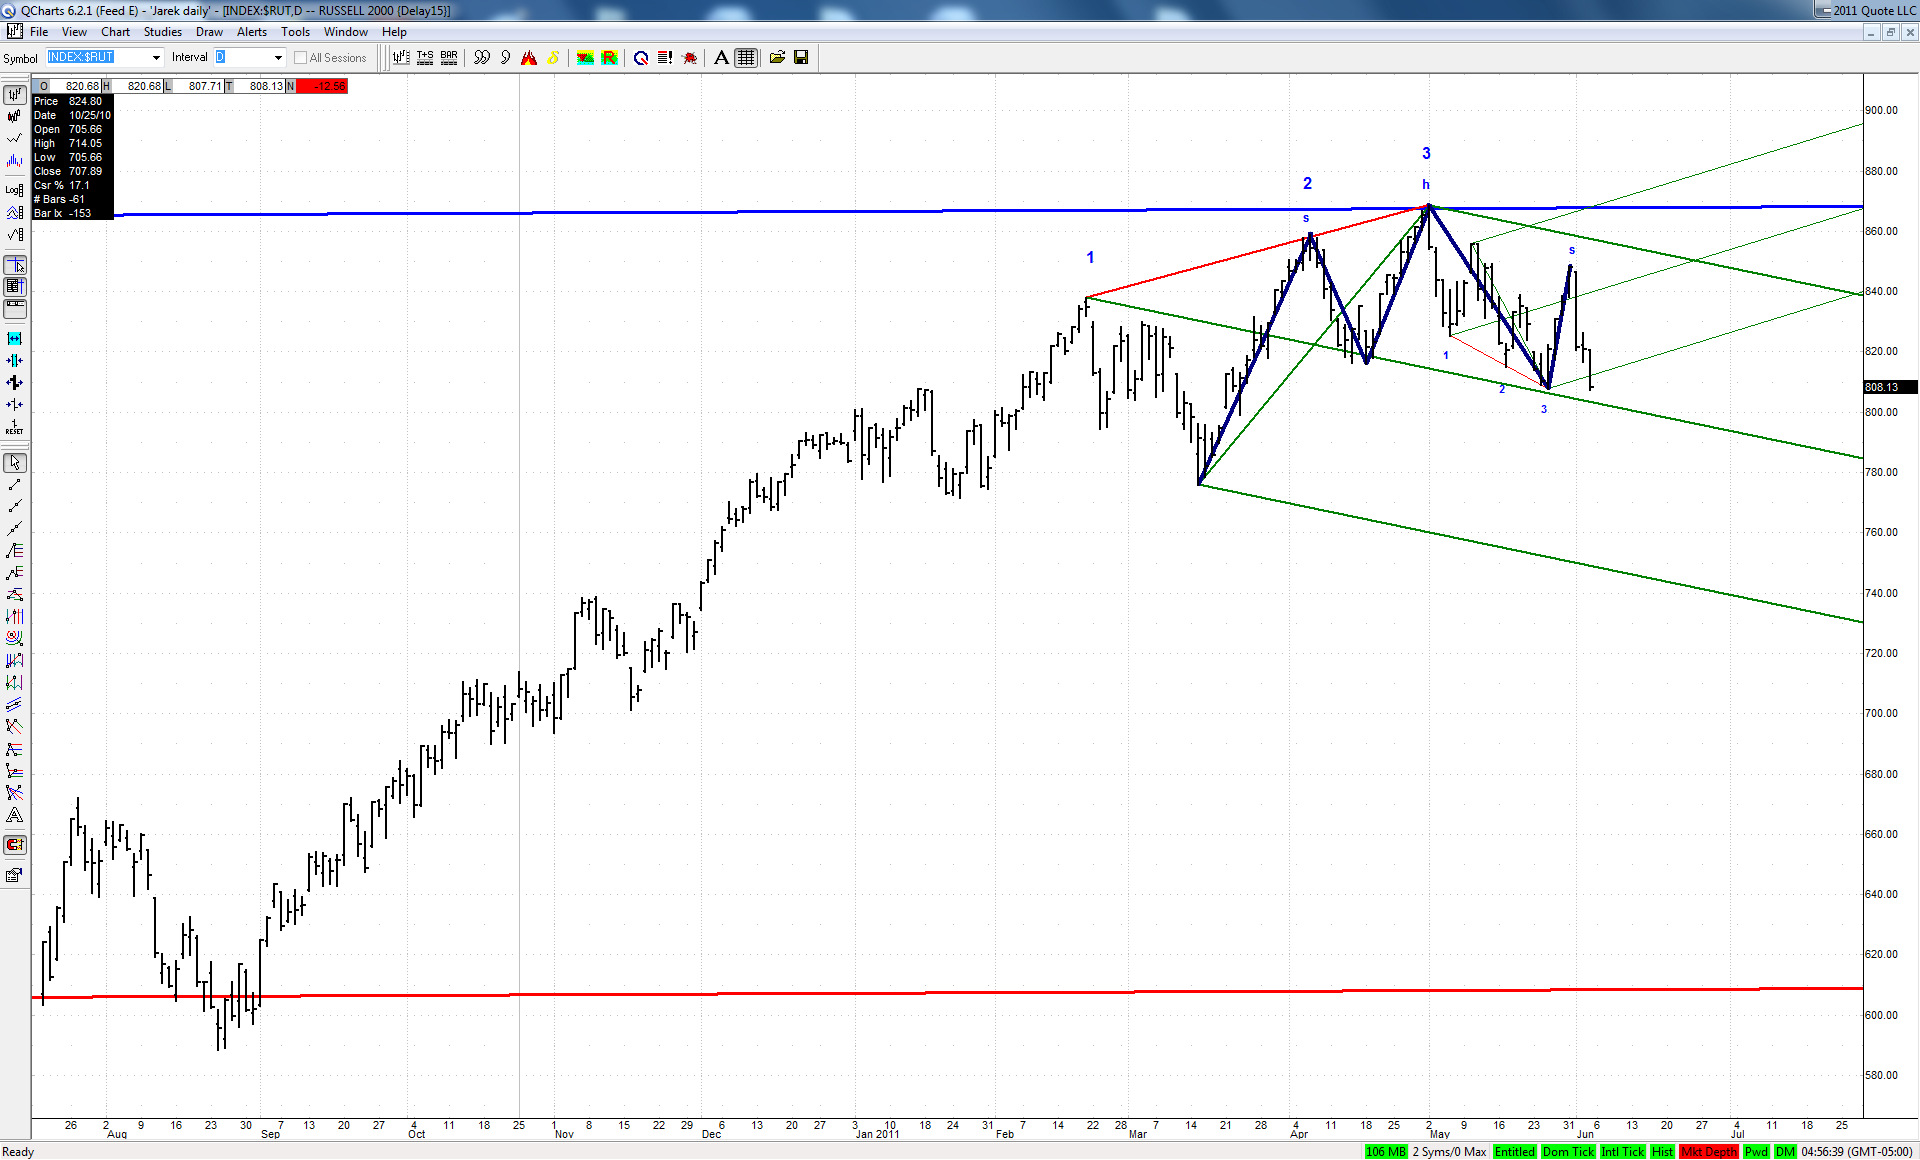
Jim suggested to take a look at daily charts of some secondary indexes and here is my current $RUT chart:
The green ML of a set based on big bearish 3D happens to be also a neckline of a classic head and shoulders. If bulls would not be able to defend this line next week, then a move to the lower ML should follow. This would also be a perfect fulfillment of a successful H&S pattern.
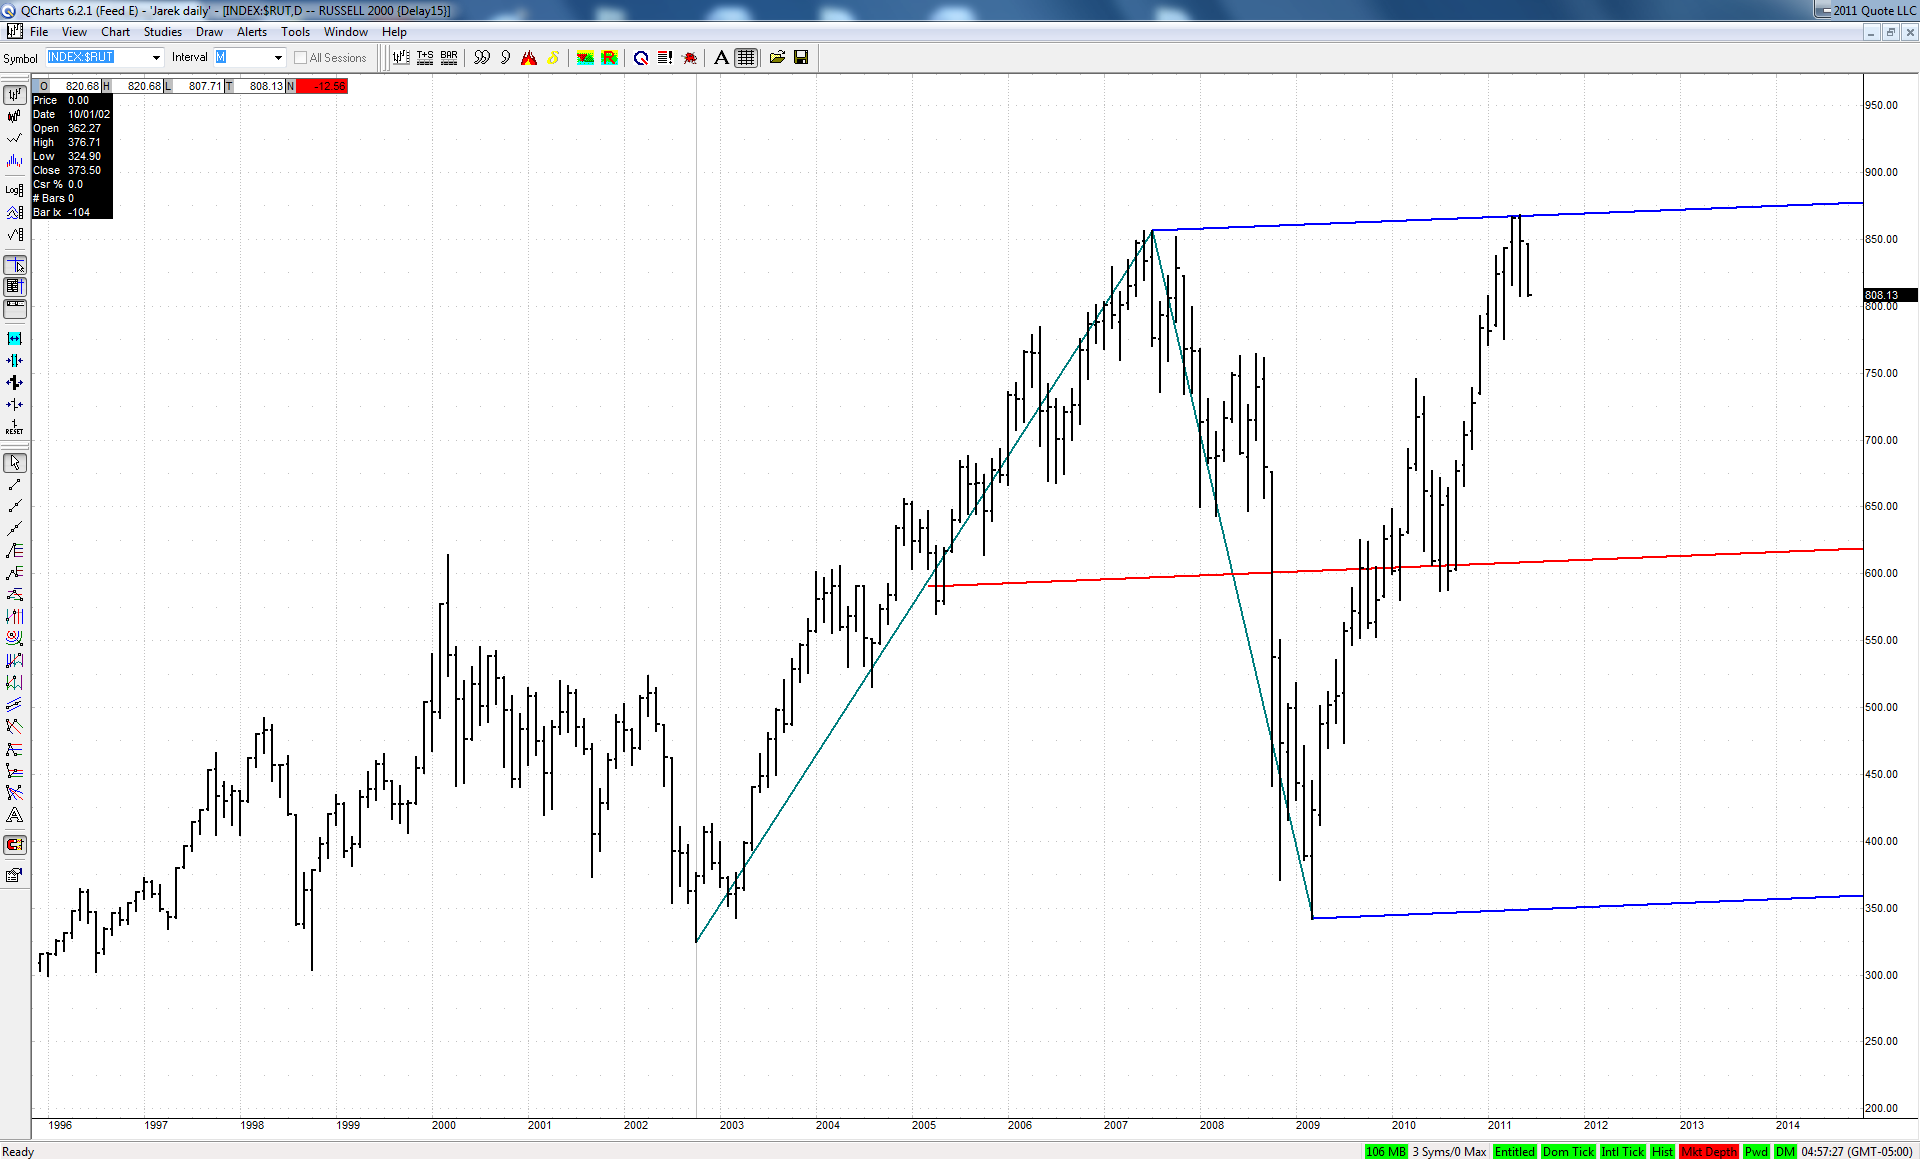
It is all the more interesting as this big bearish 3D fell dead on at the upper ML of a quite important set:
JI
jimkane
Rep: 3,058
Posts: 33,089
Hmmmm, not rising. Red alert!!!
Originally posted by jimkane
ES up now? I just mean on the tick chart/1-min.
JI
jimkane
Rep: 3,058
Posts: 33,089
It may just want to chop. But, watch for a vicious snap trap, too. Something is brewing.
JI
jimkane
Rep: 3,058
Posts: 33,089
The price action in here is very 'odd' to me. Again, something is brewing, and I don't think it's just chop/low volume mid-day consolidation. Just a feeling.
JI
jimkane
Rep: 3,058
Posts: 33,089
Like I said, why are they making it look like it is about to go up??? Because they are about to run it down?
Originally posted by jimkane
ES looks ready to explode up. I'm wondering what that means?
JI
jimkane
Rep: 3,058
Posts: 33,089
Back to the TL. Now, watch closely. Clue time. Bounce? Break and then snap back? Break and 'backtest' from below? Break, backtest, then snap up trap? Flush? And so on. Clues. Games.