MyPivots
Sign In
JA
jarek
Rep: 94
Posts: 3,474
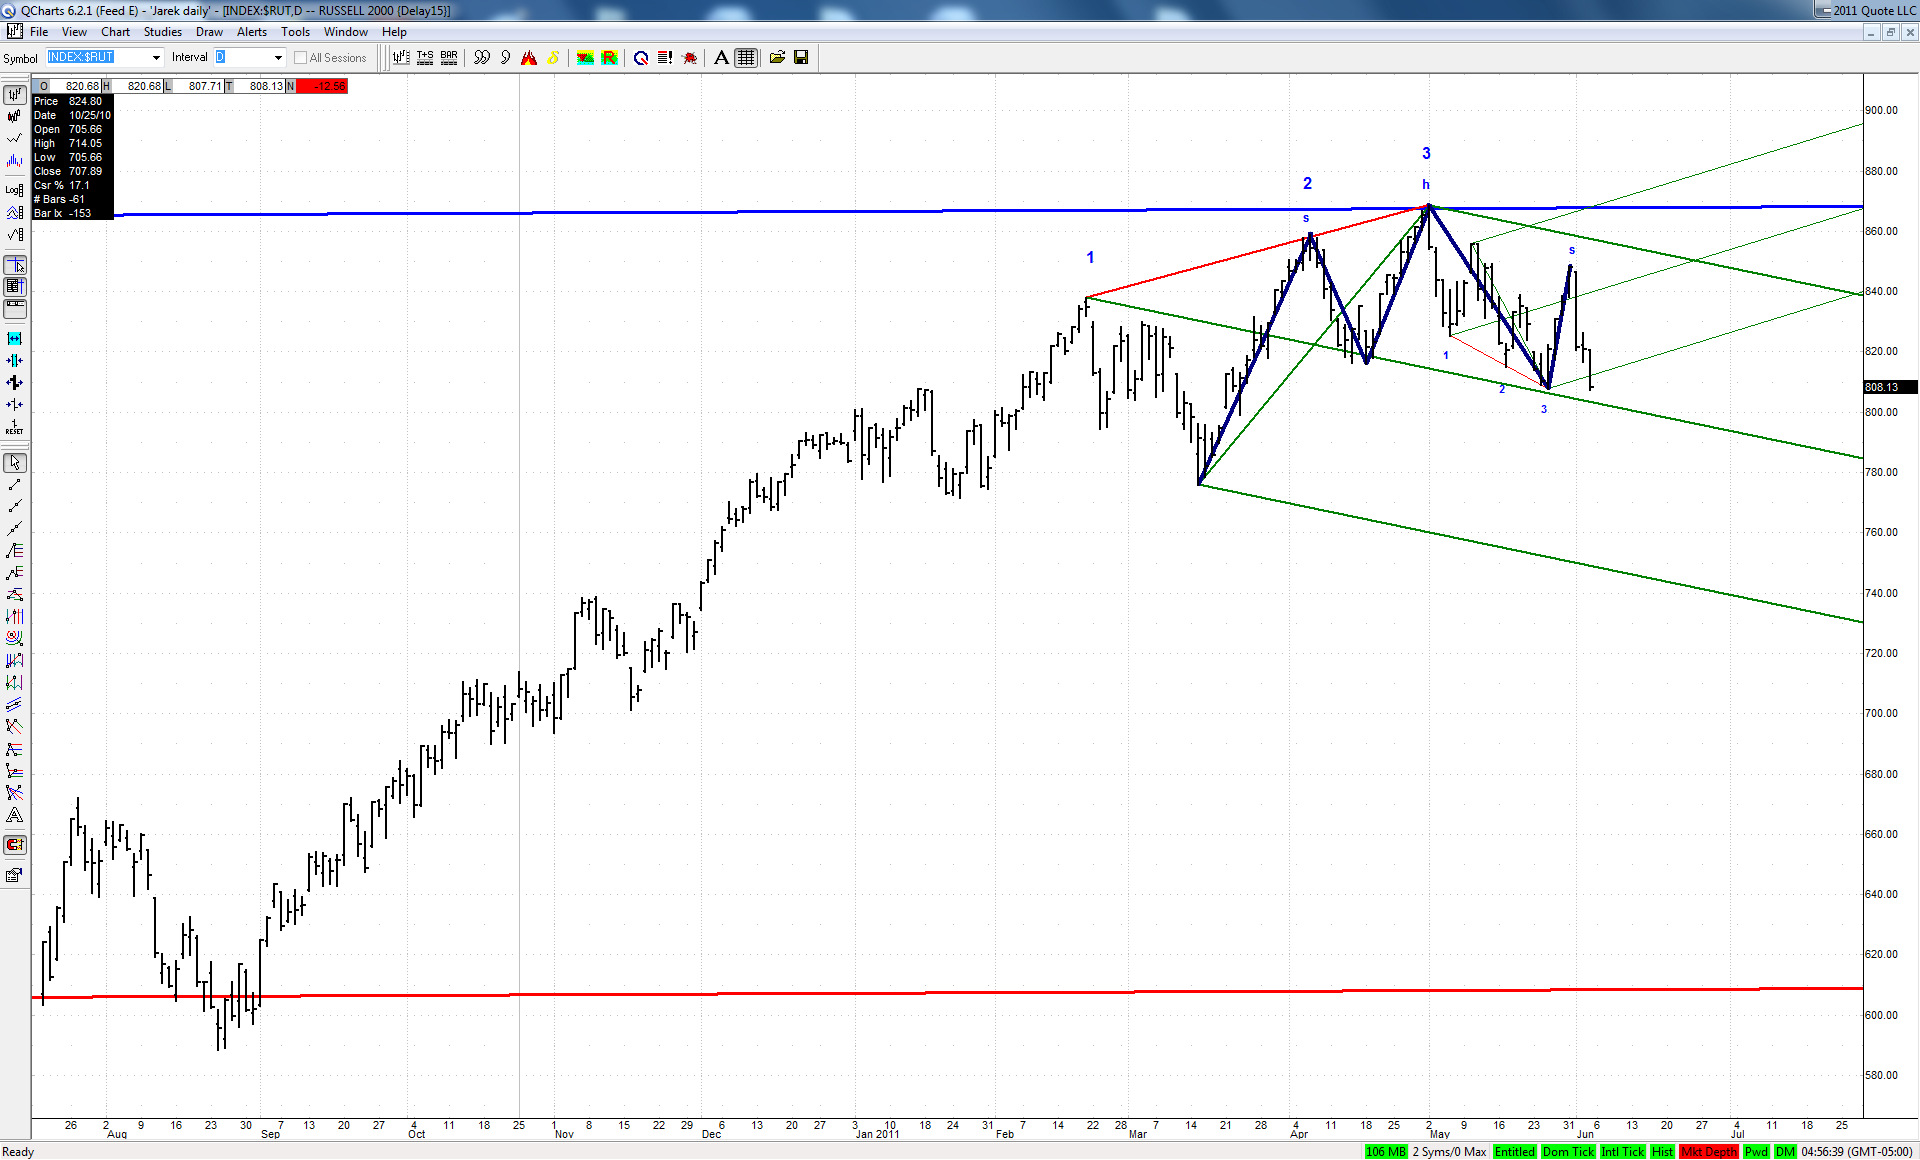
Jim suggested to take a look at daily charts of some secondary indexes and here is my current $RUT chart:

Click image for original size


The green ML of a set based on big bearish 3D happens to be also a neckline of a classic head and shoulders. If bulls would not be able to defend this line next week, then a move to the lower ML should follow. This would also be a perfect fulfillment of a successful H&S pattern.
It is all the more interesting as this big bearish 3D fell dead on at the upper ML of a quite important set:

Click image for original size
JI
jimkane
Rep: 3,058
Posts: 33,089
Gotcha, you oinker. Gotcha!


Posted-06/09/2011 : 15:15:22

Originally posted by jimkane

And, if it sold, it could be right from this exact spot...


Posted-06/09/2011 : 15:17:09

Originally posted by jimkane

Okay, perhaps worth a shot here, but I'd expect a reversal and grind up and stop out with too high a probability to be really comfortable with...
JI
jimkane
Rep: 3,058
Posts: 33,089
Sometimes, as I've said many times, discomfort is part of the game...
RA
rat89
Rep: 0
Posts: 7,015
nope.....
JI
jimkane
Rep: 3,058
Posts: 33,089
Die, you pig! Die! This one took a few stabs at it, and/or a very thick skin. But it finally couldn't hack the area. I really didn't think they'd give up any of those 'risk on' gains, so I was near certain this would be a stop out. But, no matter how uncomfortable it is, one has to follow the plan and take the signals, I think.
JI
jimkane
Rep: 3,058
Posts: 33,089
.382/.447 overlap at key line stopped this dead. What a shocker.
JI
jimkane
Rep: 3,058
Posts: 33,089
http://www.zerohedge.com/article/pimco-still-short-us-treasurys-changes-reporting-methodology-treasury-exposure-has-85-billio

Poor Bill, what a chump he is. What is most noticeable is not that he is net short now, it's what his exposure was when it peaked in summer of '10, and how he has been relentlessly selling from approaching $300 billion, to net negative. Just relentlessly selling for about a solid year.

During that time treasuries rose spectacularly, sold off spectacularly, and are now rising again spectacularly. Now look at the graph of his selling of his net long position. Relentless selling with no regard whatsoever for whether the market was rising or falling strongly. See? He is playing an exposure game, not a short-term trading game. Like I said, in the long run, he'll always win, in my opinion.

If his normal exposure is long almost $300 billion, and he's now net short maybe $10 billion, with over a trillion in total assets under management (not in this fund, in total at Pimp-Co), what difference do the current swings in the ZN or ZB matter to him? Less than absolutely zero. Think about it.

Even as a simple calculation (it wouldn't be, he may be doing swaps, there may be leverage involved, and so on ...), if he had $10 bil on $1 tril, that's a 1% position. If the ZN moved 12 full points against him, that's a 10% move. 10% of 1% is 0.1%. Wow, if the ZN smokes up 12 full points against him he may be down 0.1% in total. Whew, I bet he's sweating it big time.

This guy never loses, overall. And when bonds finally collapse, he won't be thinking about that $10 bil short, he'll be thinking about the near $300 bil exposure he sold into a market that was happy to take it from him. That's his play of the century. Just my humble opinion.
JI
jimkane
Rep: 3,058
Posts: 33,089
This is just amazing. This market is soooooooooo broken. One of these days there is going to be an epic flash crash disaster that makes the 'big one' we had last May seem like nothing. The third installment is where it gets really 'odd'.

http://www.zerohedge.com/article/presenting-natgas-fractal-algo

http://www.zerohedge.com/article/fractial-limit-order-buster-latest-market-manipulation-algo-gimmick

http://www.zerohedge.com/article/story-berserk-nat-gas-algo-just-got-really-strange
JI
jimkane
Rep: 3,058
Posts: 33,089
Major levels in ES. These come from higher timeframes (not all the same timeframes, either, so tolerance levels (grouping widths) are not the same). I will not give the total groupings, just the center area, for the last two. I can pinpoint those levels better as they get closer. This is just in case roofer's read plays out and we dump (oh, please, oh, please...).

1260-67

1242-47 (maybe 49)

1207

1161
JA
jarek
Rep: 94
Posts: 3,474
There was no pattern at yesterday's high, but the line in September contracts was obvious:

Click image for original size
JA
jarek
Rep: 94
Posts: 3,474
Checkback after hitting ML? Just to the closest Kane Zone... :

Click image for original size
RA
rat89
Rep: 0
Posts: 7,015
it might have to, and we'll find out soon


Originally posted by tx_ches

I could certainly see it going lower though.