MyPivots
Sign In
JA
jarek
Rep: 94
Posts: 3,474
Jim suggested to take a look at daily charts of some secondary indexes and here is my current $RUT chart:

Click image for original size
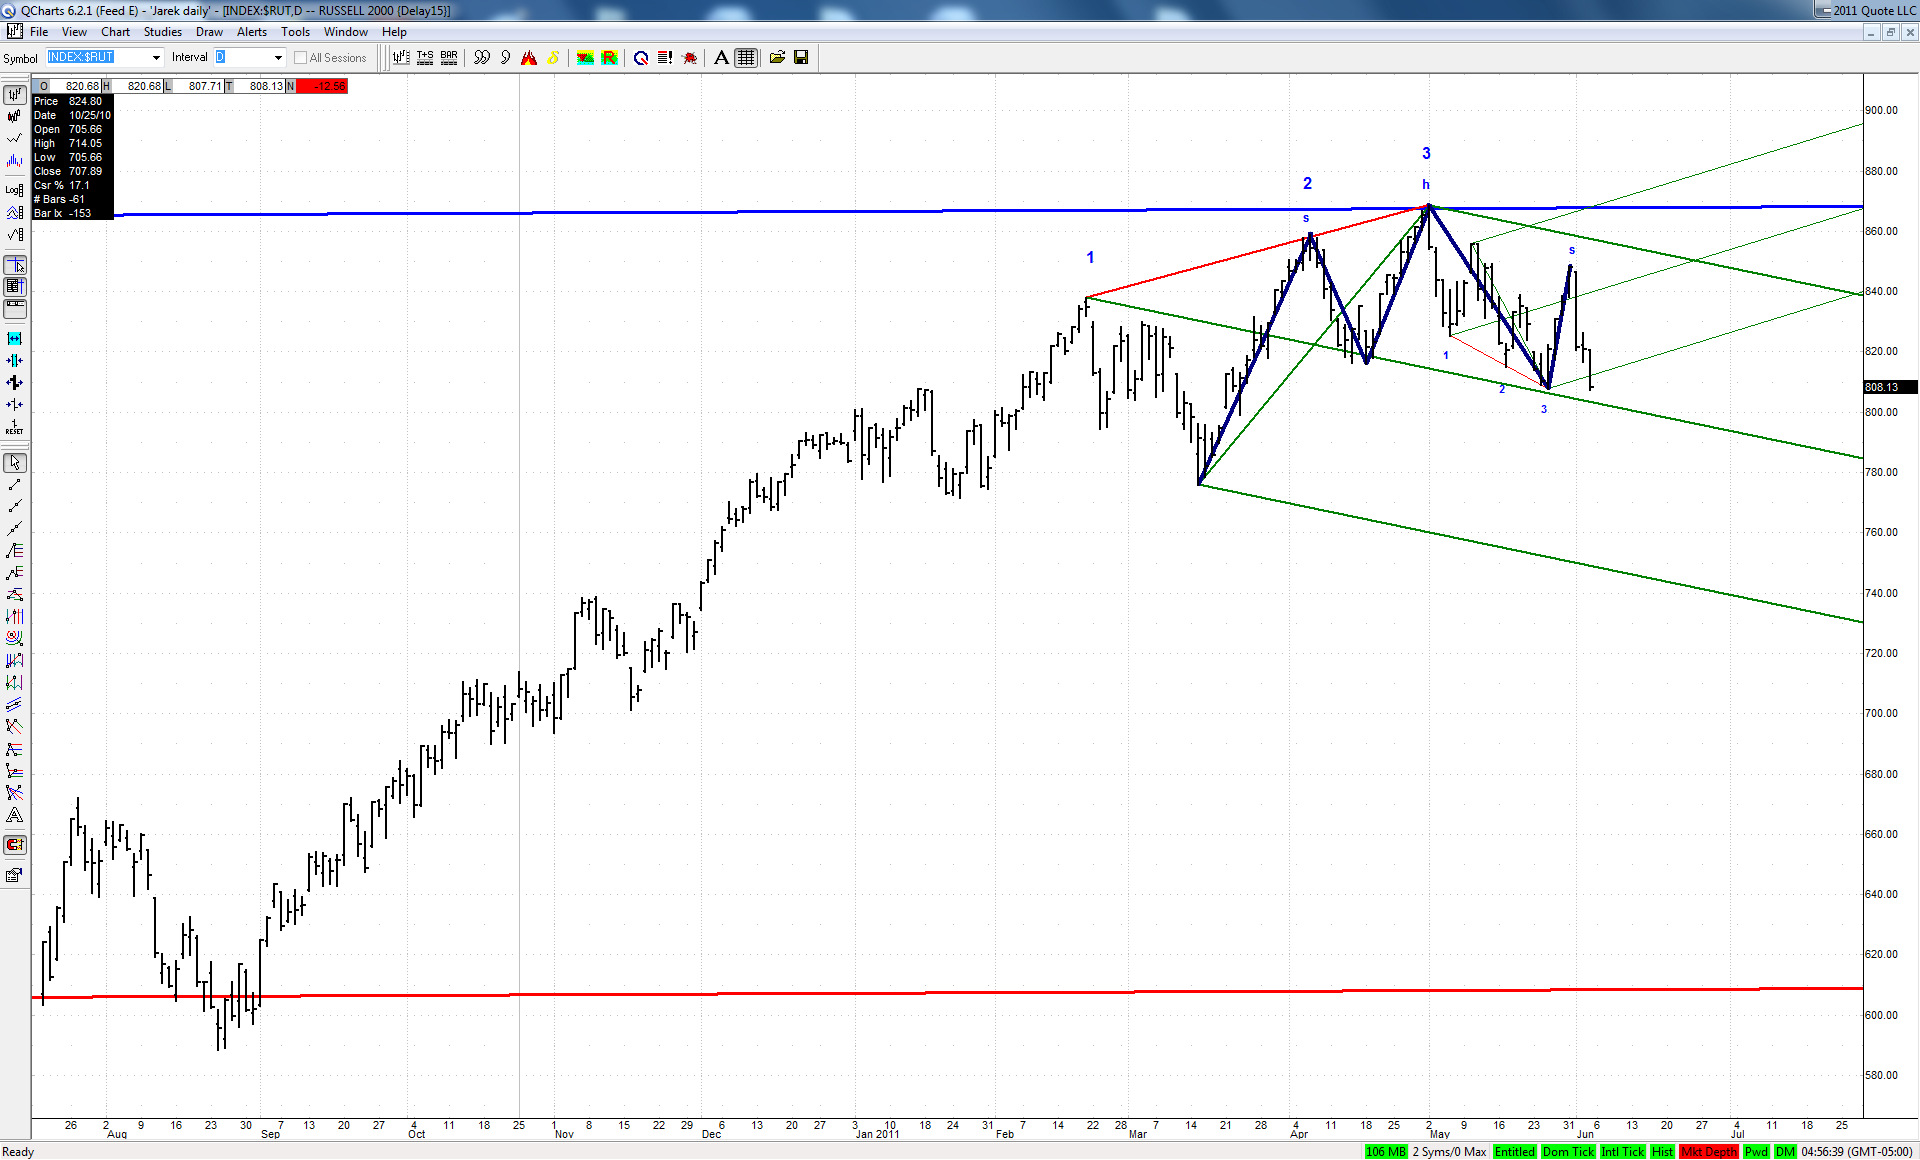

The green ML of a set based on big bearish 3D happens to be also a neckline of a classic head and shoulders. If bulls would not be able to defend this line next week, then a move to the lower ML should follow. This would also be a perfect fulfillment of a successful H&S pattern.
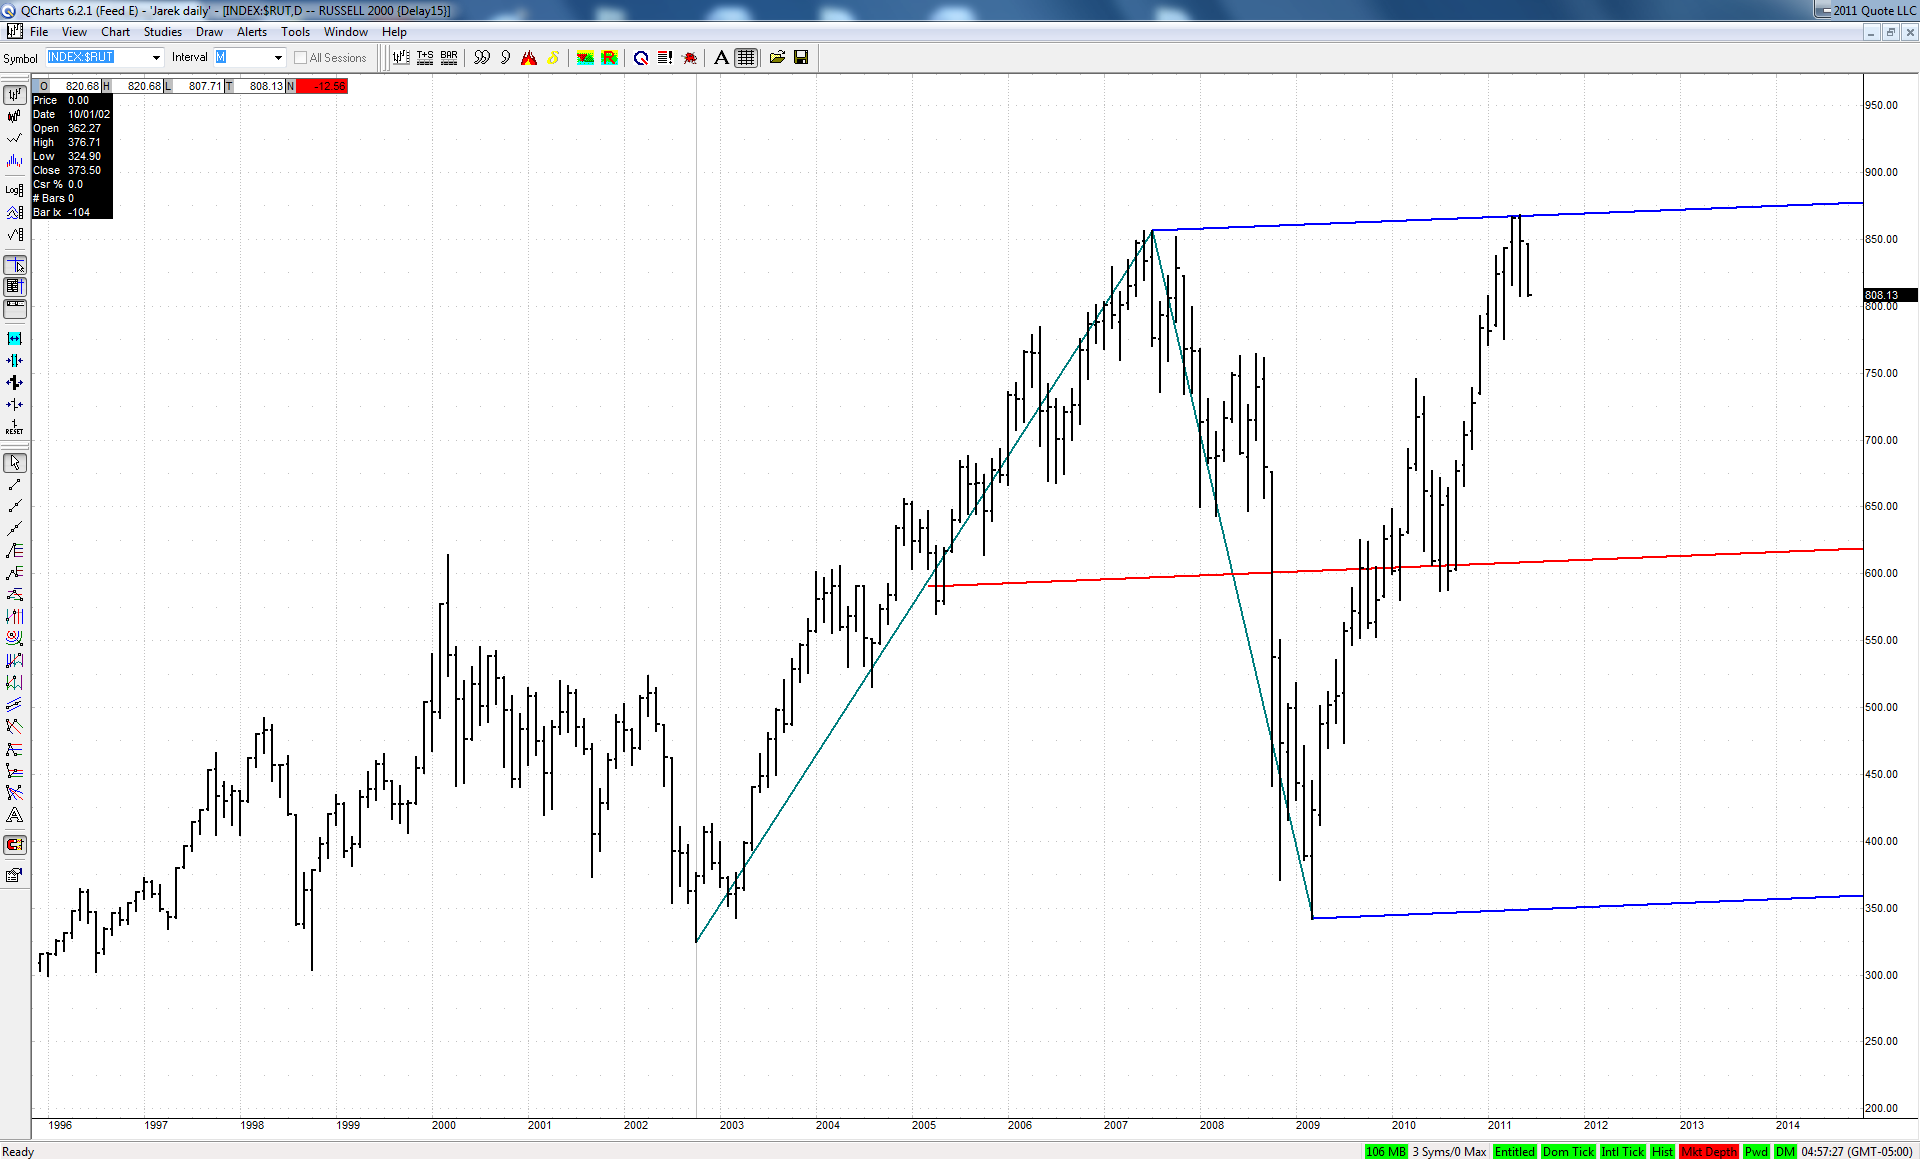
It is all the more interesting as this big bearish 3D fell dead on at the upper ML of a quite important set:

Click image for original size
JI
jimkane
Rep: 3,058
Posts: 33,089
It sure doesn't like my line at that 86 area...
JI
jimkane
Rep: 3,058
Posts: 33,089
TL's here. Now we get a clue.
JI
jimkane
Rep: 3,058
Posts: 33,089
Now, something technically cool to see would be a rush to the 88 area from here.
JI
jimkane
Rep: 3,058
Posts: 33,089
I'm not saying they won't break it down from here, only that if it went to the 88 area from here, it would be doing something technically cool to me.
JI
jimkane
Rep: 3,058
Posts: 33,089
Three tests there of the two TL's and set line so far...
IS
iso
Rep: 0
Posts: 81
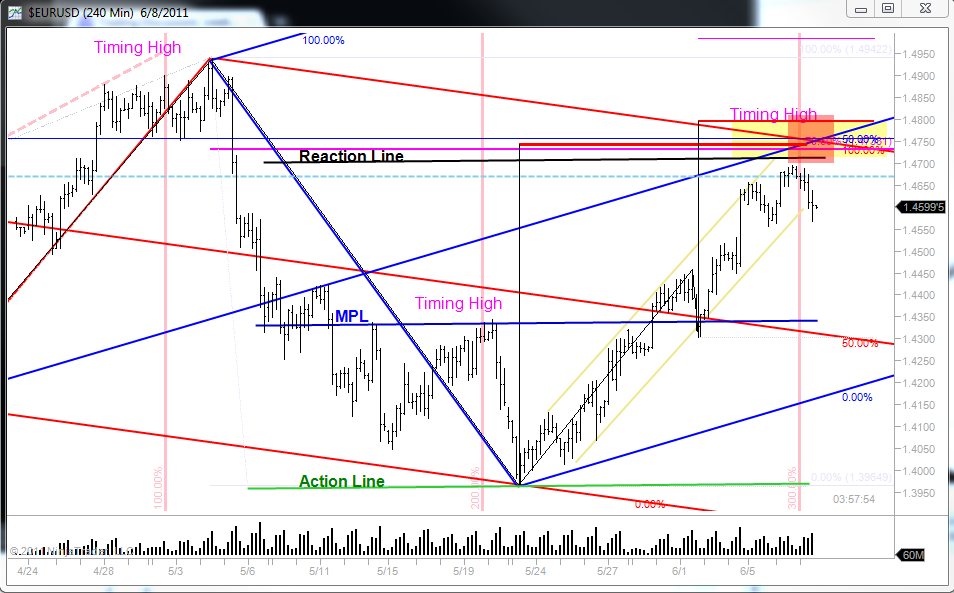
EURUSD update, hit the bottom of the price box and is in the timing box


Click image for original size
IS
iso
Rep: 0
Posts: 81
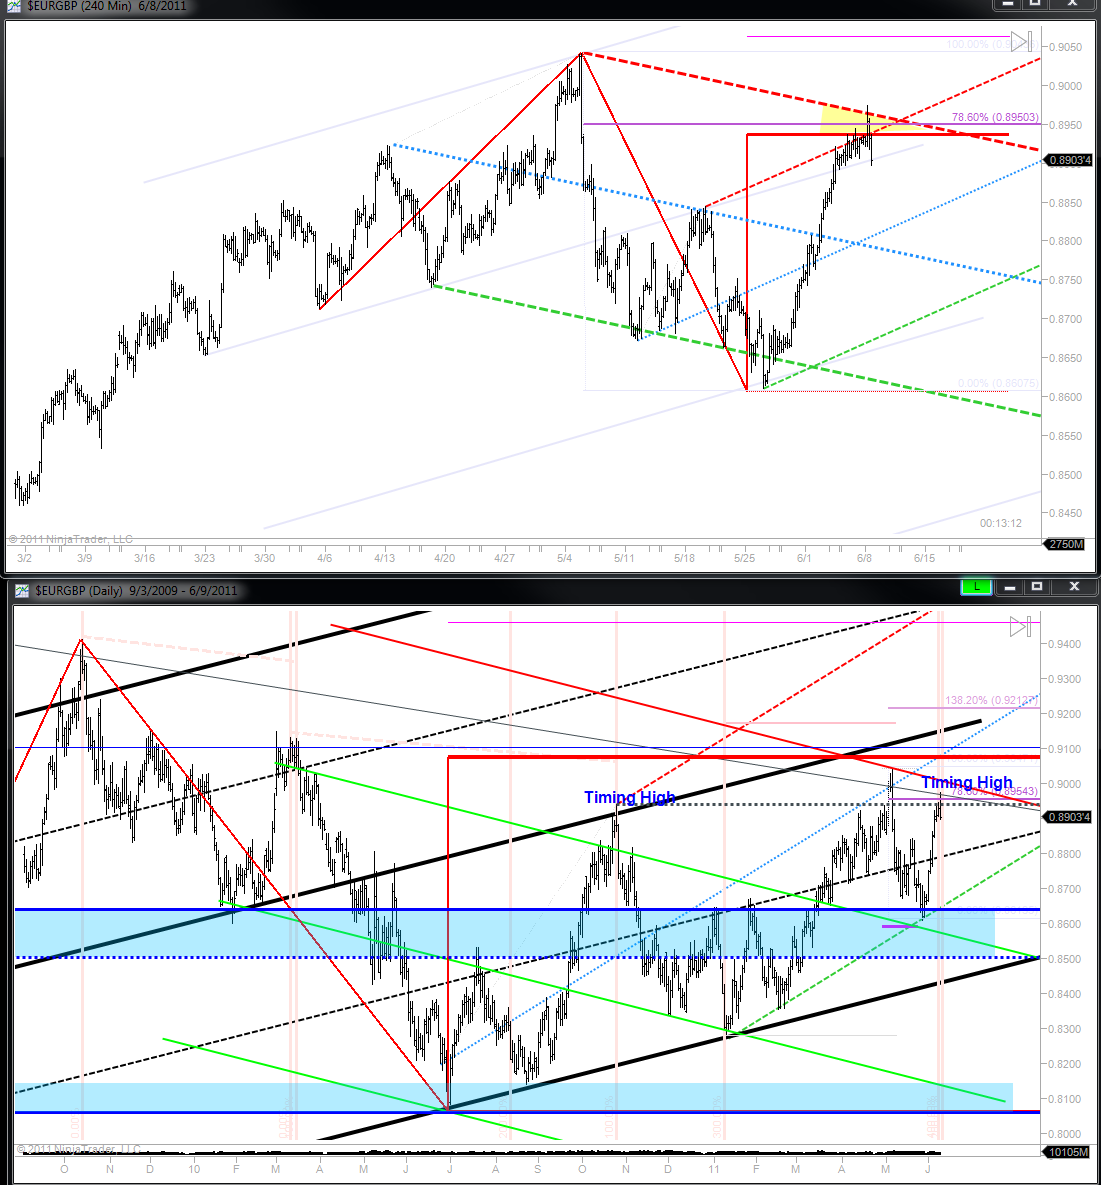
EURGBP hit price / time

Click image for original size
JI
jimkane
Rep: 3,058
Posts: 33,089
88 area: "Come to me. I'm waiting for you. Come to me..."
JI
jimkane
Rep: 3,058
Posts: 33,089
Right here at 85ish is a minor area it needs to overcome.
RA
rat89
Rep: 0
Posts: 7,015
sorry jim....what is the approximate spy equivalent at the 88 area?
RA
rat89
Rep: 0
Posts: 7,015
it might have to, and we'll find out soon


Originally posted by tx_ches

I could certainly see it going lower though.