MyPivots
Sign In
JA
jarek
Rep: 94
Posts: 3,474
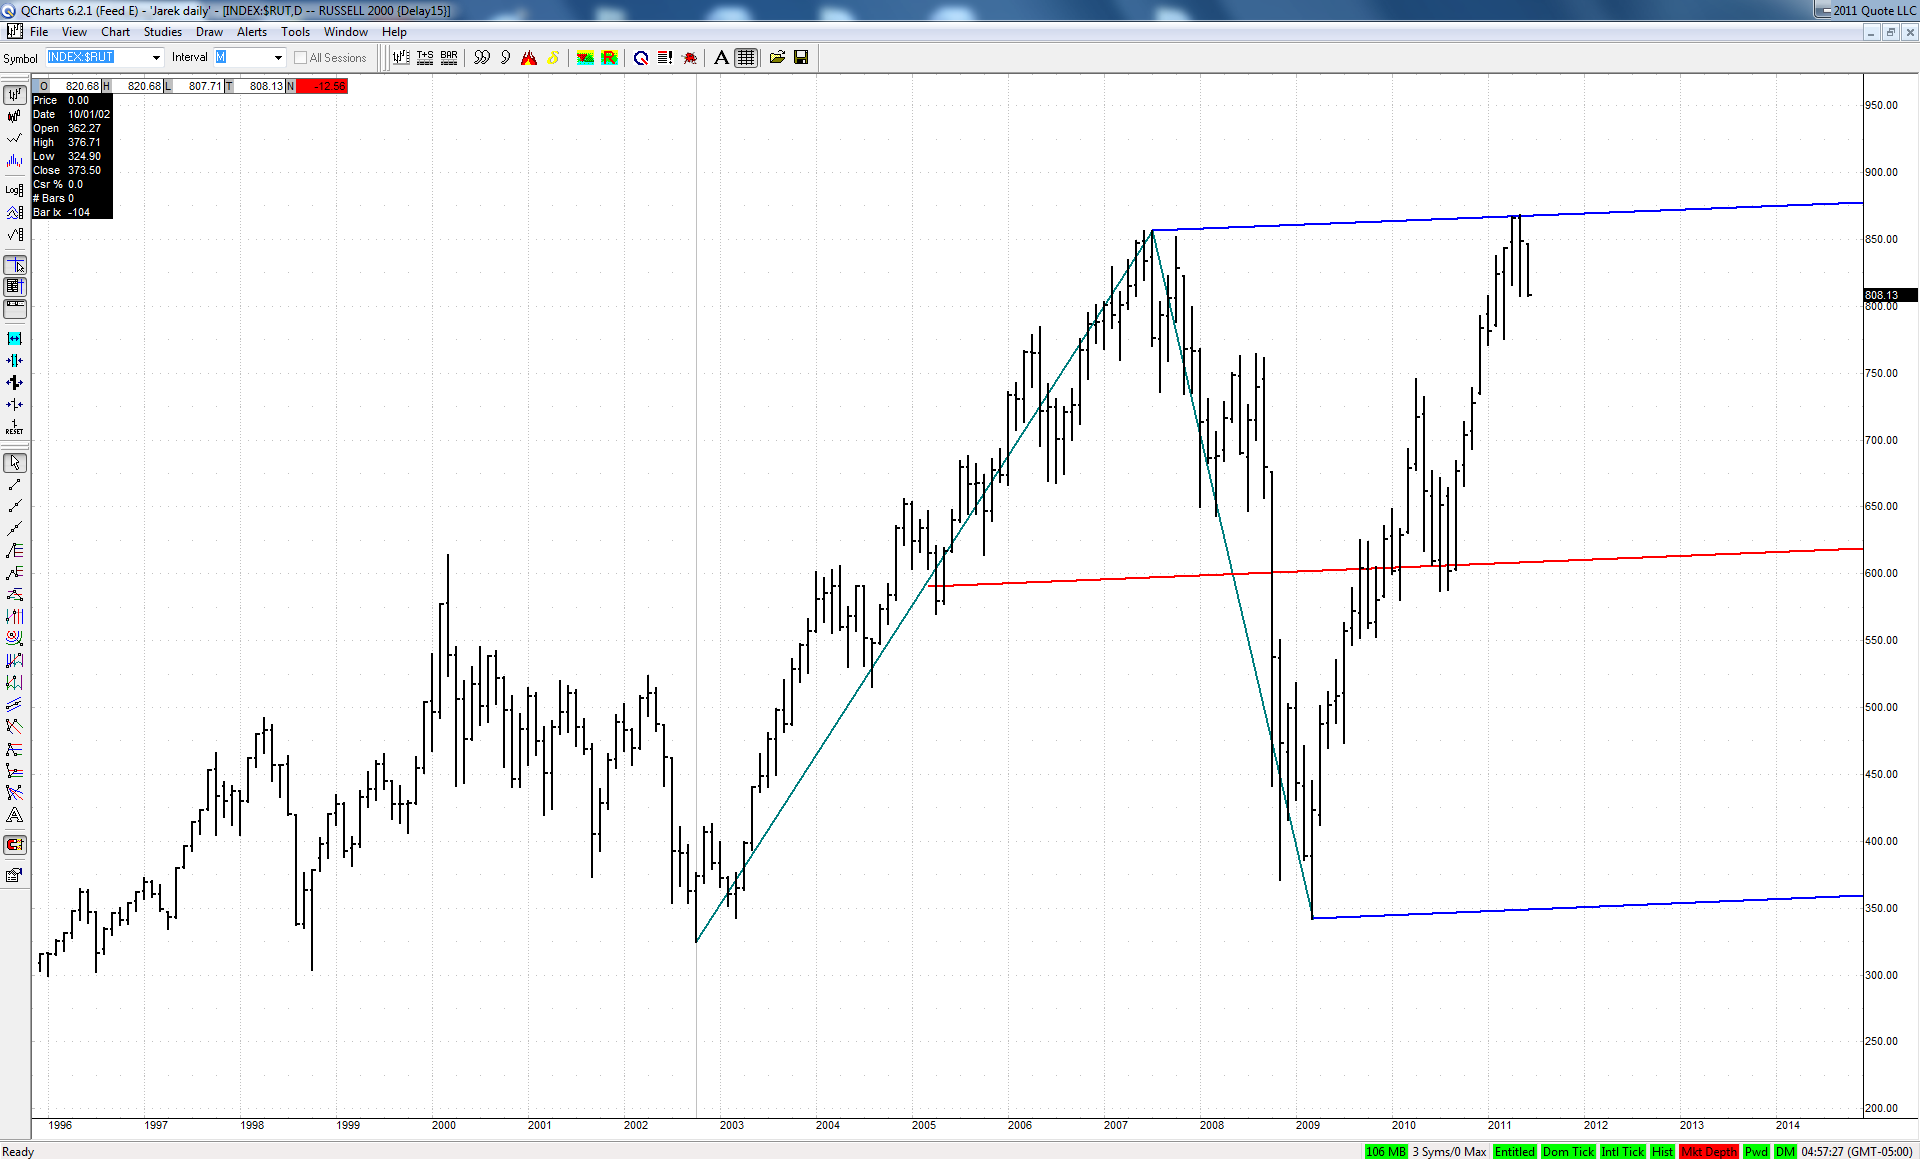
Jim suggested to take a look at daily charts of some secondary indexes and here is my current $RUT chart:

Click image for original size
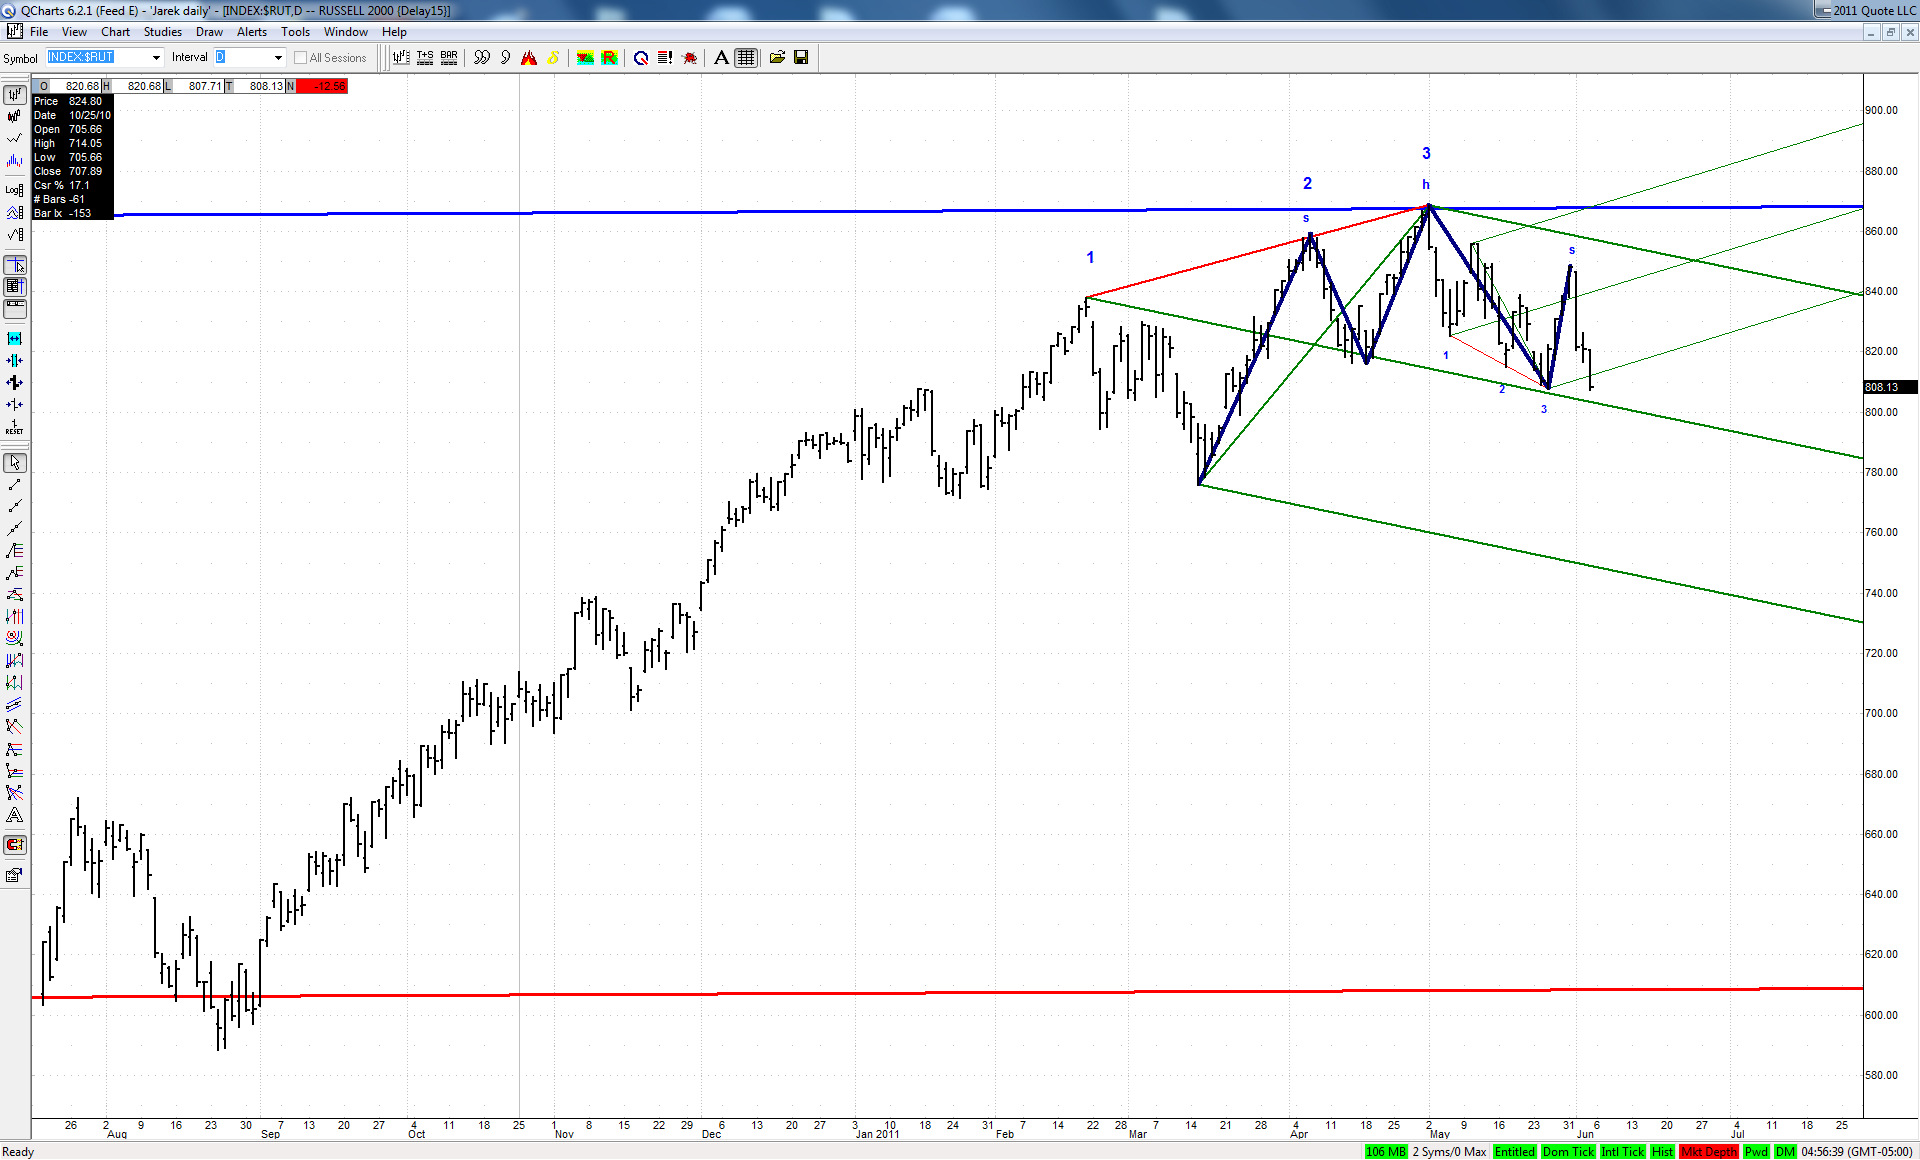

The green ML of a set based on big bearish 3D happens to be also a neckline of a classic head and shoulders. If bulls would not be able to defend this line next week, then a move to the lower ML should follow. This would also be a perfect fulfillment of a successful H&S pattern.
It is all the more interesting as this big bearish 3D fell dead on at the upper ML of a quite important set:

Click image for original size
JA
jarek
Rep: 94
Posts: 3,474
Originally posted by jarek

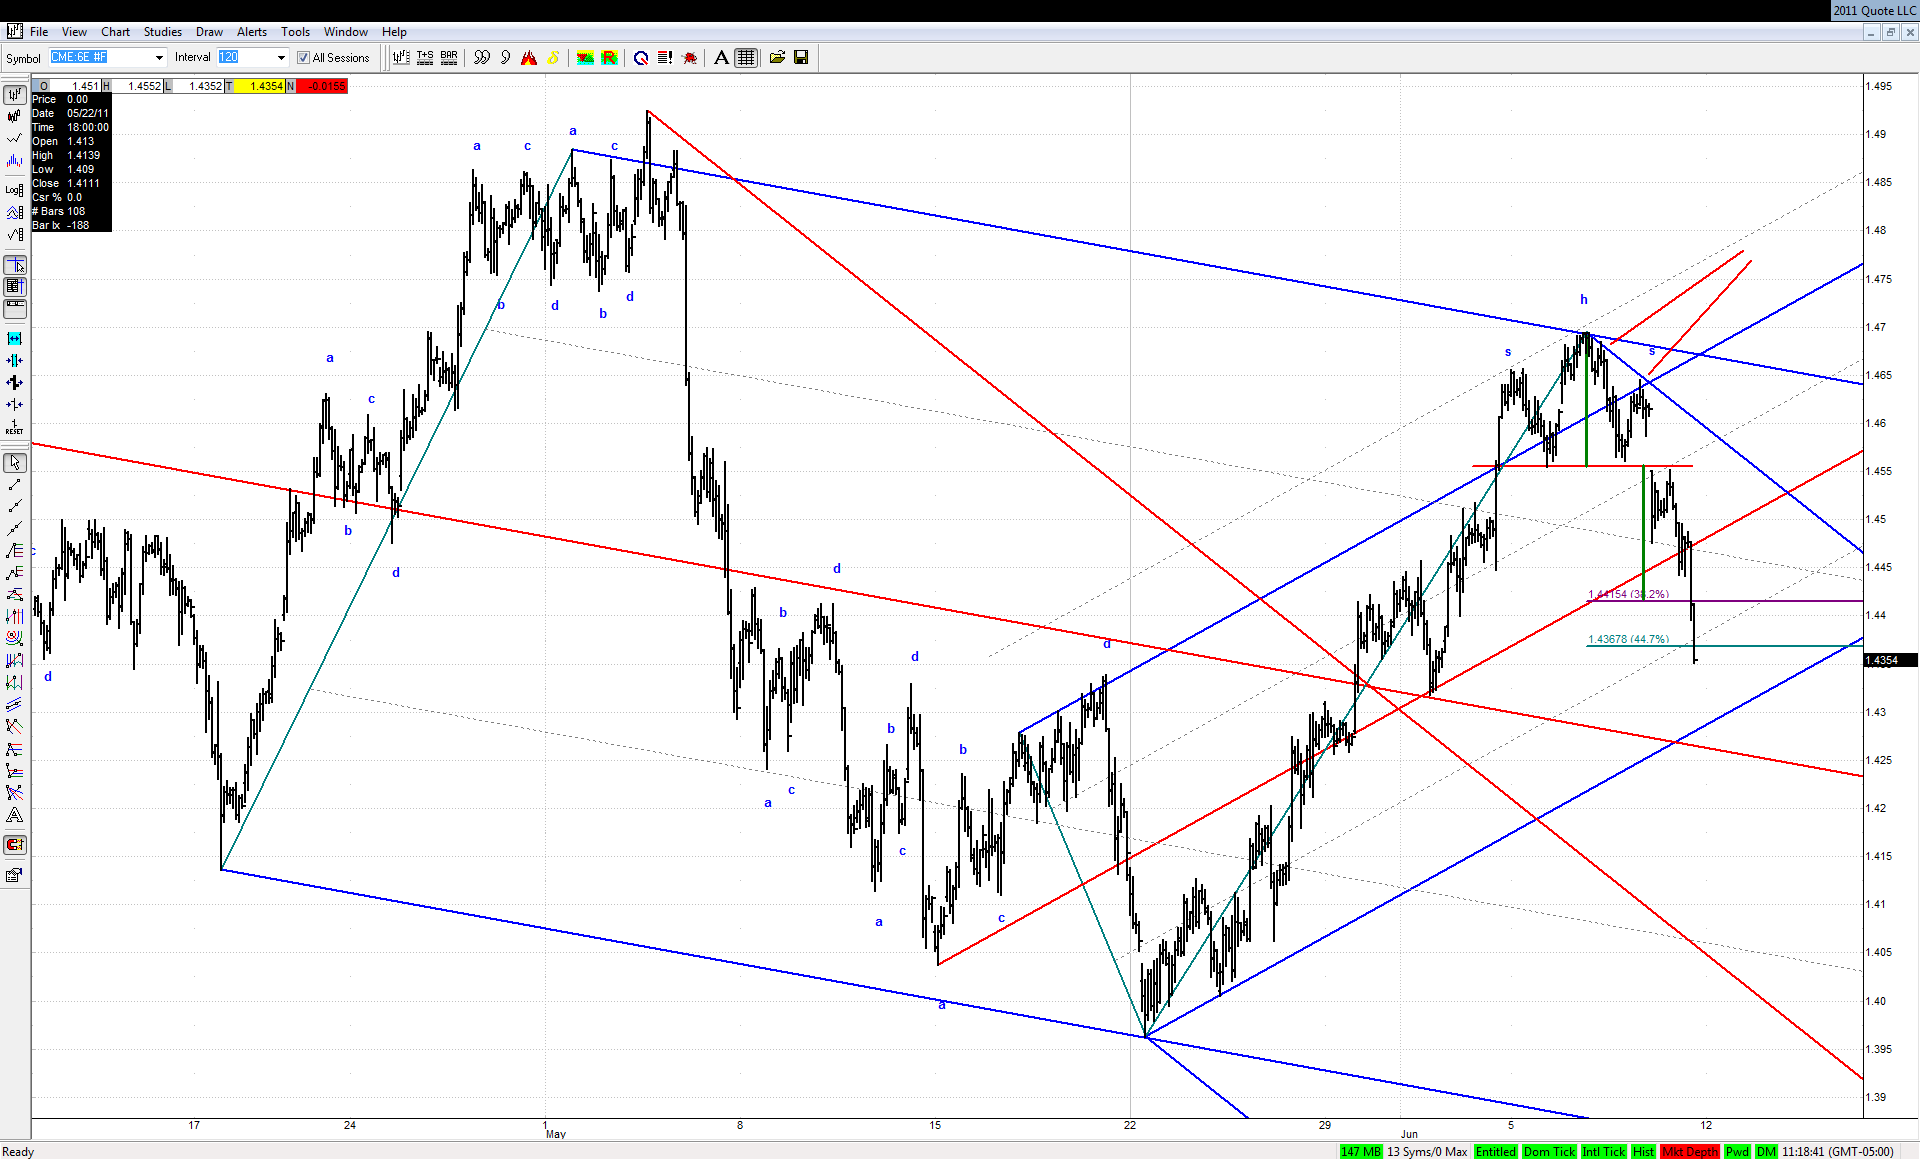
The minimum target for the move off H&S in EUR hasn't been met yet:

It went much beyond it with ease:

Click image for original size

And if there was a test and retest at upper ML and EUR is going for a major ML of this set, then King Dollar may be waking up from hibernation
JA
jarek
Rep: 94
Posts: 3,474
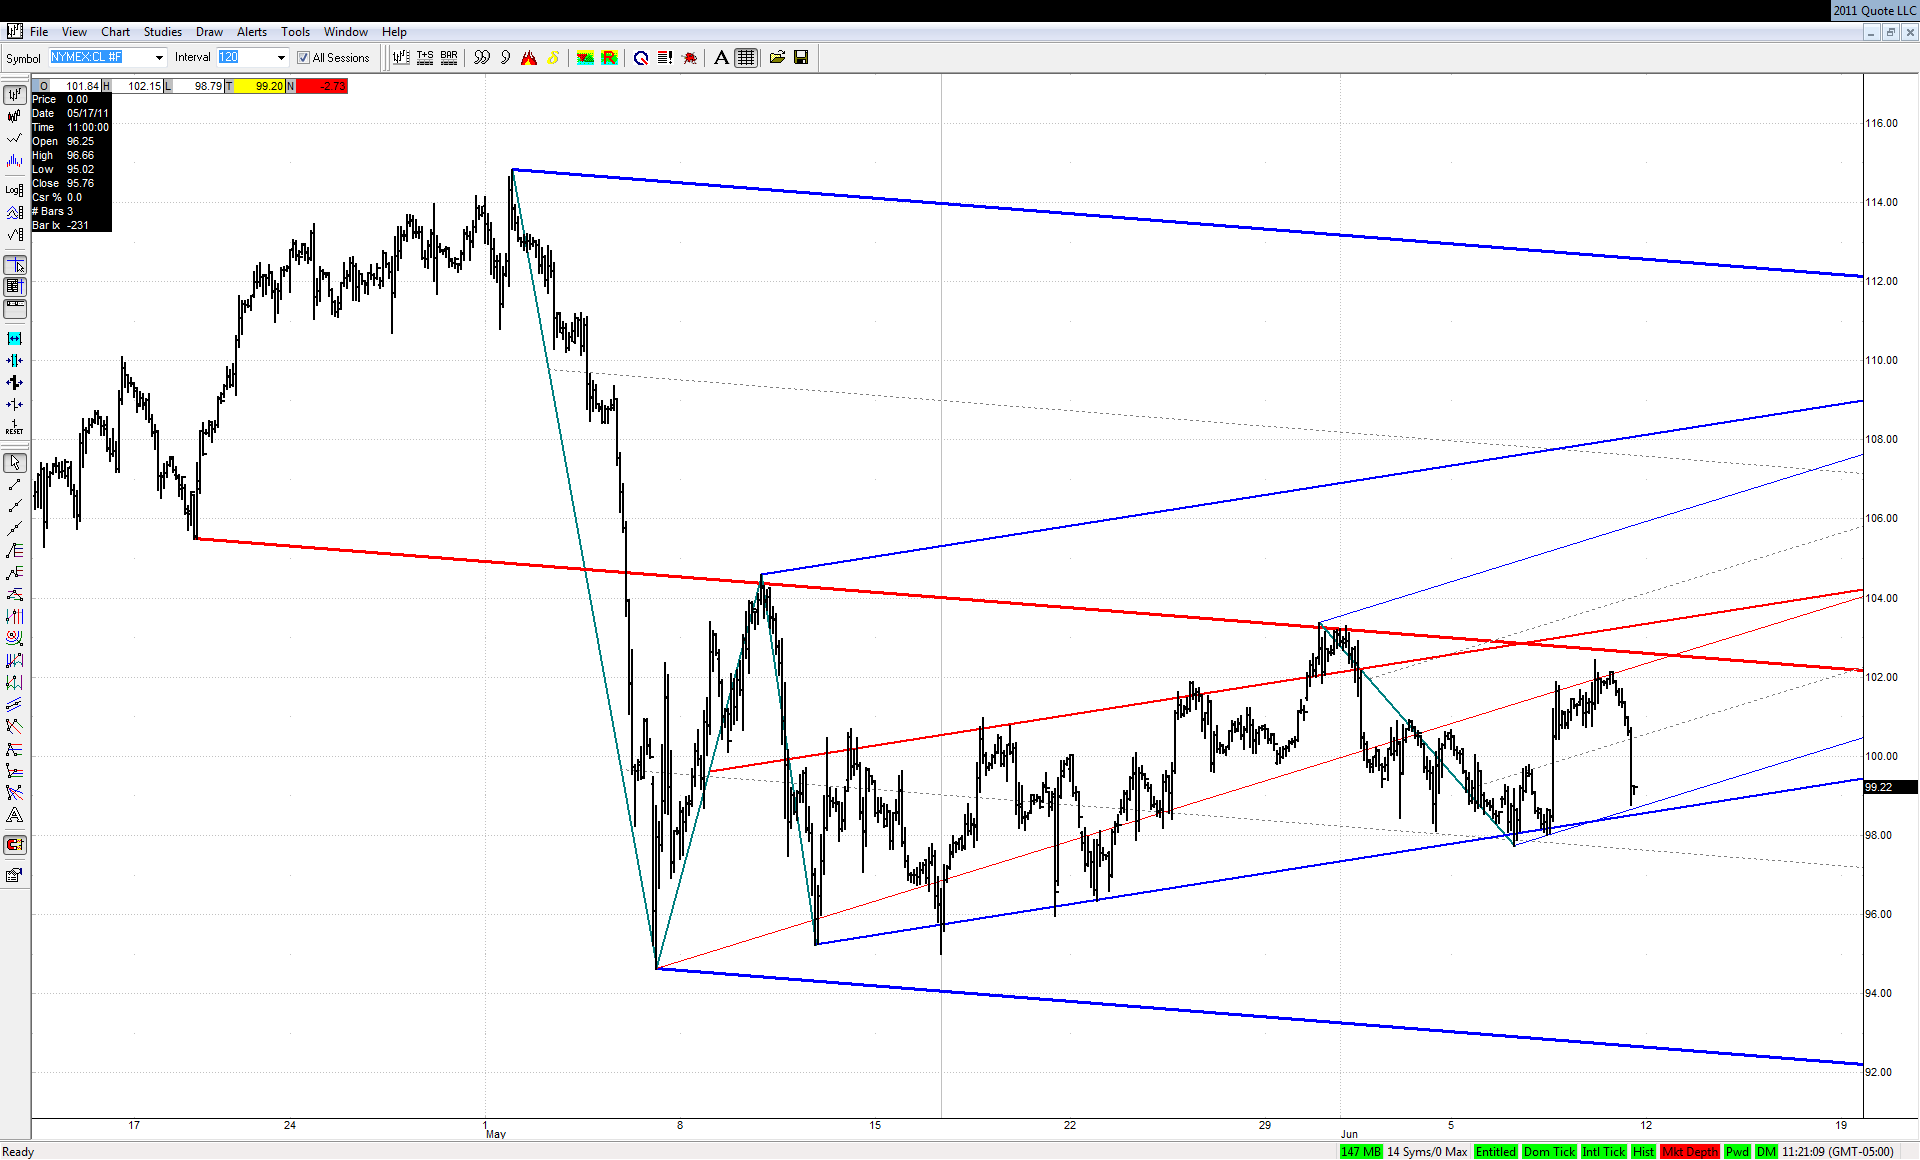
It was rather a quick journey to this all important price flow in Crude:

Click image for original size
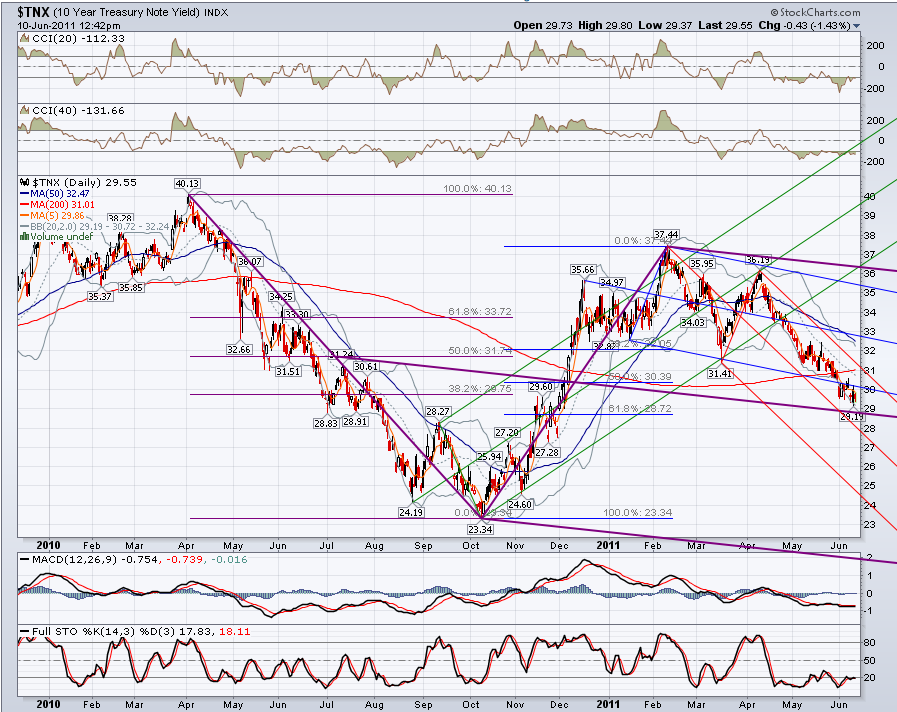

Will it hold this time around as well?
JA
jarek
Rep: 94
Posts: 3,474
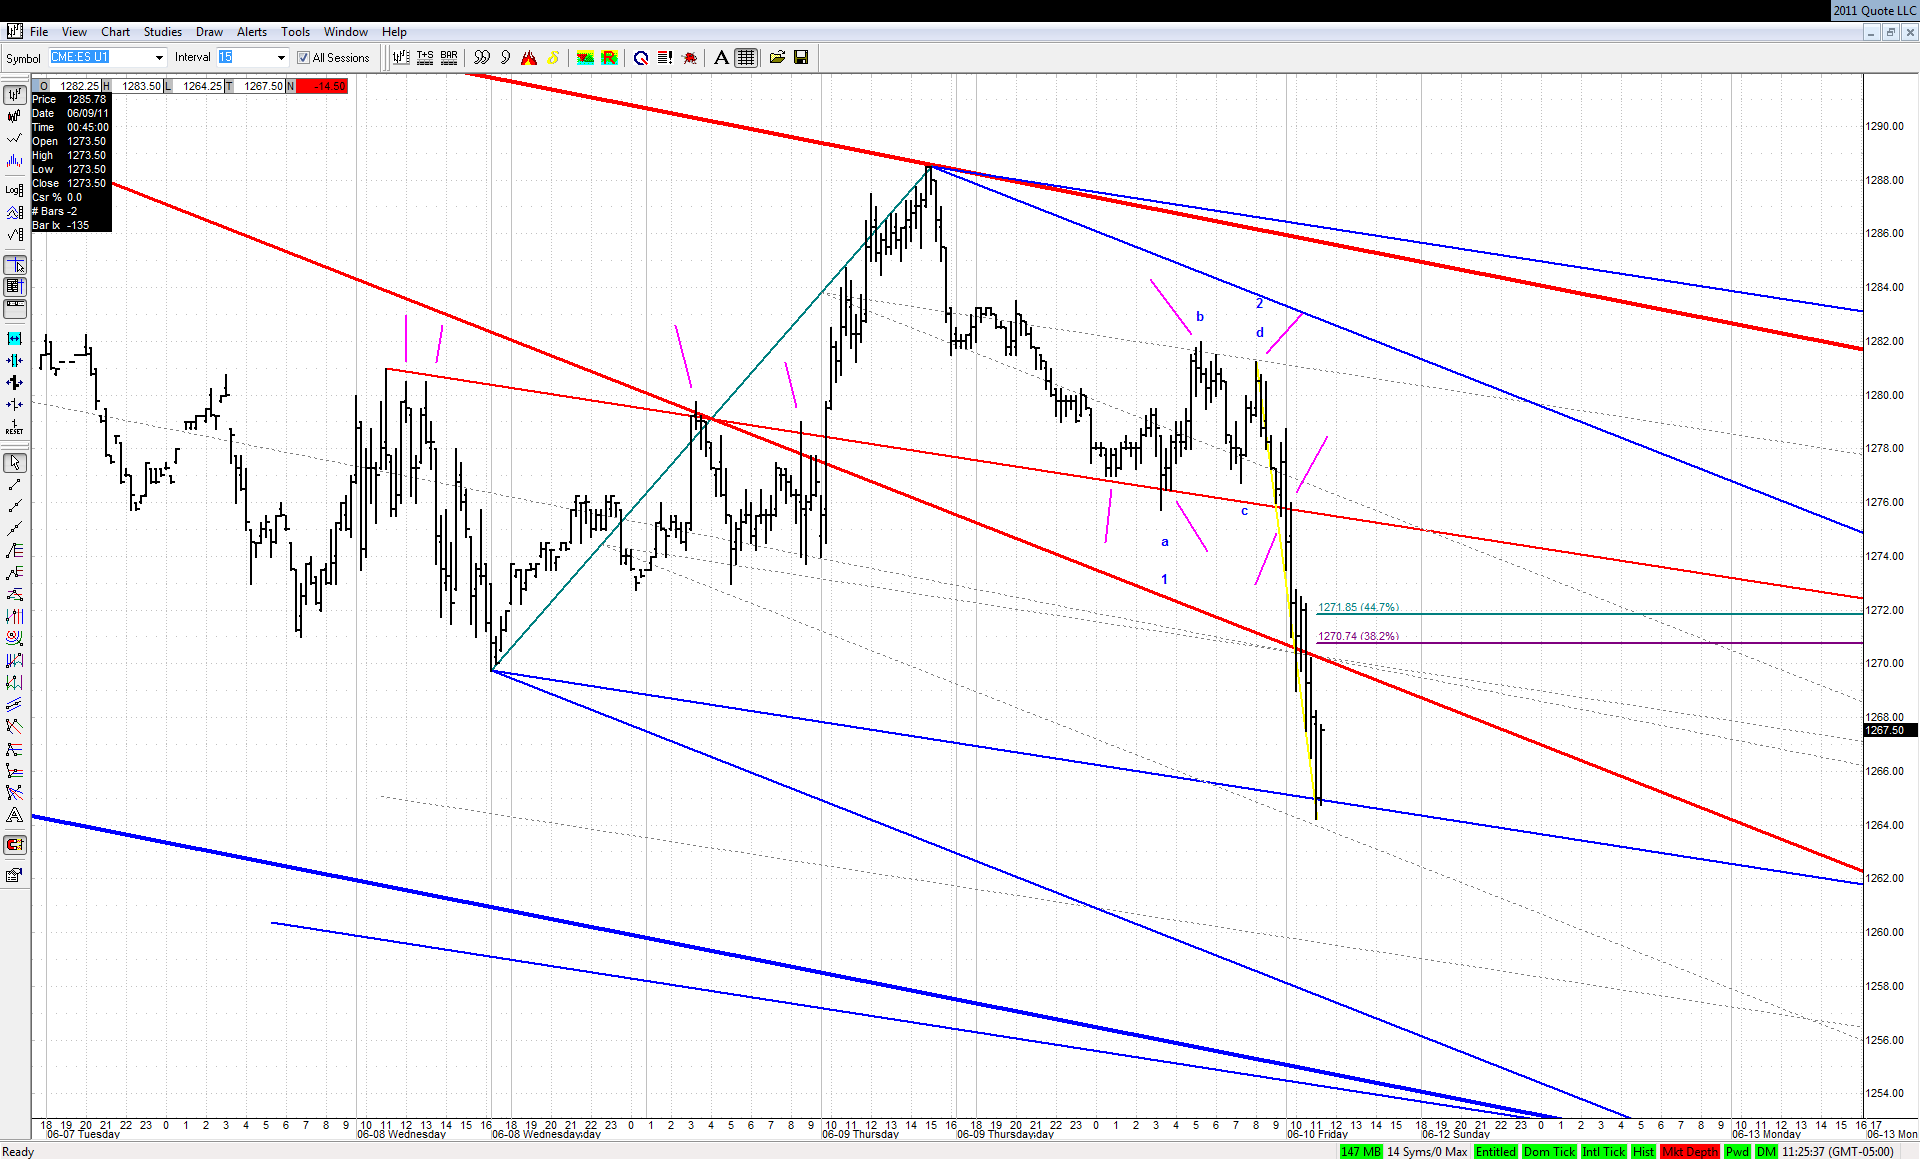
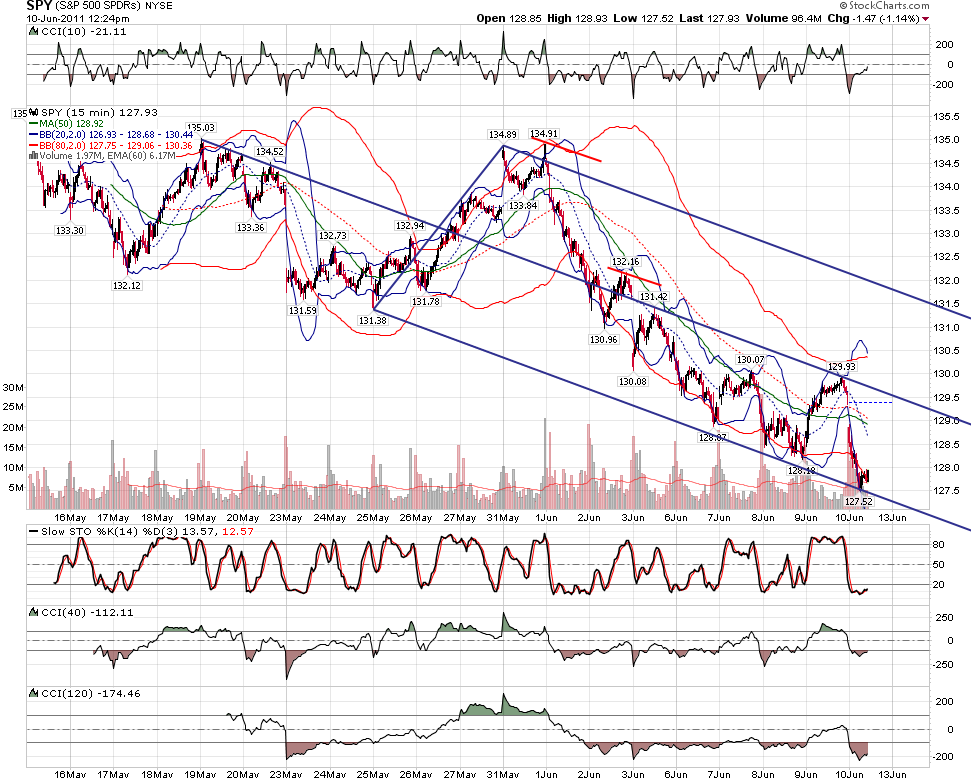
This set was so well respected in the last 2 days that no wonder ES found support at its lower ML:

Click image for original size


We know where to look in case of W3s
RA
rat89
Rep: 0
Posts: 7,015
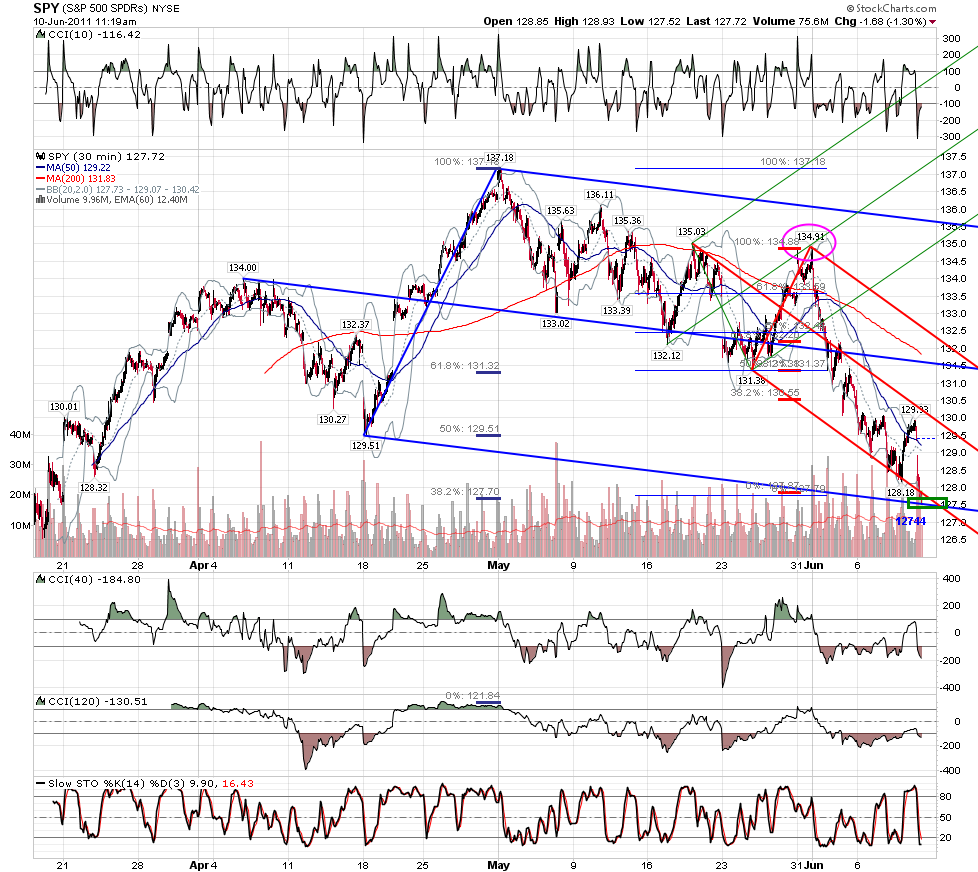
1.27 of 129.51 swing at line and 1.618/1

Click image for original size

Click image for original size
JA
jarek
Rep: 94
Posts: 3,474
That would be it for me today. Good trading and have a great weekend!
RA
rat89
Rep: 0
Posts: 7,015
886 on gap on 5 (well, 6¢ shy)

you know what? I was looking for 127.44 and the low so far was at 127.52 - 6¢ high......I was looking for 886 retest at .57 and the retest came at .63 ....... 6¢ high.....is that the game?

Click image for original size
JI
jimkane
Rep: 3,058
Posts: 33,089
So, where did the first bounce (albeit a small one so far) start from? 1264.25. Hmmmm. I wonder why it sold straight down to there?


Originally posted by jimkane

Major levels in ES. These come from higher timeframes (not all the same timeframes, either, so tolerance levels (grouping widths) are not the same). I will not give the total groupings, just the center area, for the last two. I can pinpoint those levels better as they get closer. This is just in case roofer's read plays out and we dump (oh, please, oh, please...).

1260-67

1242-47 (maybe 49)

1207

1161
JI
jimkane
Rep: 3,058
Posts: 33,089
Time to rise.
RA
rat89
Rep: 0
Posts: 7,015
here's a charting error I made that's very interesting...I was looking at the first version, but the second makes more sense now in retropect


Click image for original size

Click image for original size
RA
rat89
Rep: 0
Posts: 7,015
Click image for original size
RA
rat89
Rep: 0
Posts: 7,015
it might have to, and we'll find out soon


Originally posted by tx_ches

I could certainly see it going lower though.