MyPivots
JA
jarek
Rep: 94
Posts: 3,474
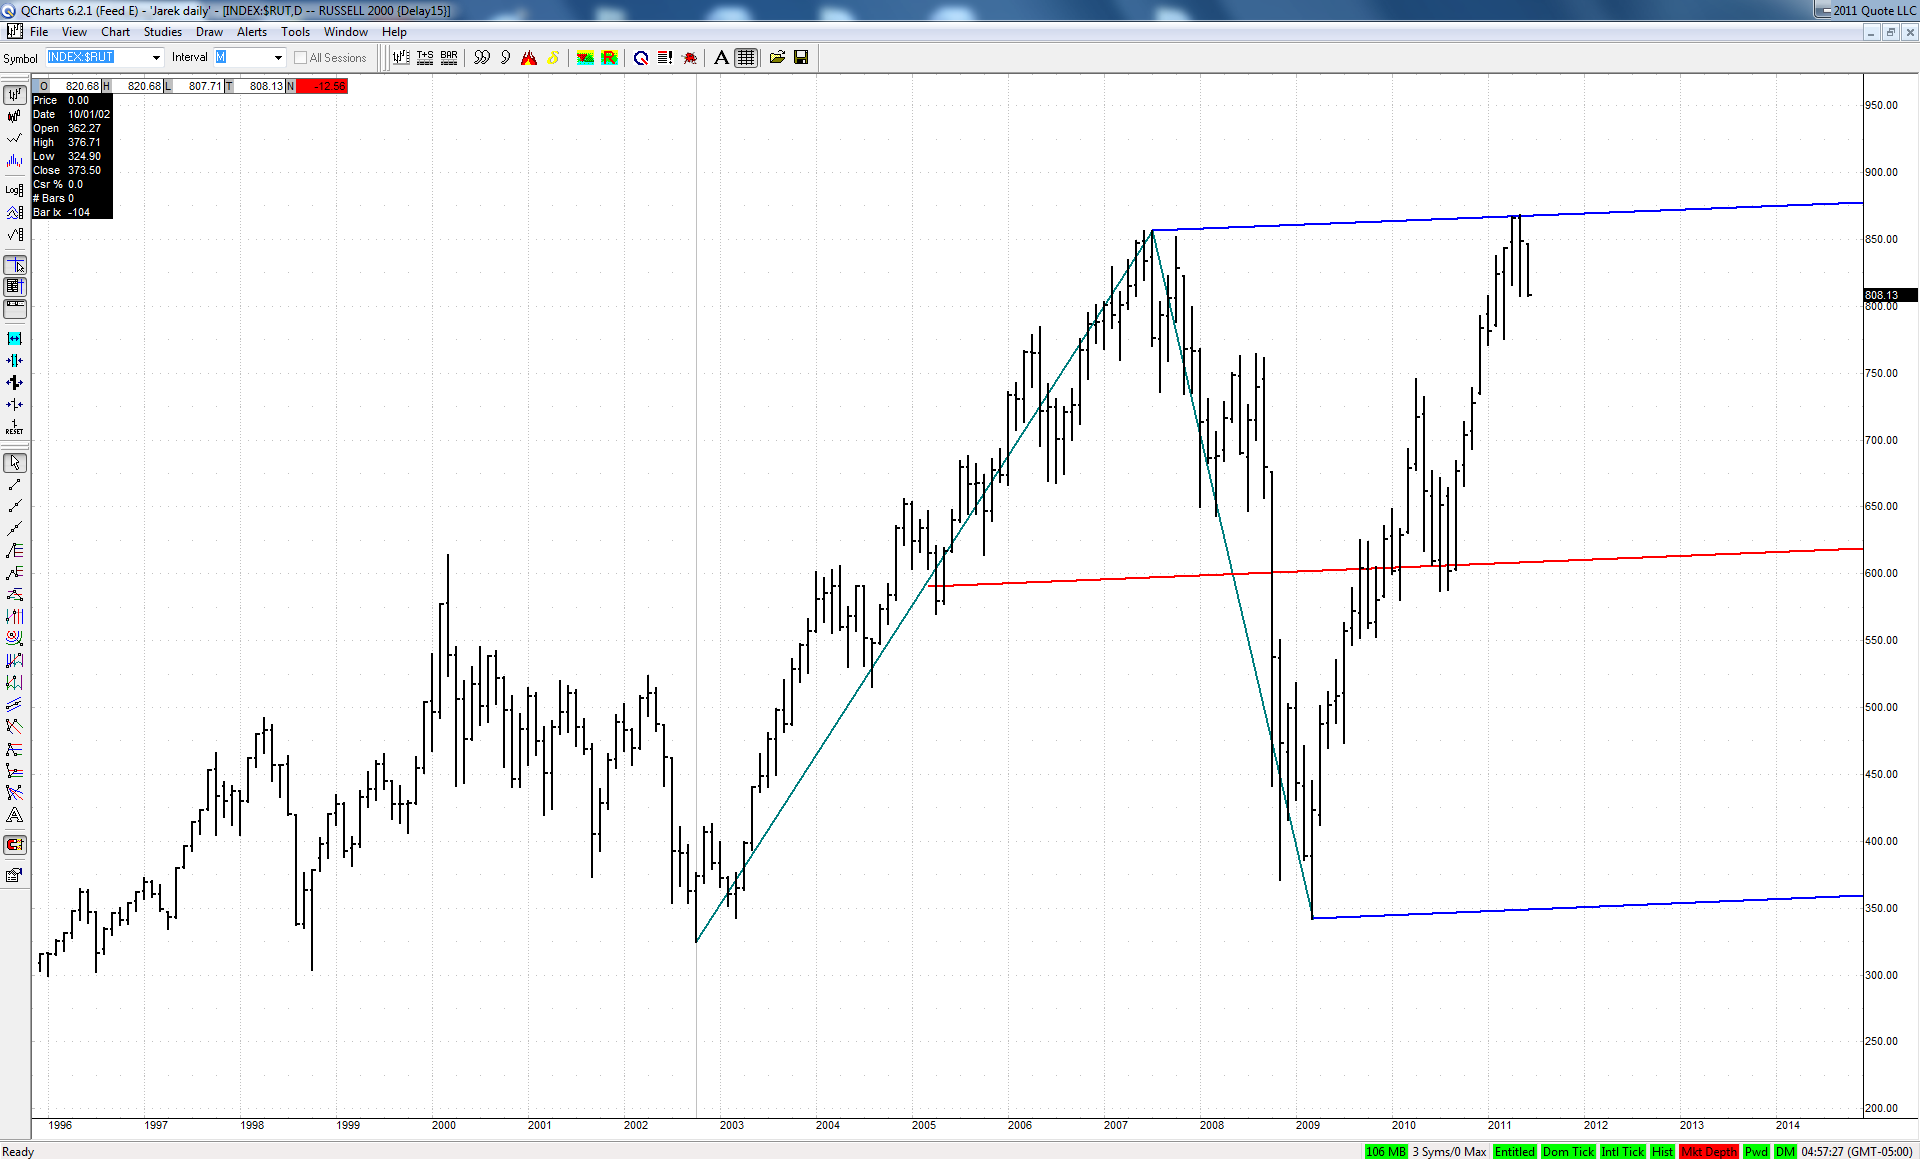
Jim suggested to take a look at daily charts of some secondary indexes and here is my current $RUT chart:

Click image for original size
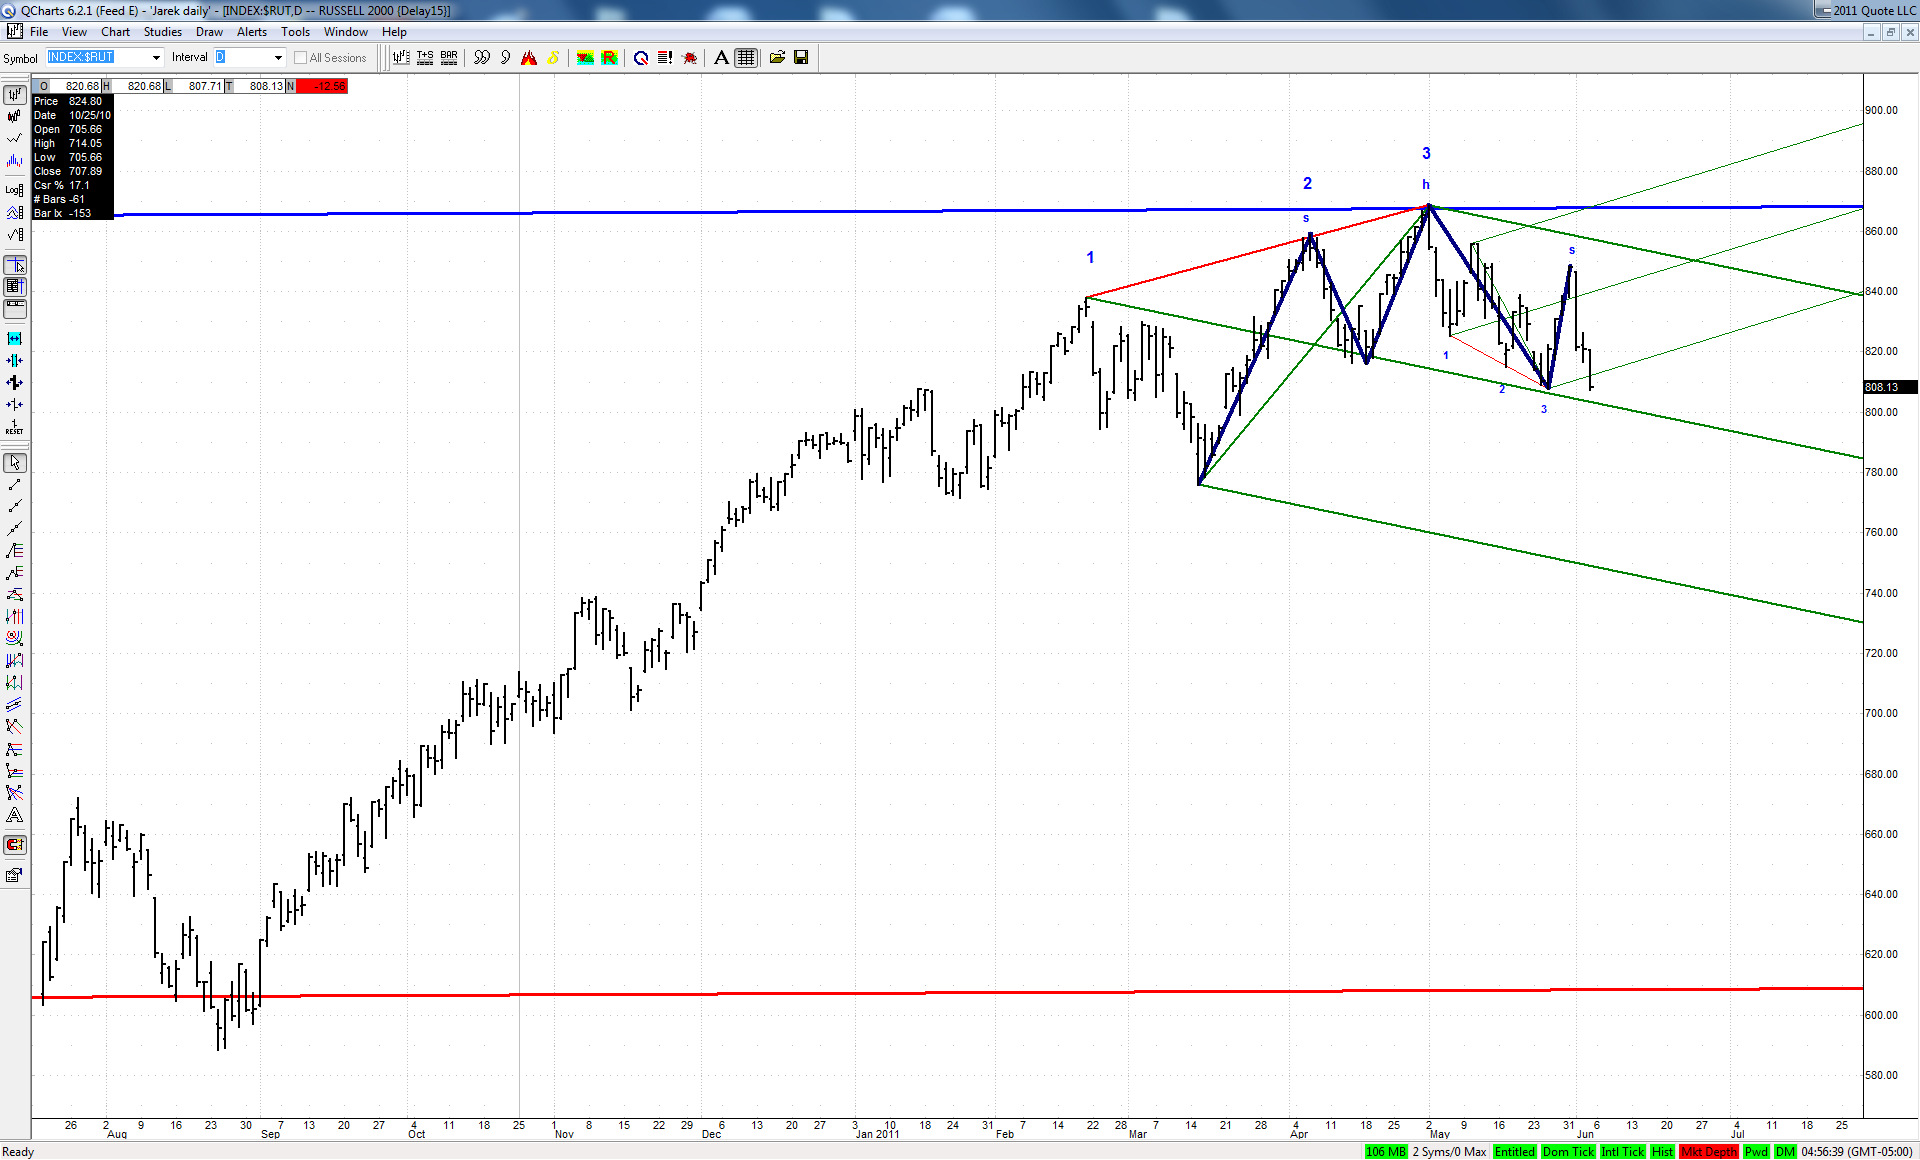

The green ML of a set based on big bearish 3D happens to be also a neckline of a classic head and shoulders. If bulls would not be able to defend this line next week, then a move to the lower ML should follow. This would also be a perfect fulfillment of a successful H&S pattern.
It is all the more interesting as this big bearish 3D fell dead on at the upper ML of a quite important set:

Click image for original size
RA
rat89
Rep: 0
Posts: 7,015
Click image for original size

Click image for original size

Click image for original size

Click image for original size
RA
rat89
Rep: 0
Posts: 7,015
maybe I'm looking the wrong way....but if it doesn't break the blue set and the retest is it just waiting on time to make a move?

Click image for original size
RA
rat89
Rep: 0
Posts: 7,015
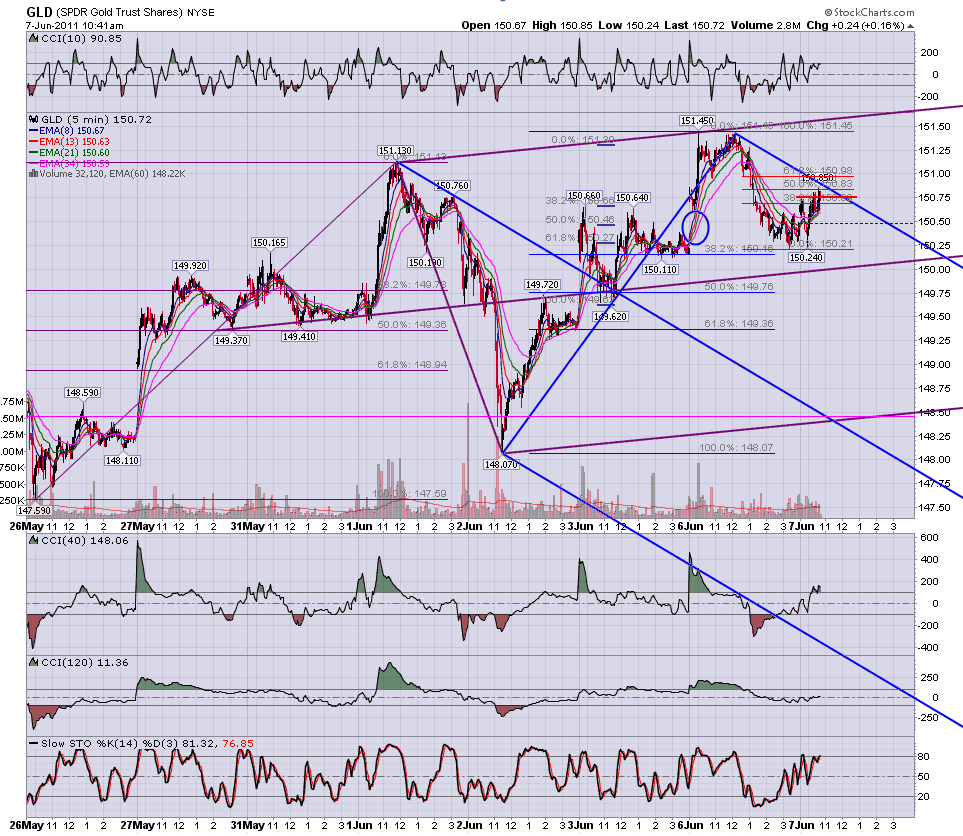
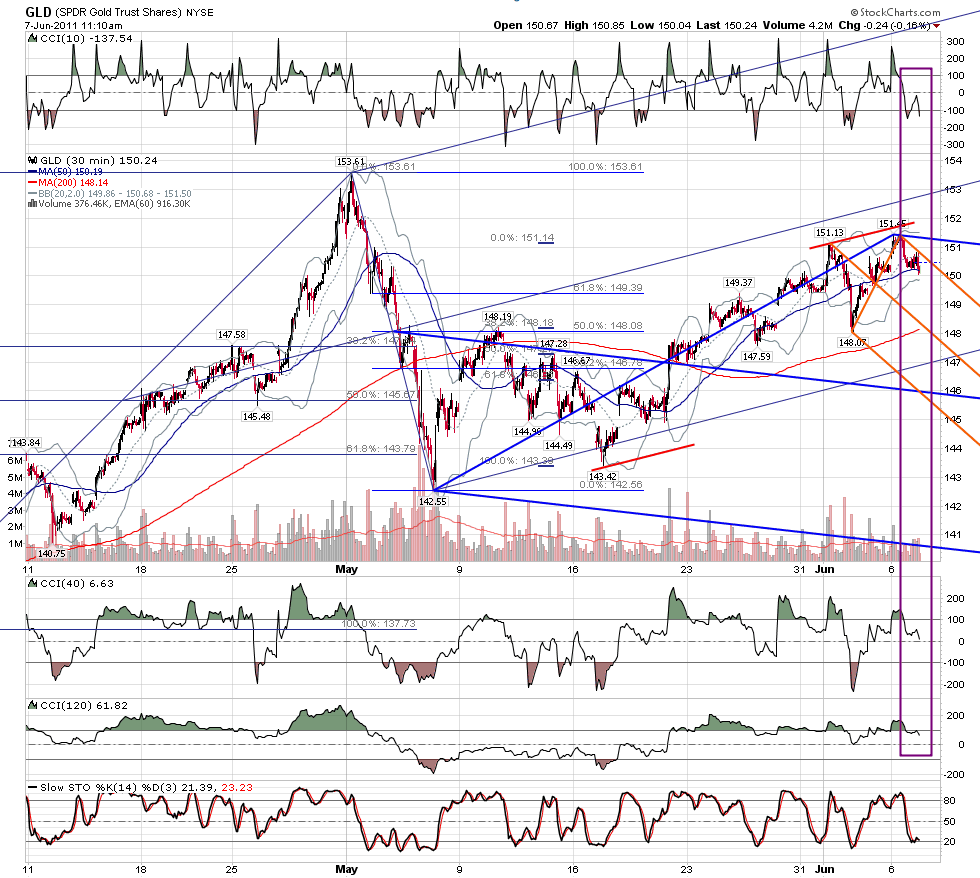
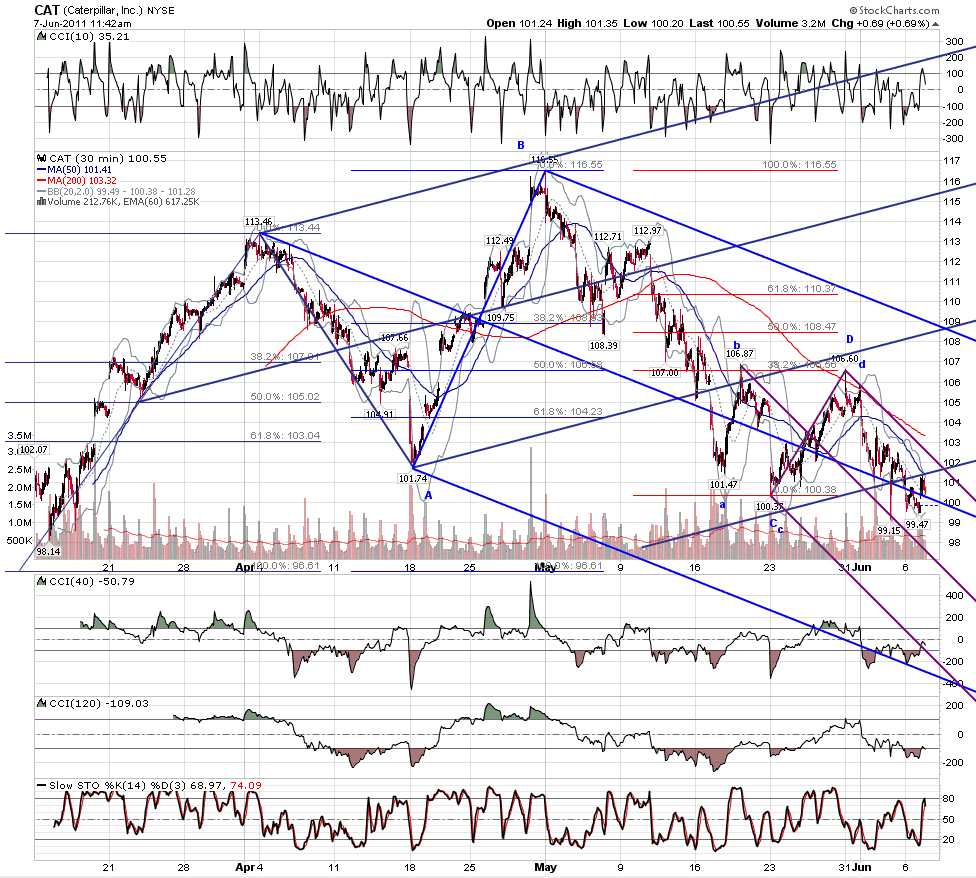
on alert......isn't this the setup roofer showed that says watch out? could this just blast higher?....watching cci 10
Click image for original size
TX
tx_ches
Rep: -10
Posts: 514
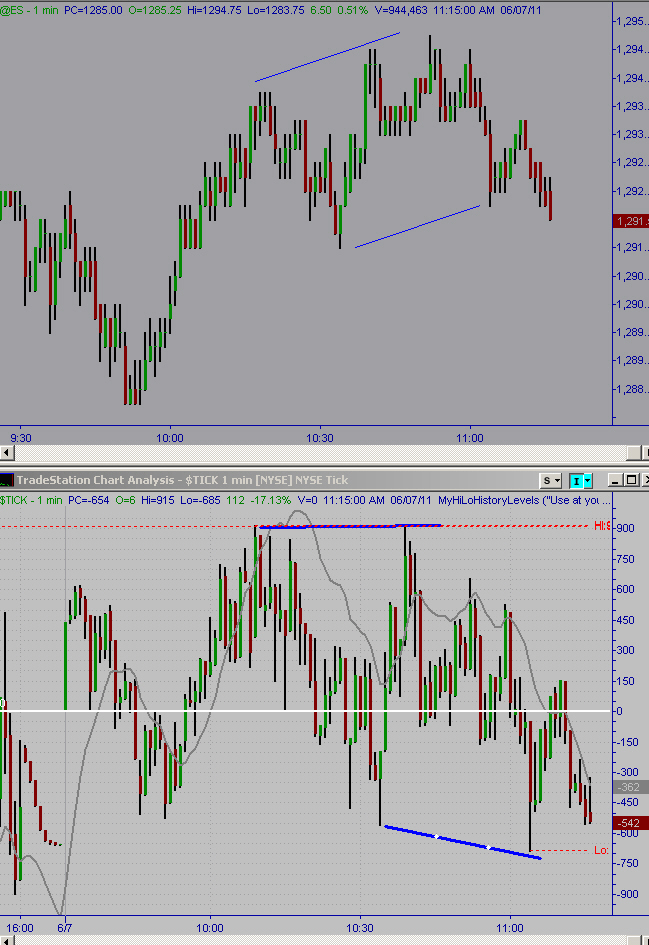
Divergence with TICK so that can mean lower lows coming- very short term any way.
Or not. Only the market knows.
TX
tx_ches
Rep: -10
Posts: 514
Originally posted by tx_ches

Divergence with TICK so that can mean lower lows coming- very short term any way.
Or not. Only the market knows.

Click image for original size
JA
jarek
Rep: 94
Posts: 3,474
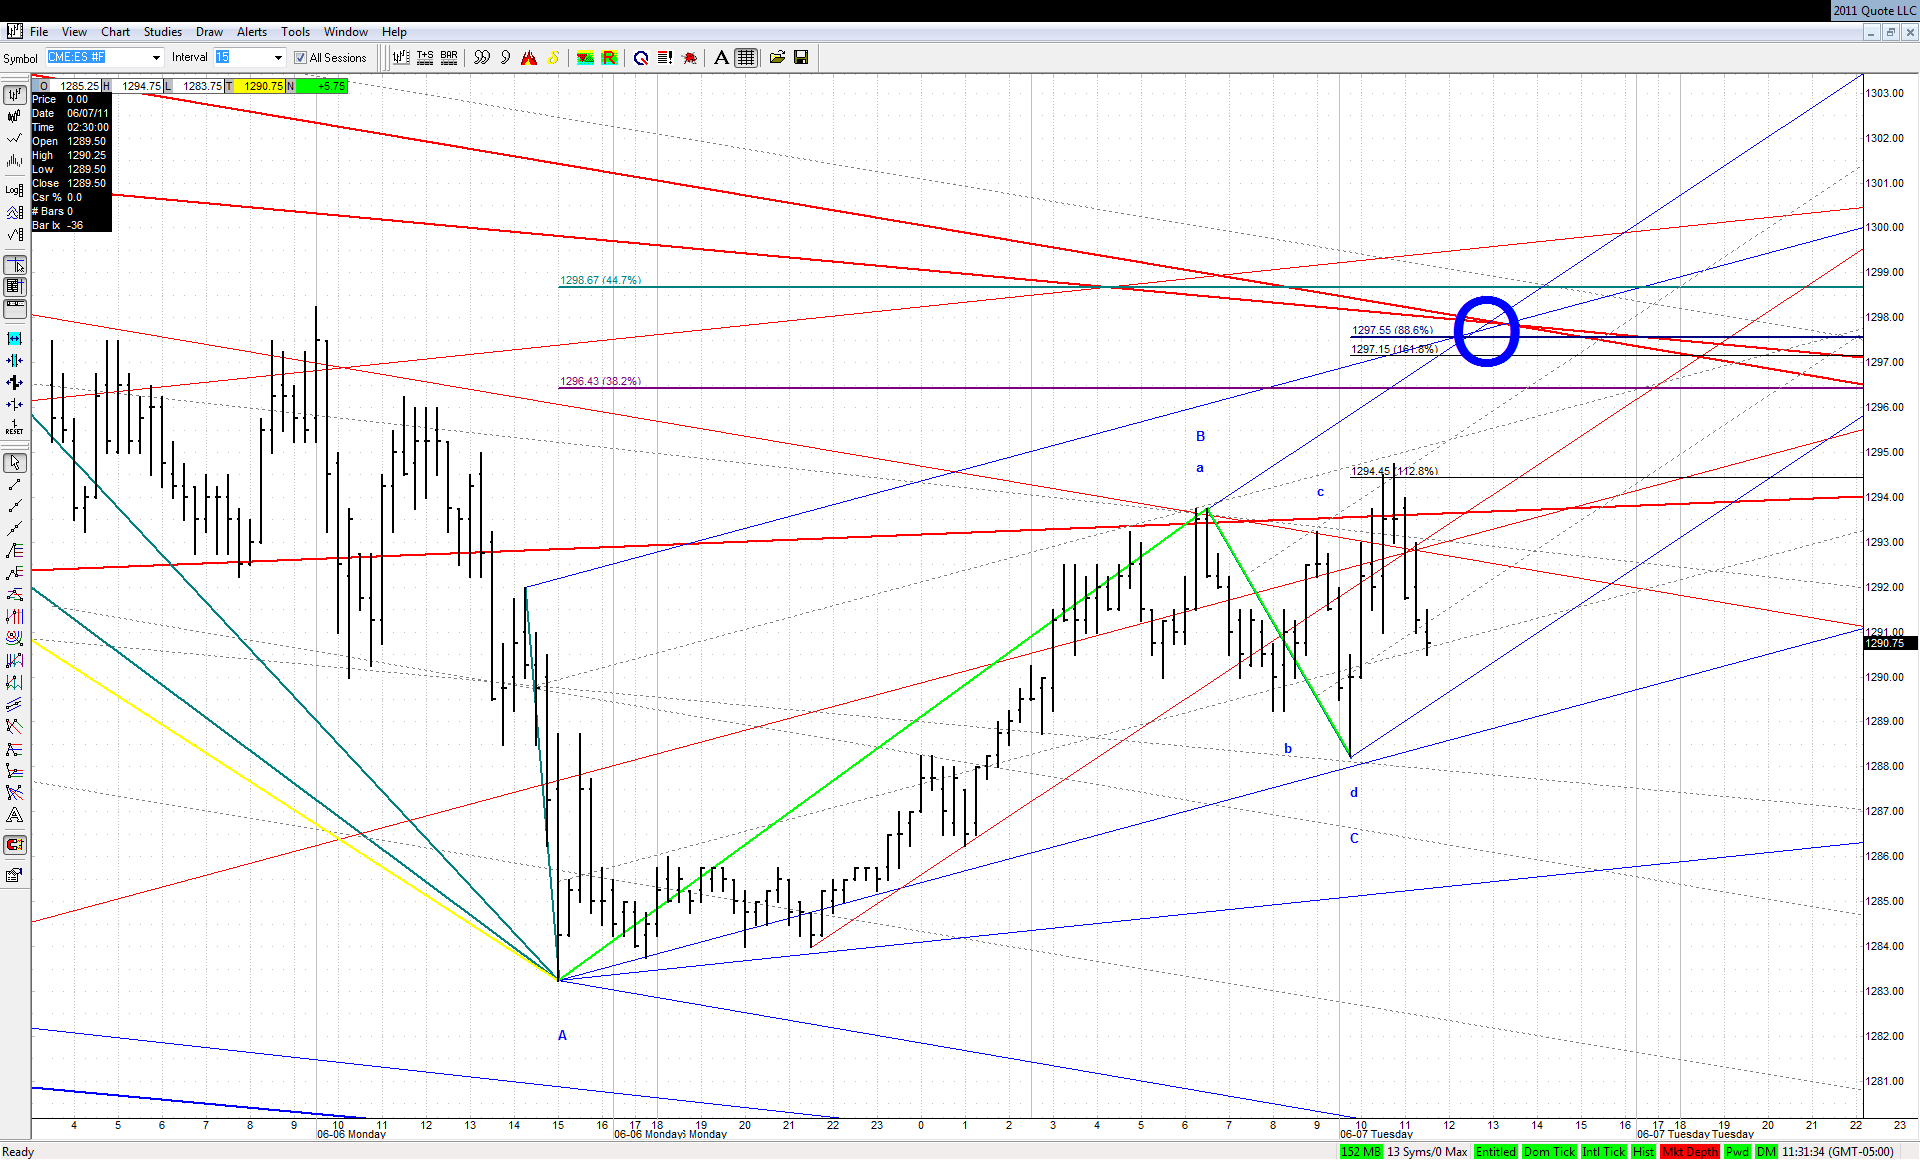
We may already forget about a bearish ABCD ending in this beautiful area of confluence - its CD leg would have to be 3-legged:

Click image for original size
RA
rat89
Rep: 0
Posts: 7,015
whomp, that was fast on gld
RA
rat89
Rep: 0
Posts: 7,015
meow


Click image for original size
JI
jimkane
Rep: 3,058
Posts: 33,089
jarek has already covered this, but HOD so far 94.75. But the selling, so far, is just back to an obvious little TL, where it reacted. It's not convincing yet that this is going much lower (going much lower this moment, off this area).


Originally posted by jimkane

Sure looks like they want to rise this for a bit now. My next areas above are 93-95 and 96.50-97.75 or so. If it gets going 1306-08. I need to see some more price action to narrow that last one down a bit better.
AL
albert
Rep: 99
Posts: 3,094
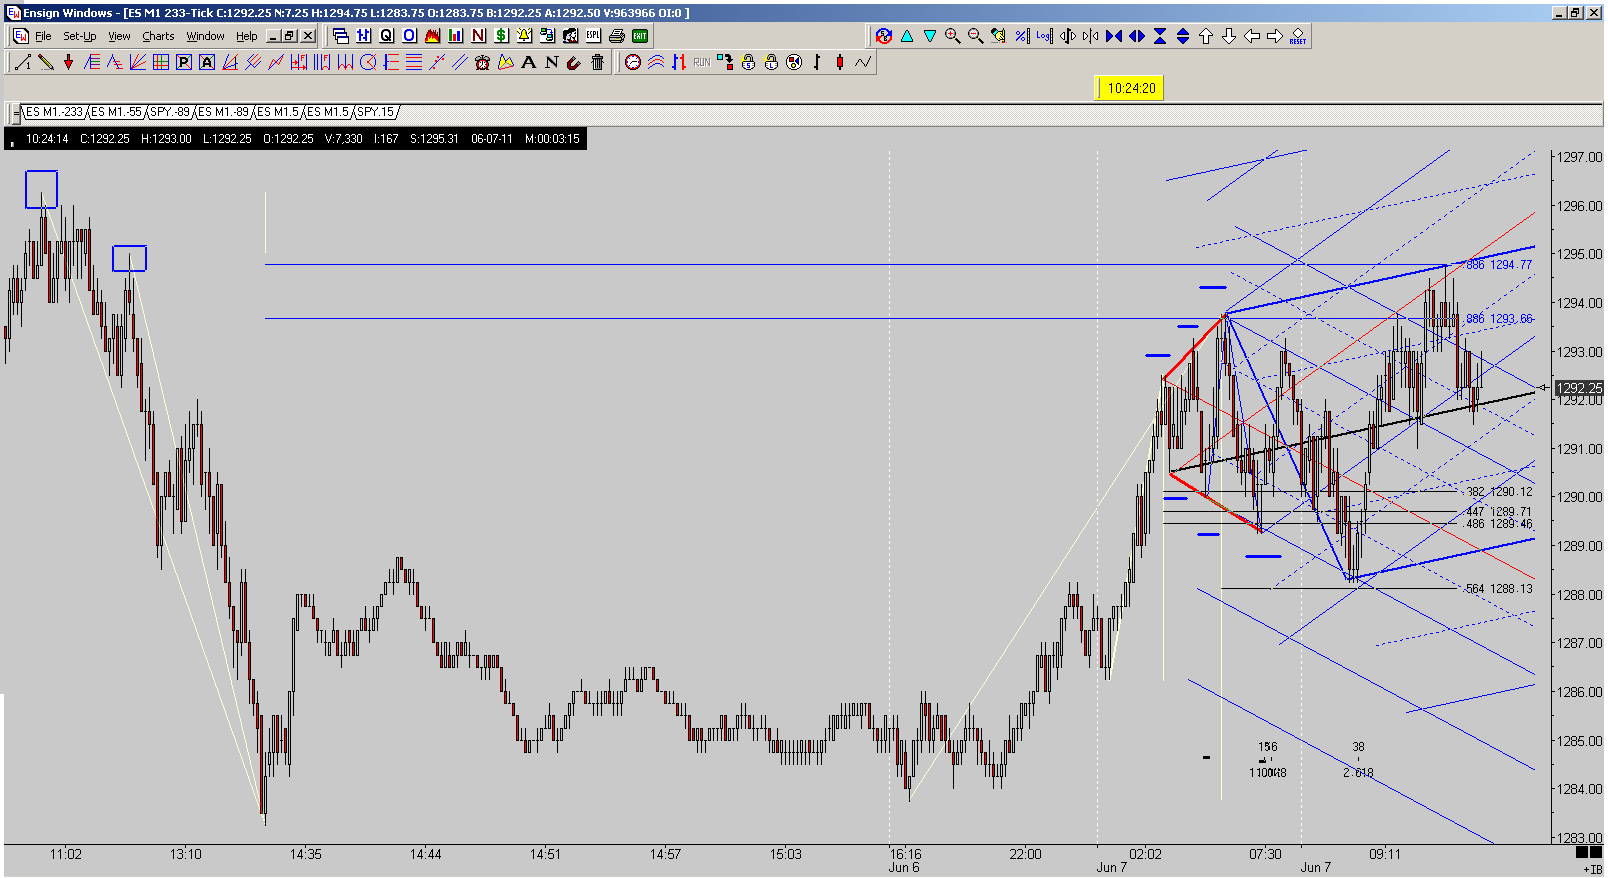
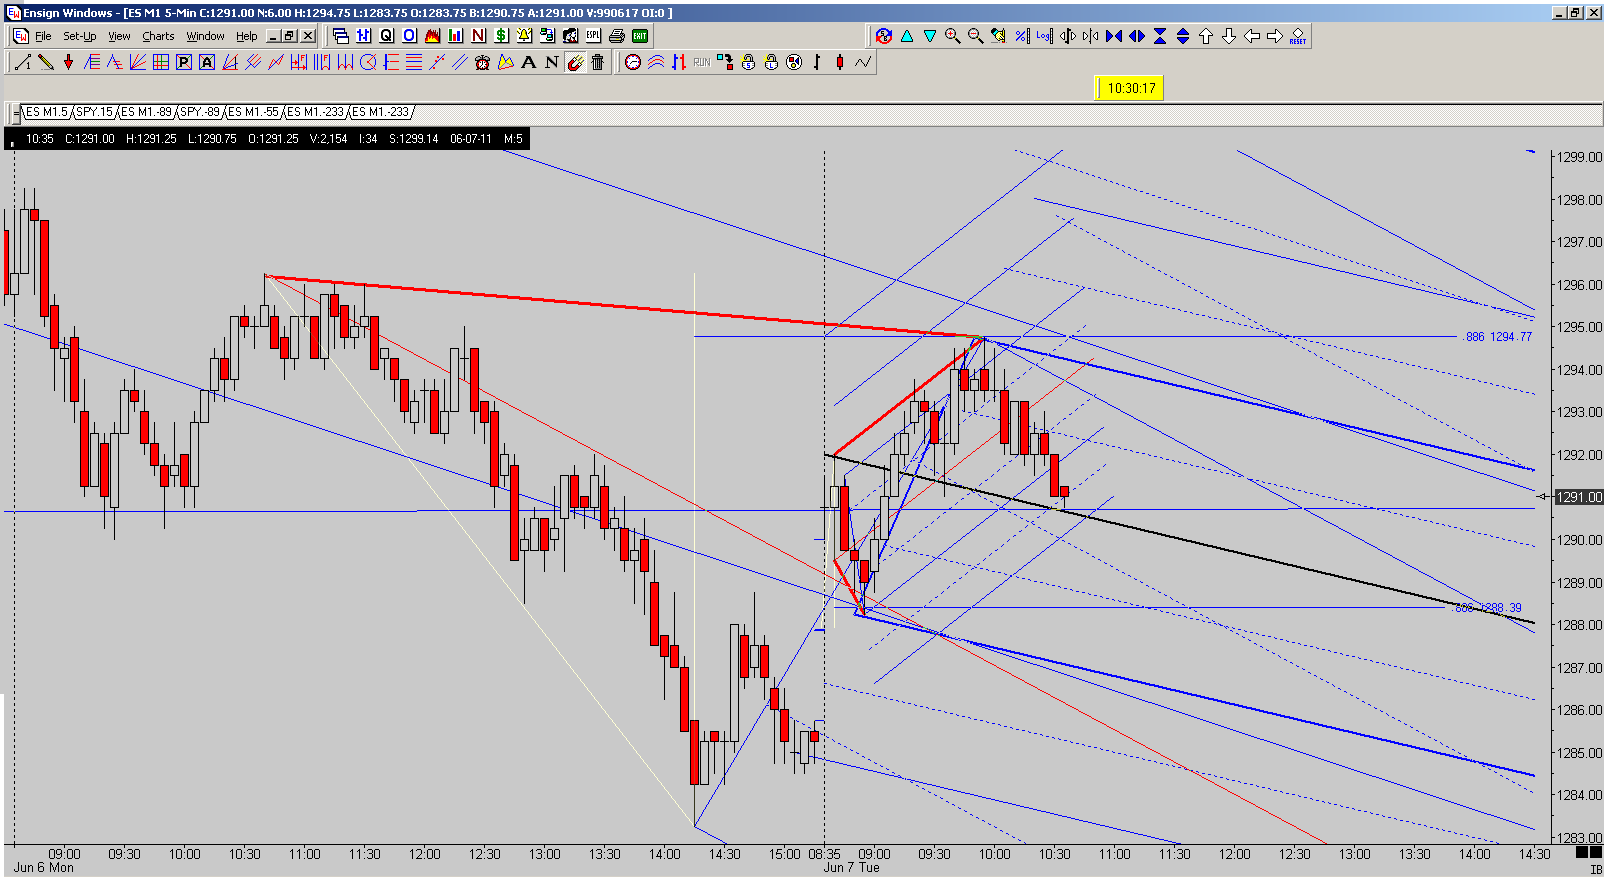
I love this awesome preopen geometry. Kane EXP ABCD completing in KZ, and price rises to 0.886 fibo, also completing a 3D . The EXP morphs into another Kane EXP ABCD completing at 0.486 fibo, also a SL. Price rises to 0.886 fibo confluent with 3D-based ML //, forms a Kane Pattern-Line-Fib,, reverses and price drops in an ABCD with an ABCD in the BC leg. Also, Beauty and Simplicity in the markets on the 5 minute RTH chart. Thank you Jim, and to all the Kane traders for helping me to see this stuff.

Good Trading,

Al Kamego
Click image for original size

Click image for original size
RA
rat89
Rep: 0
Posts: 7,015
it might have to, and we'll find out soon


Originally posted by tx_ches

I could certainly see it going lower though.