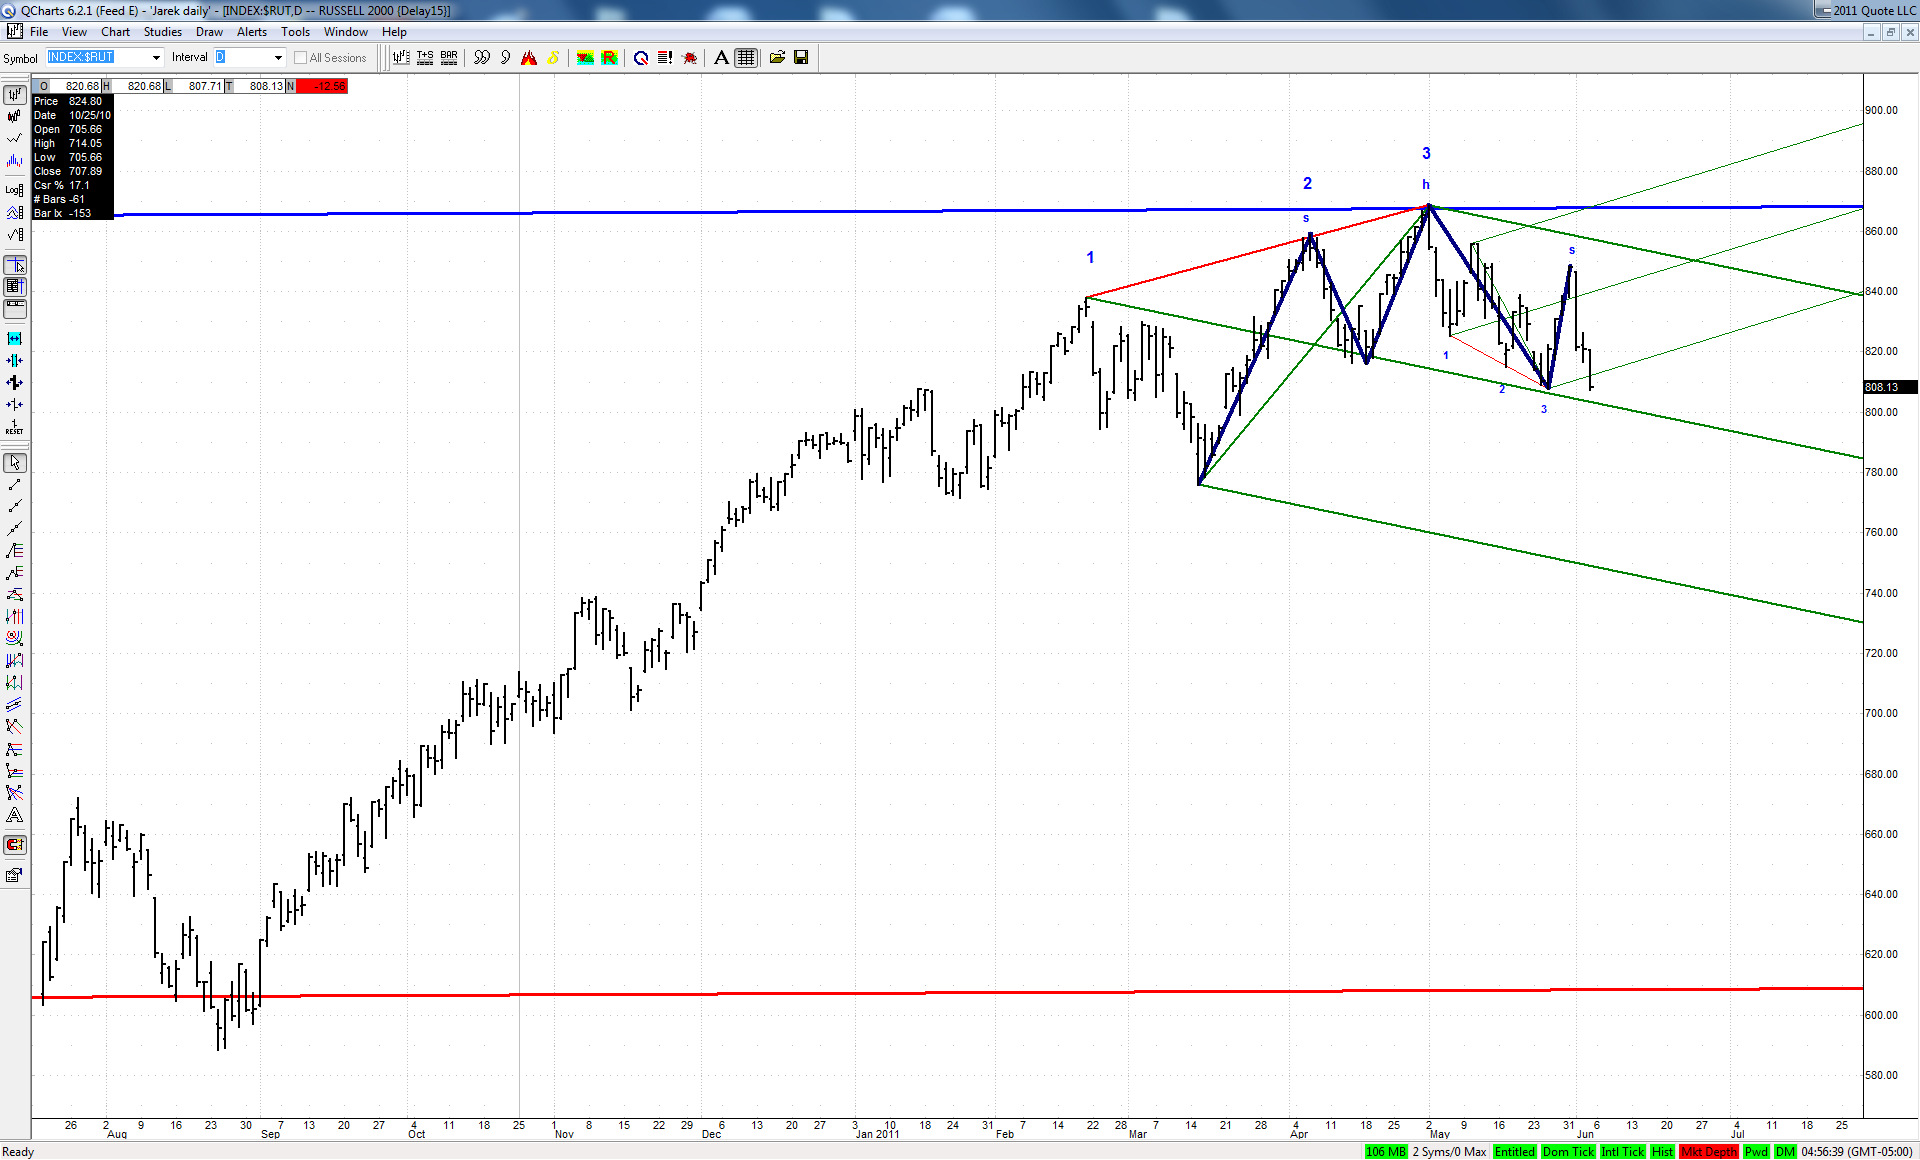
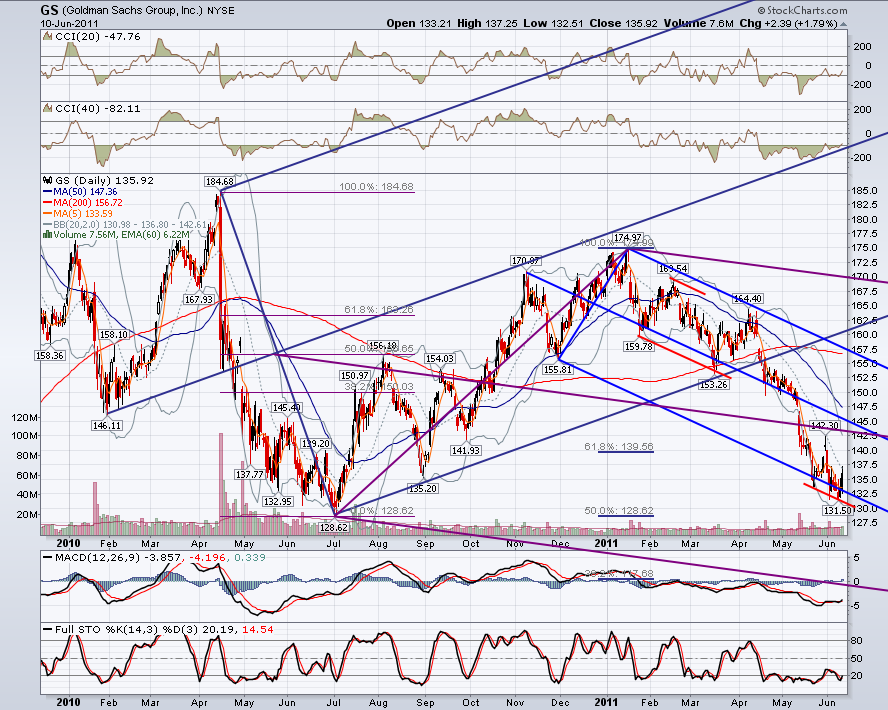
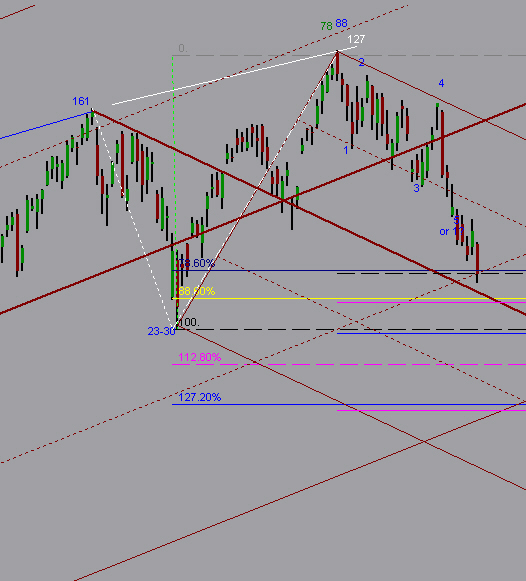
Jim suggested to take a look at daily charts of some secondary indexes and here is my current $RUT chart:
The green ML of a set based on big bearish 3D happens to be also a neckline of a classic head and shoulders. If bulls would not be able to defend this line next week, then a move to the lower ML should follow. This would also be a perfect fulfillment of a successful H&S pattern.
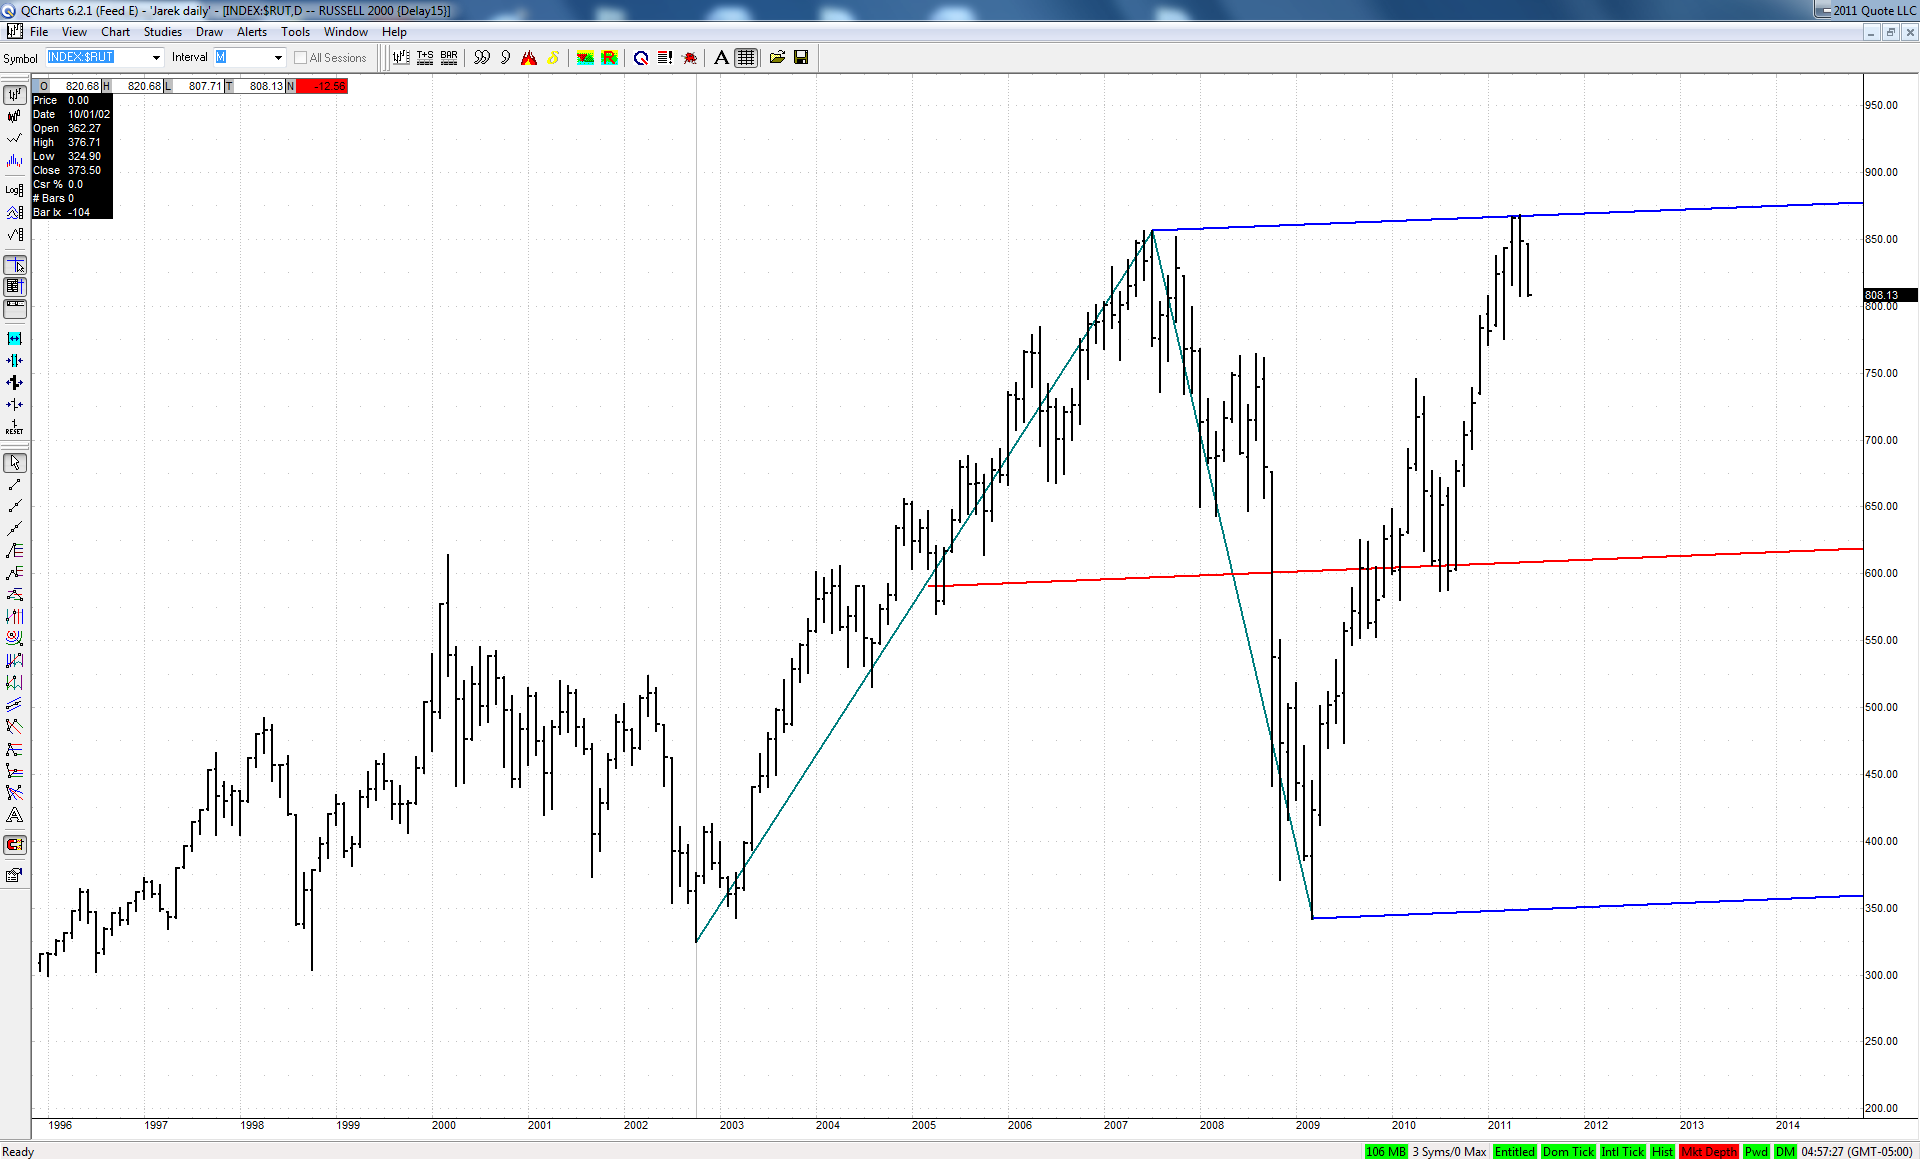
It is all the more interesting as this big bearish 3D fell dead on at the upper ML of a quite important set:
RO
roofer
Rep: 3,689
Posts: 3,574
all in long, when and if geometry across the board completes... elsewise... just trade after trade of standard size... on both sides...
TX
tx_ches
Rep: -10
Posts: 514
Originally posted by rat89
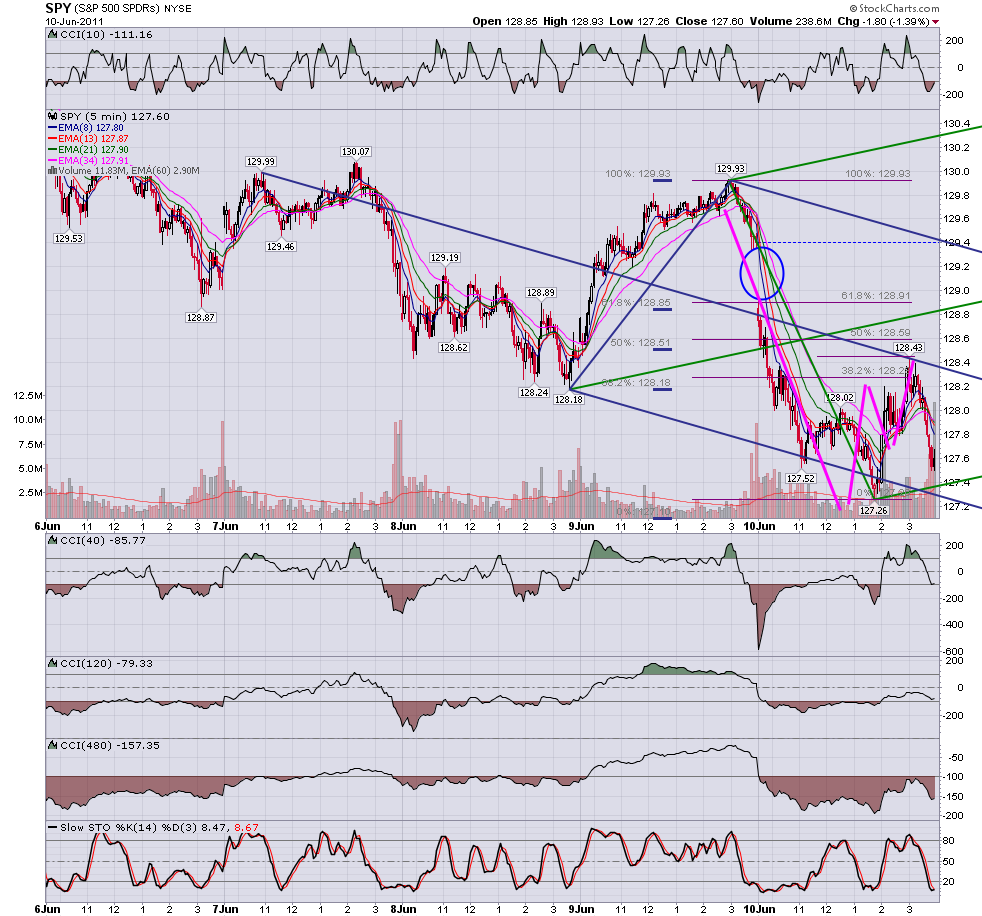
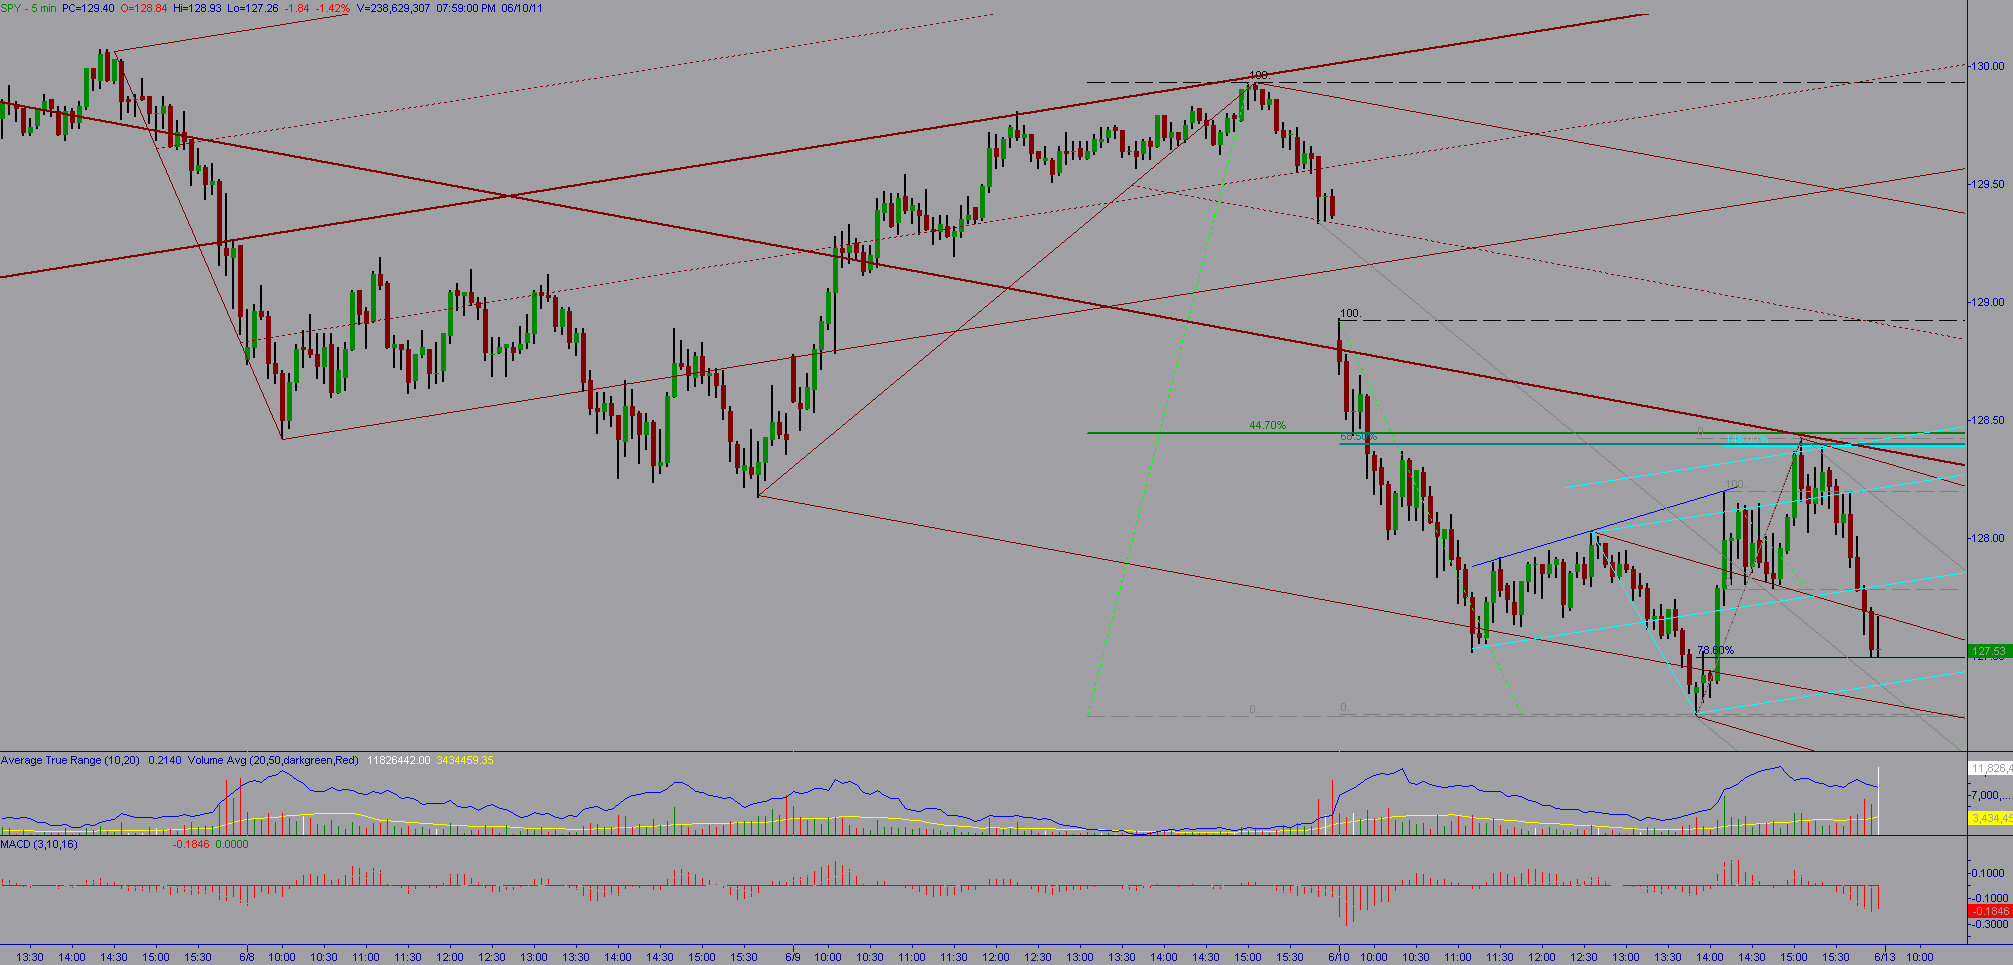
here's what happened at the 447 yesterday....
Rat, I have about the same. But I show a few more fibs coming in.
So I have ML from large brown set (same as your blue);
146 from prior swing high;
68.5 from day high at open;
44.7 from Y high;
WL on cyan set from 2 swing lows;
TX
tx_ches
Rep: -10
Posts: 514
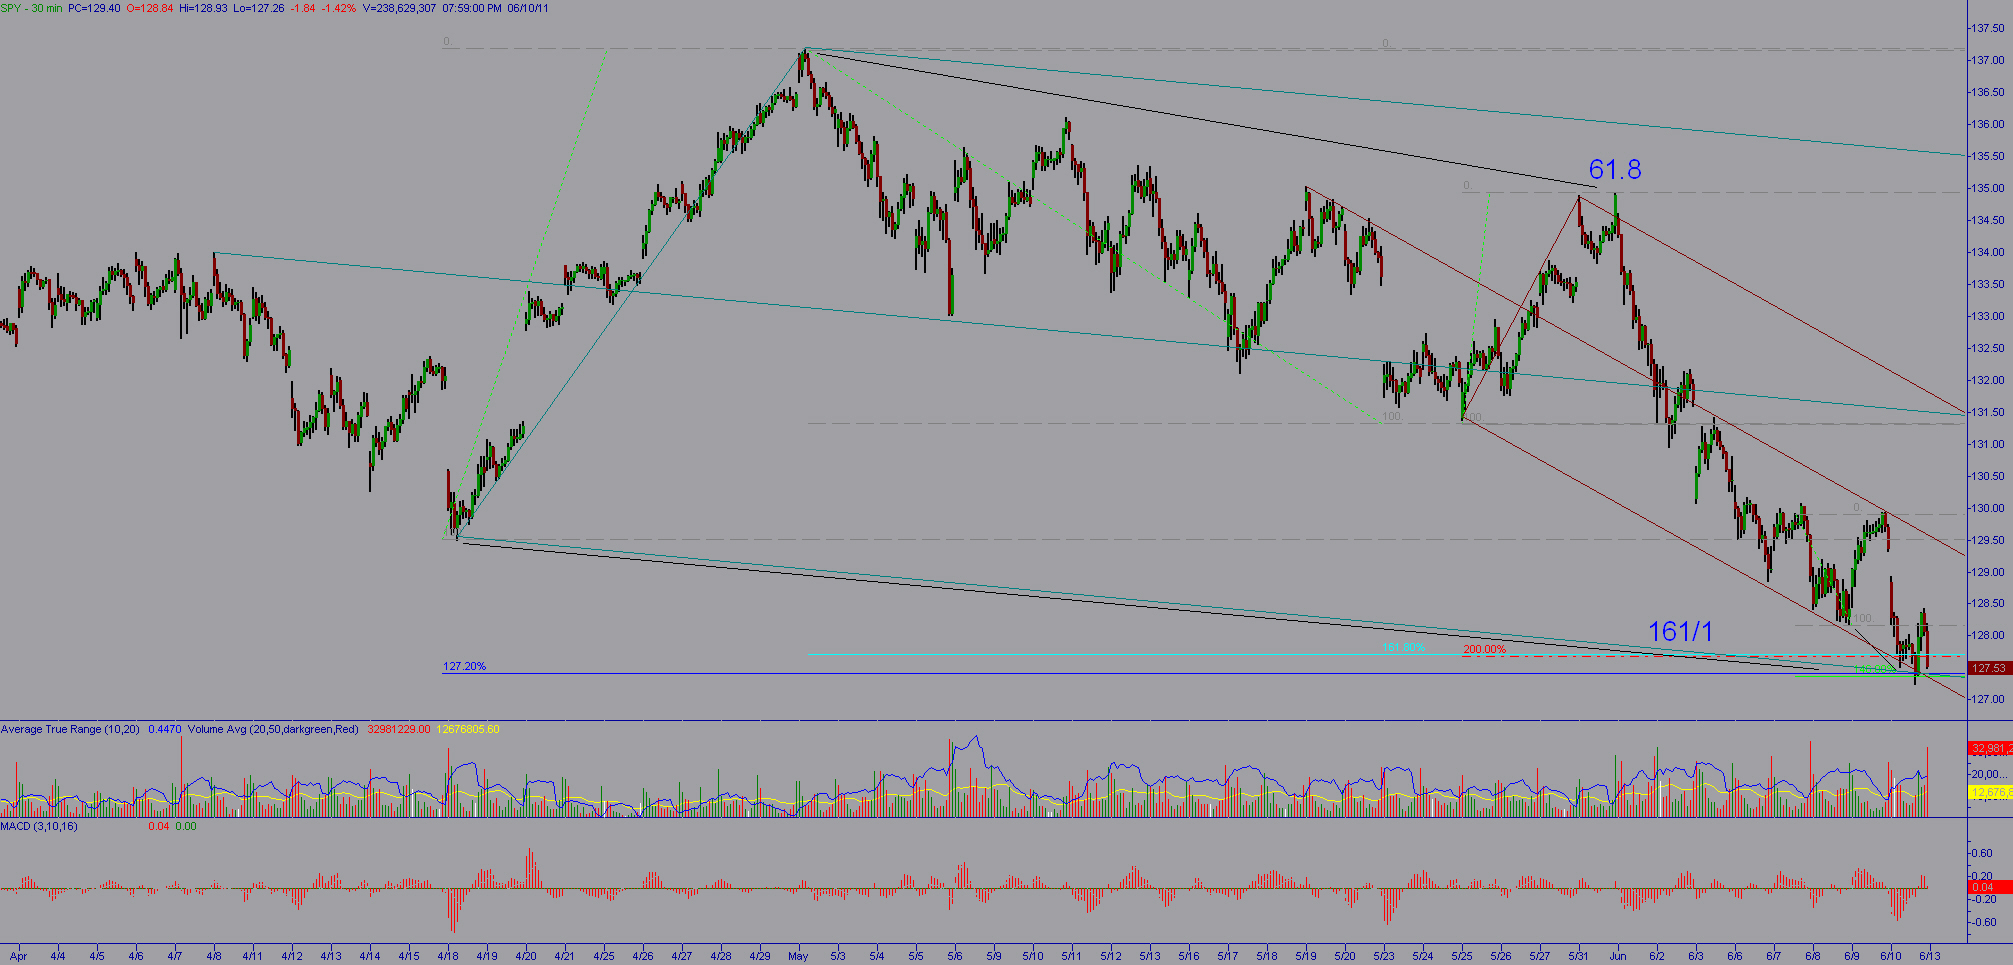
SPY Low - Rat said it but here's my chart.
Spy 30 minute:
Shows the retrace up leg to 61.8 followed by the down leg to make the 161/1 at confluence with 146 of last little swing at confluence with 127 of last major leg up at confluence with ML set.
Spy Daily has the low also:
Very near ML and a quartile line intersection on sets;
at 78 of prior swing low;
at AB=CD of down leg to that prior swing low.
I could certainly see it going lower though.