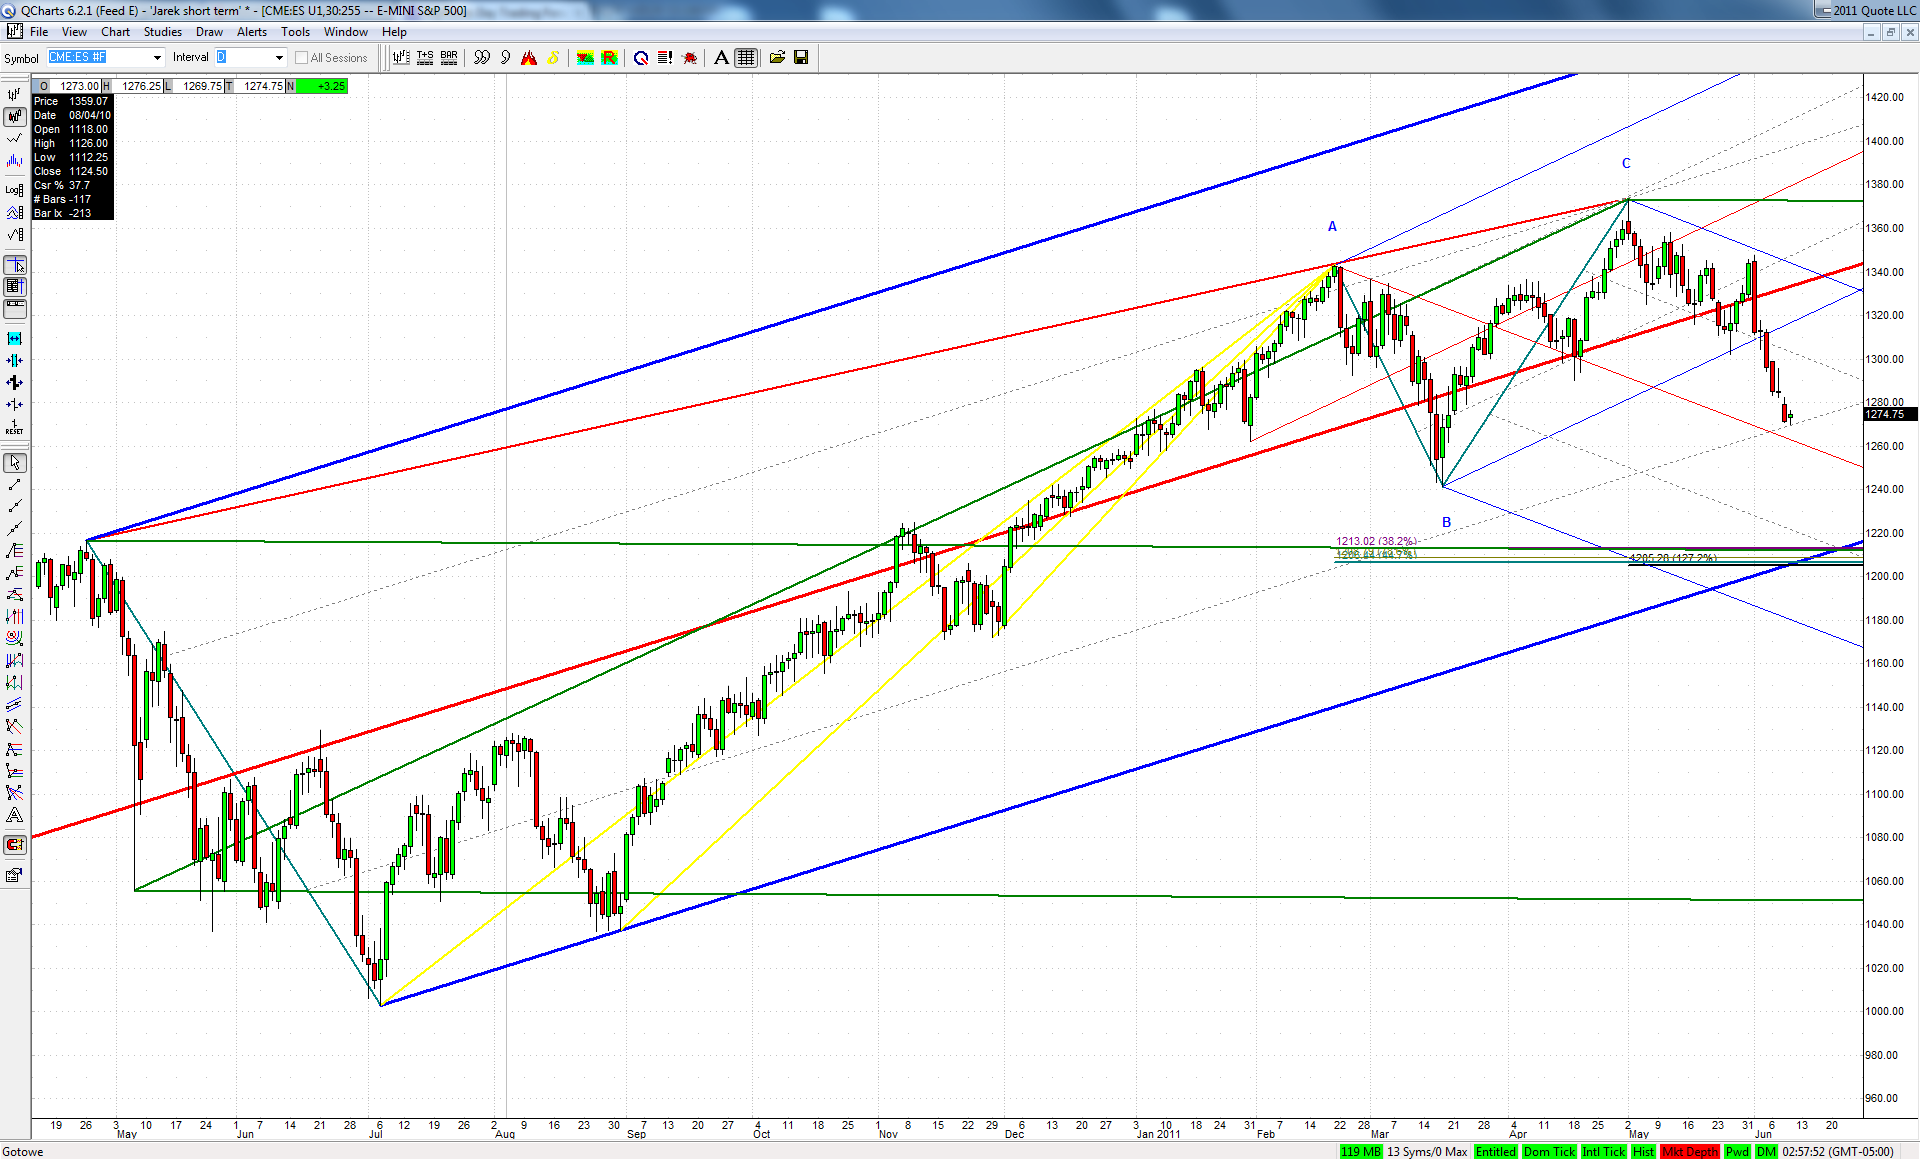
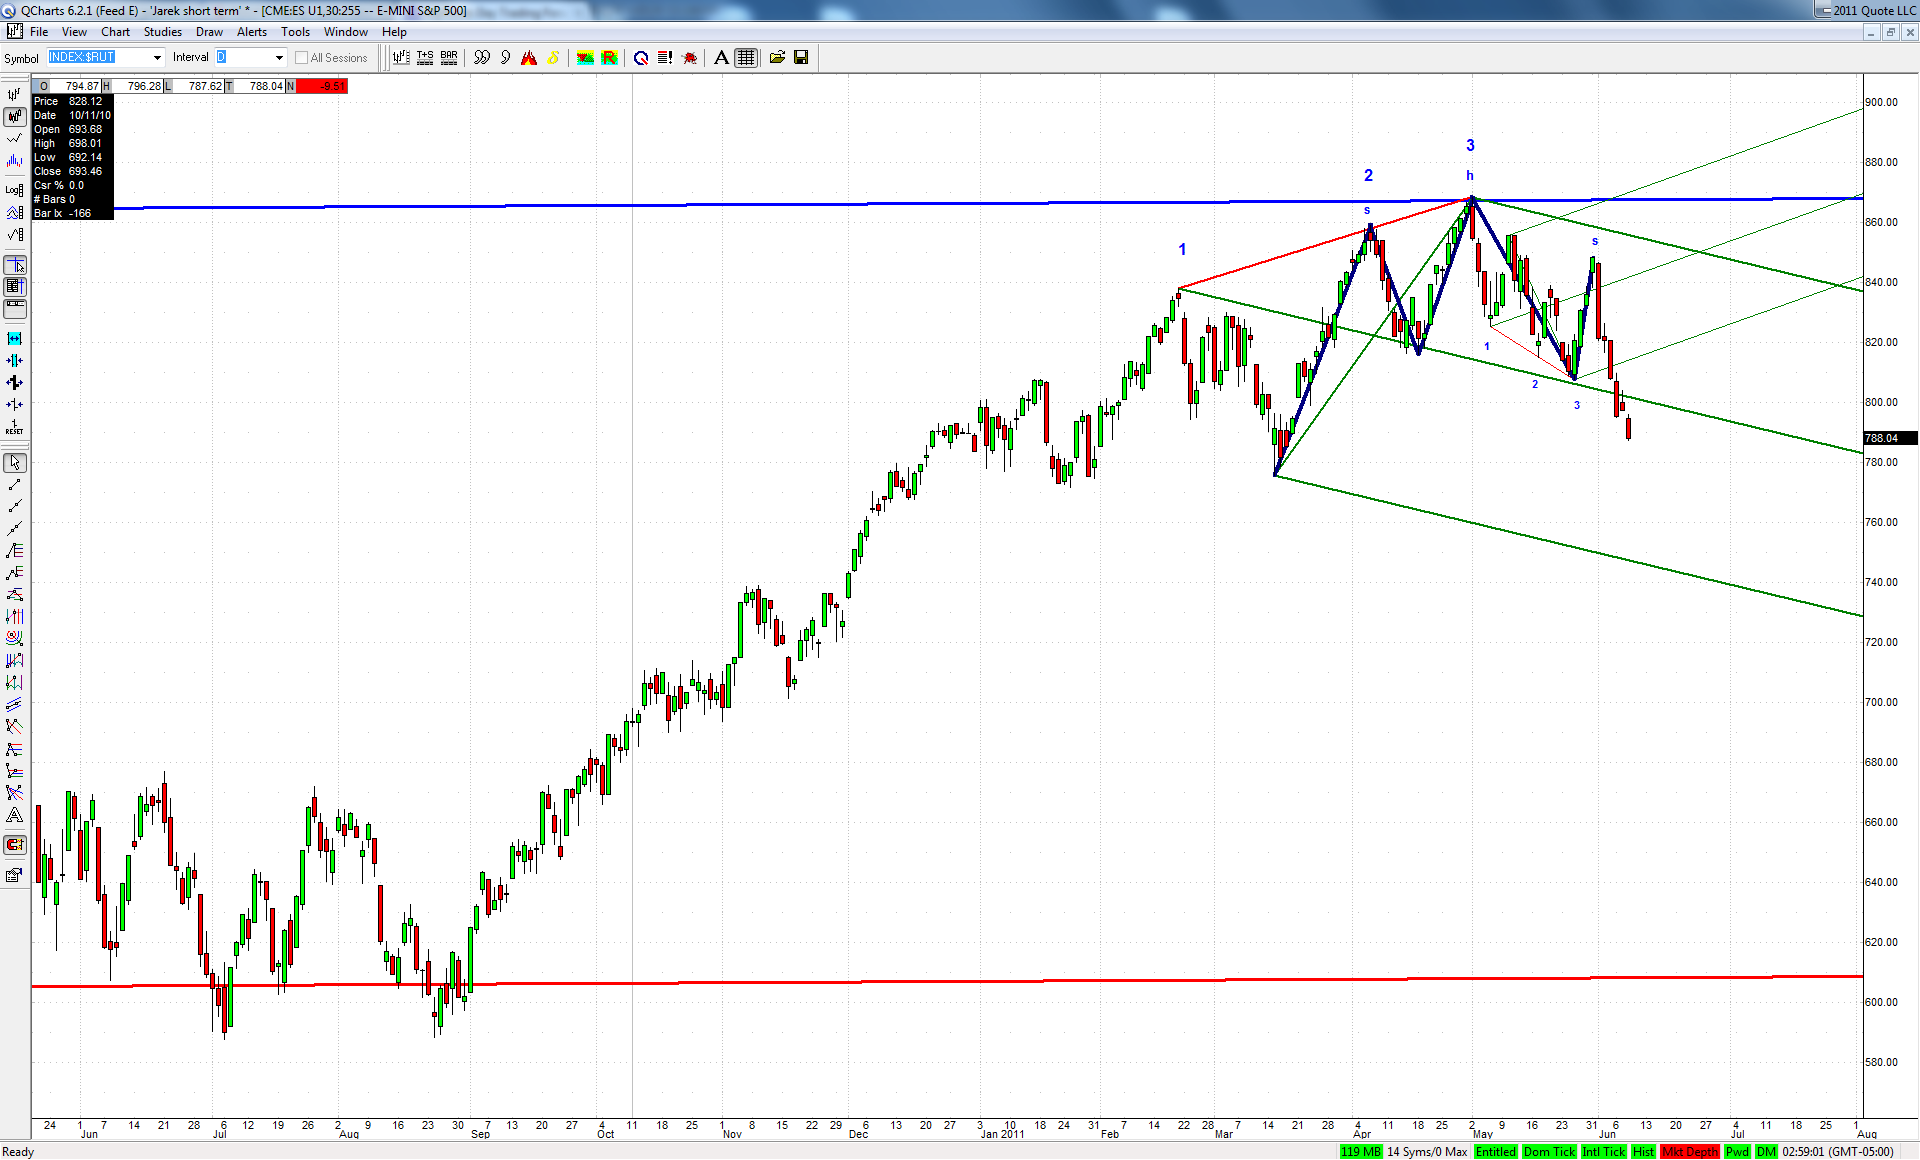
Jim suggested to take a look at daily charts of some secondary indexes and here is my current $RUT chart:
The green ML of a set based on big bearish 3D happens to be also a neckline of a classic head and shoulders. If bulls would not be able to defend this line next week, then a move to the lower ML should follow. This would also be a perfect fulfillment of a successful H&S pattern.
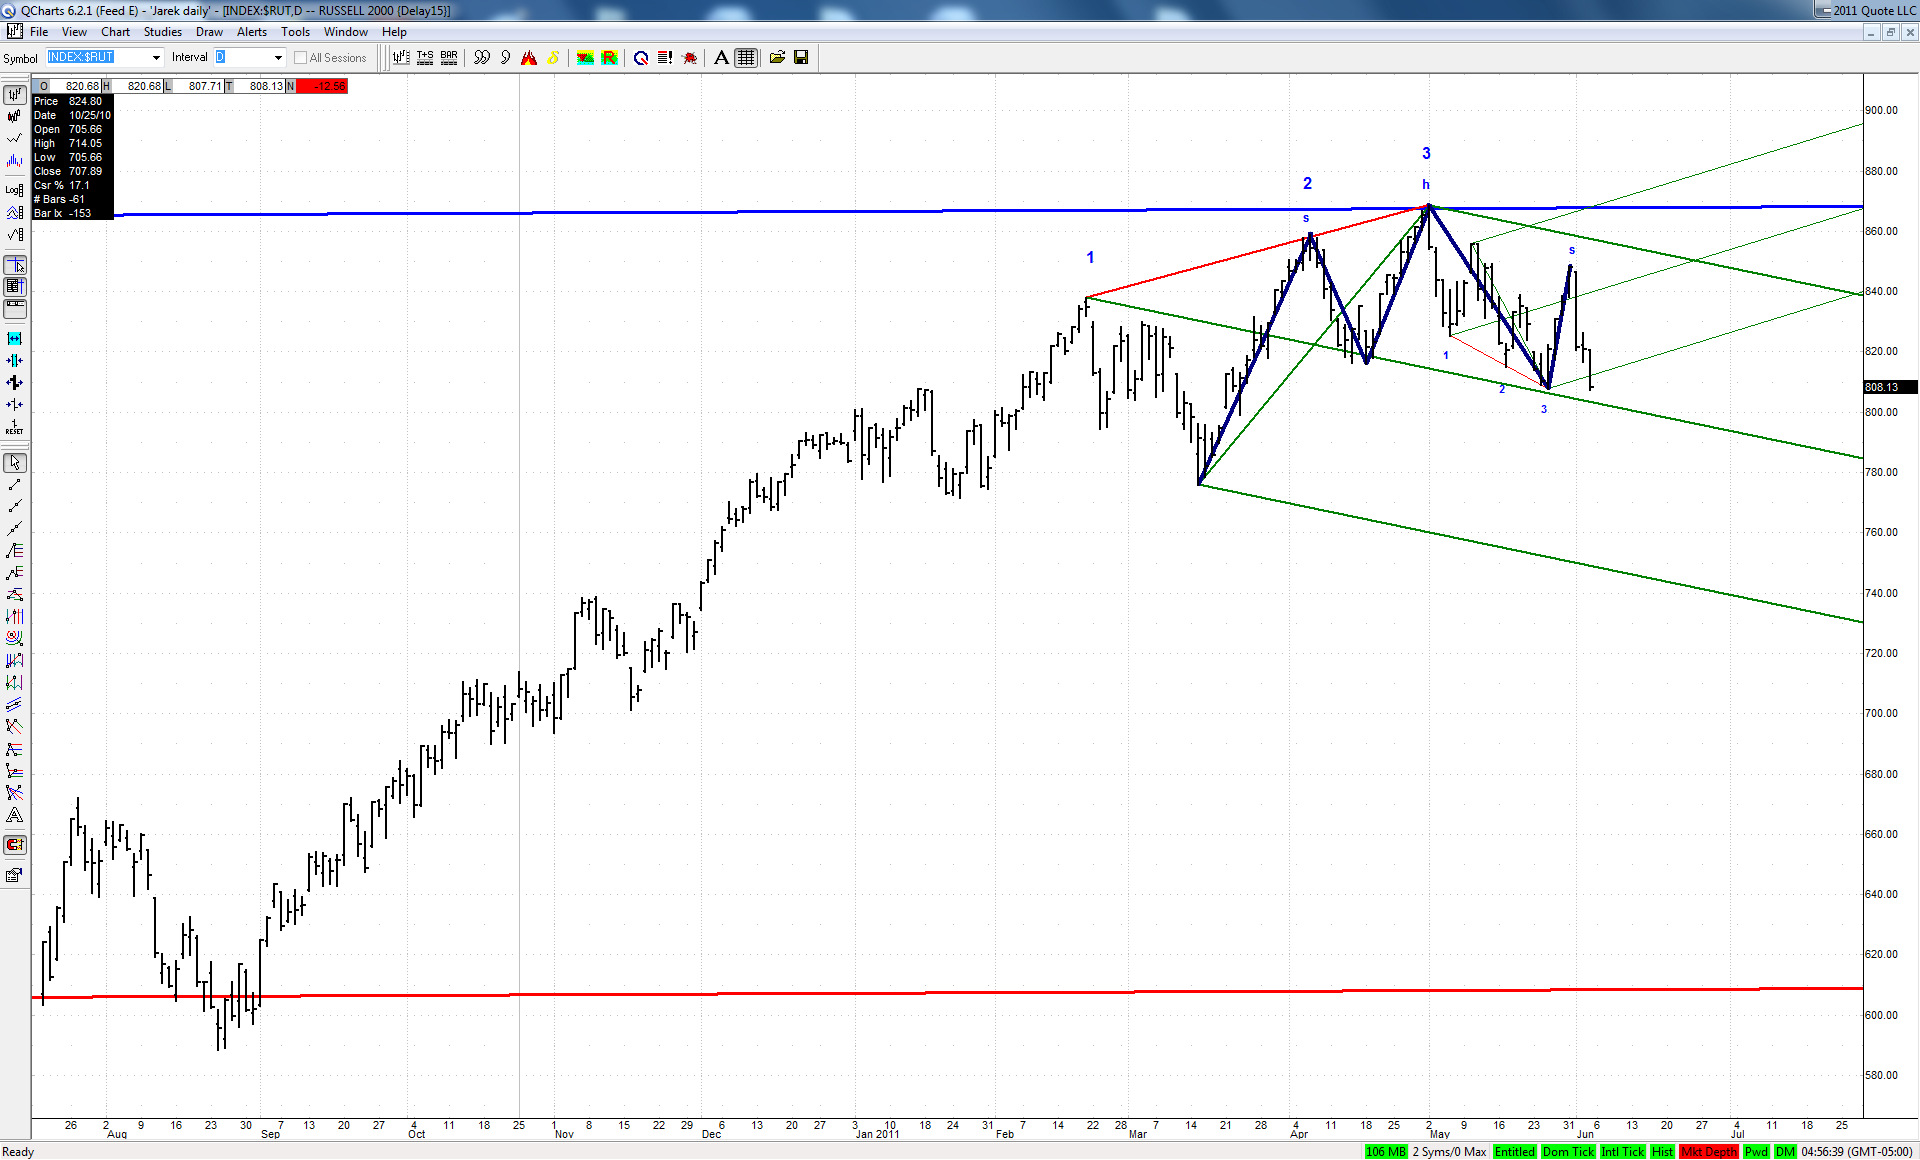
It is all the more interesting as this big bearish 3D fell dead on at the upper ML of a quite important set:
RO
roofer
Rep: 3,689
Posts: 3,574
in a nutshell ... if all the geometry of hundreds of stocks kicked in here.. then i would expect a move to the 114 spx area.not a forcast.. just an adding up....
JI
jimkane
Rep: 3,058
Posts: 33,089
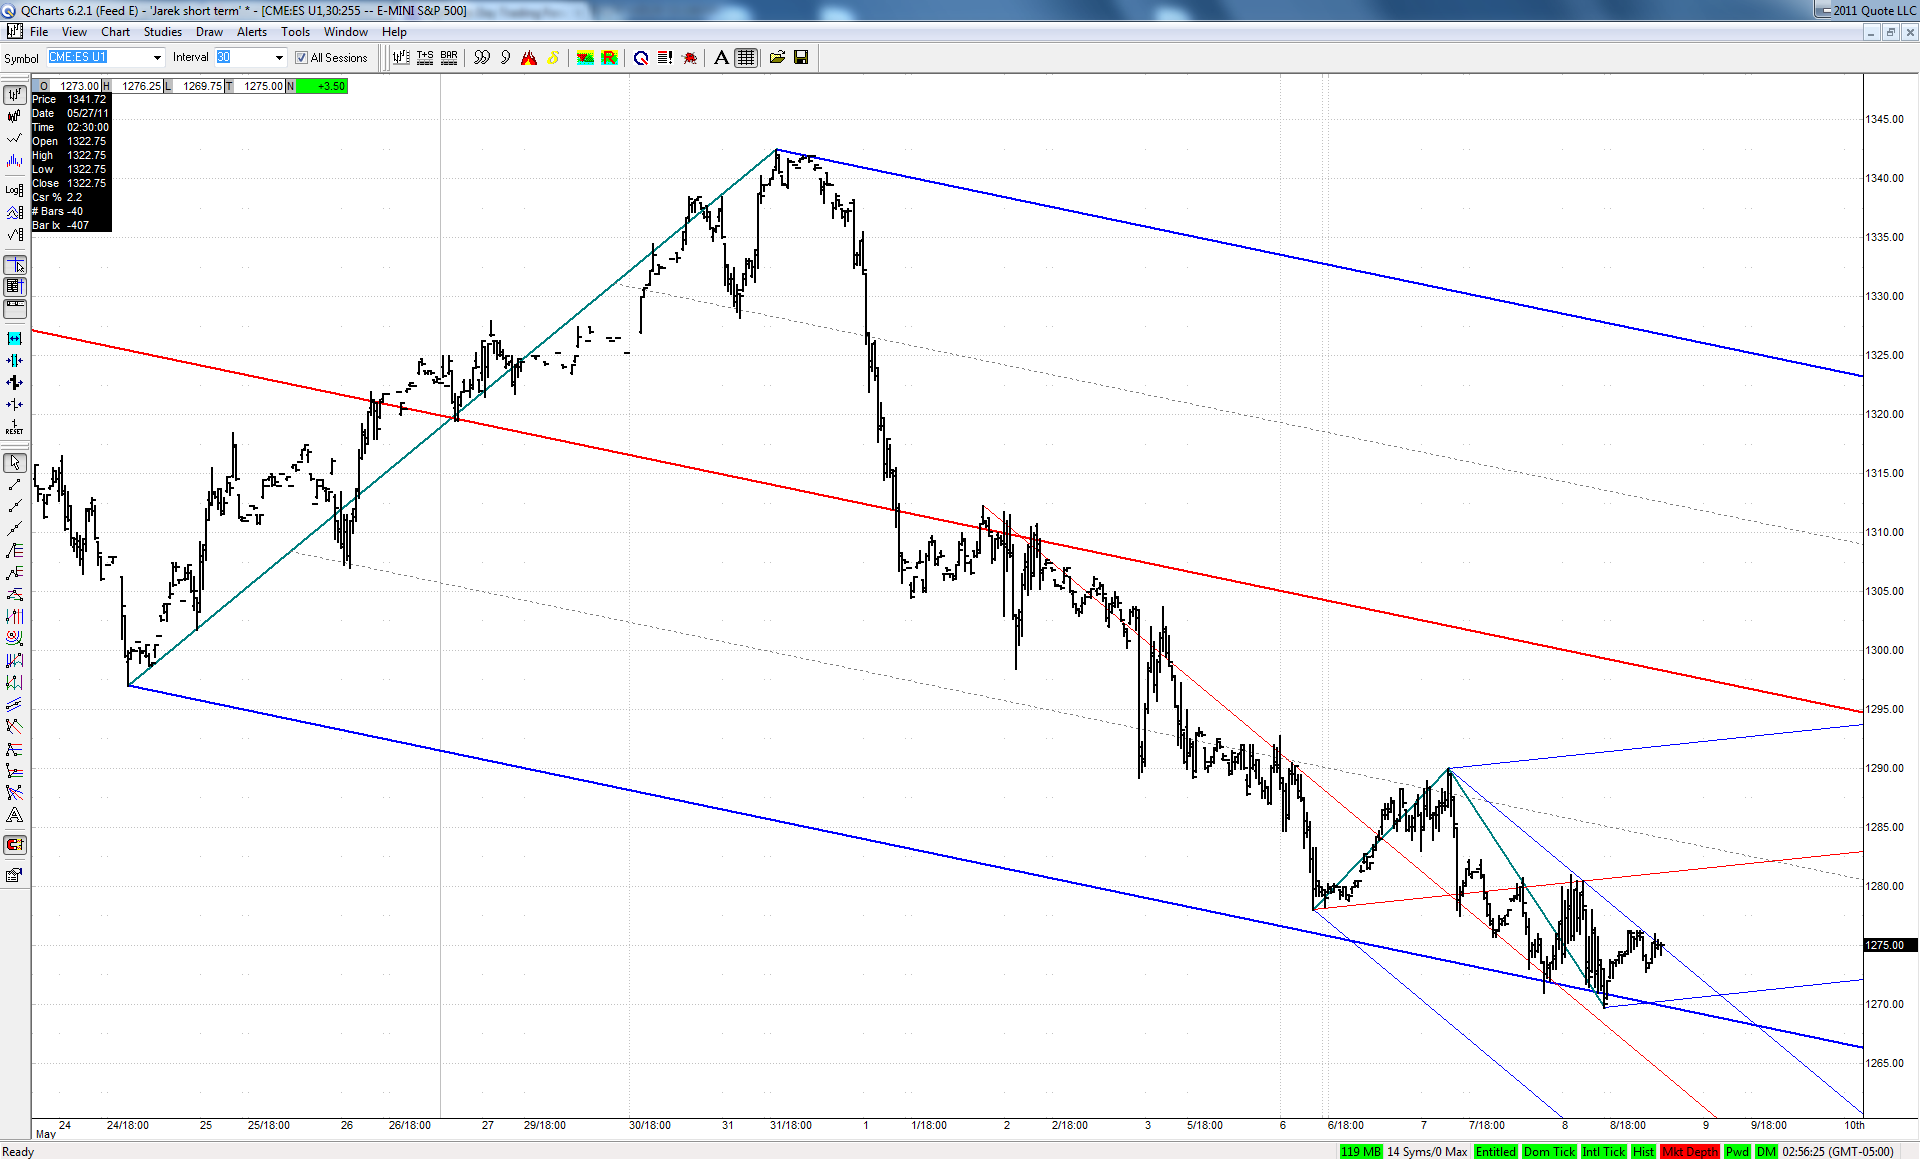
I'm long side bias into GLOBEX here. Understand, I am talking very short term here, for a GLOBEX 'daytrade'. If it moves, I'd be looking to stay with that bias until it stops moving. Long until wrong, as they say.
Originally posted by jimkane
It hit 75.25 and is bouncing. Is this it? Or another bounce they'll sell? And with rollover, and the Sept contract being 5.50 lower, that skews the continuous contract chart quite a bit. So, how to handle that? There isn't a good answer. I'll still chart the June contract on the higher timeframe for awhile.
Originally posted by jimkane
If they drop it, I'm watching 73.50-75, and 71.50, give or take.
JI
jimkane
Rep: 3,058
Posts: 33,089
I agree 1,000% percent, roofer, and I've only been looking at puts as this has unfolded, I haven't even entertained a single potential call play. I'm even ready to short something like CMG, and almost did over the last few days (I chickened out..., shorting a monster stock at all time highs and all not being my style). I think I'm going to be sorry I didn't, as the best chance may be past now.
One look at your SPY chart and that 114 looks like it is calling out to it. It's all part of the 'beg for QE3' plan, leading up to the August Jackson Hole speech. Just like last year. That's my thinking, anyway. Great posts and comments, roofer. I'm of the opinion that holding puts from earlier, even if it bounces, is the best plan. We'll see.
And I agree, everyone I see is saying bounce, and I'm thinking like you, collapse. That's why even intraday I was thinking it would rise, I think they would want to try to trap all those that think bounce, then kill them. Straight down, when so many fresh suckers are ready to bet on a substantial bounce here, how could they not take advantage of that? Just a thought.
Originally posted by roofer
in a nutshell ... if all the geometry of hundreds of stocks kicked in here.. then i would expect a move to the 114 spx area.not a forcast.. just an adding up....
TX
tx_ches
Rep: -10
Posts: 514
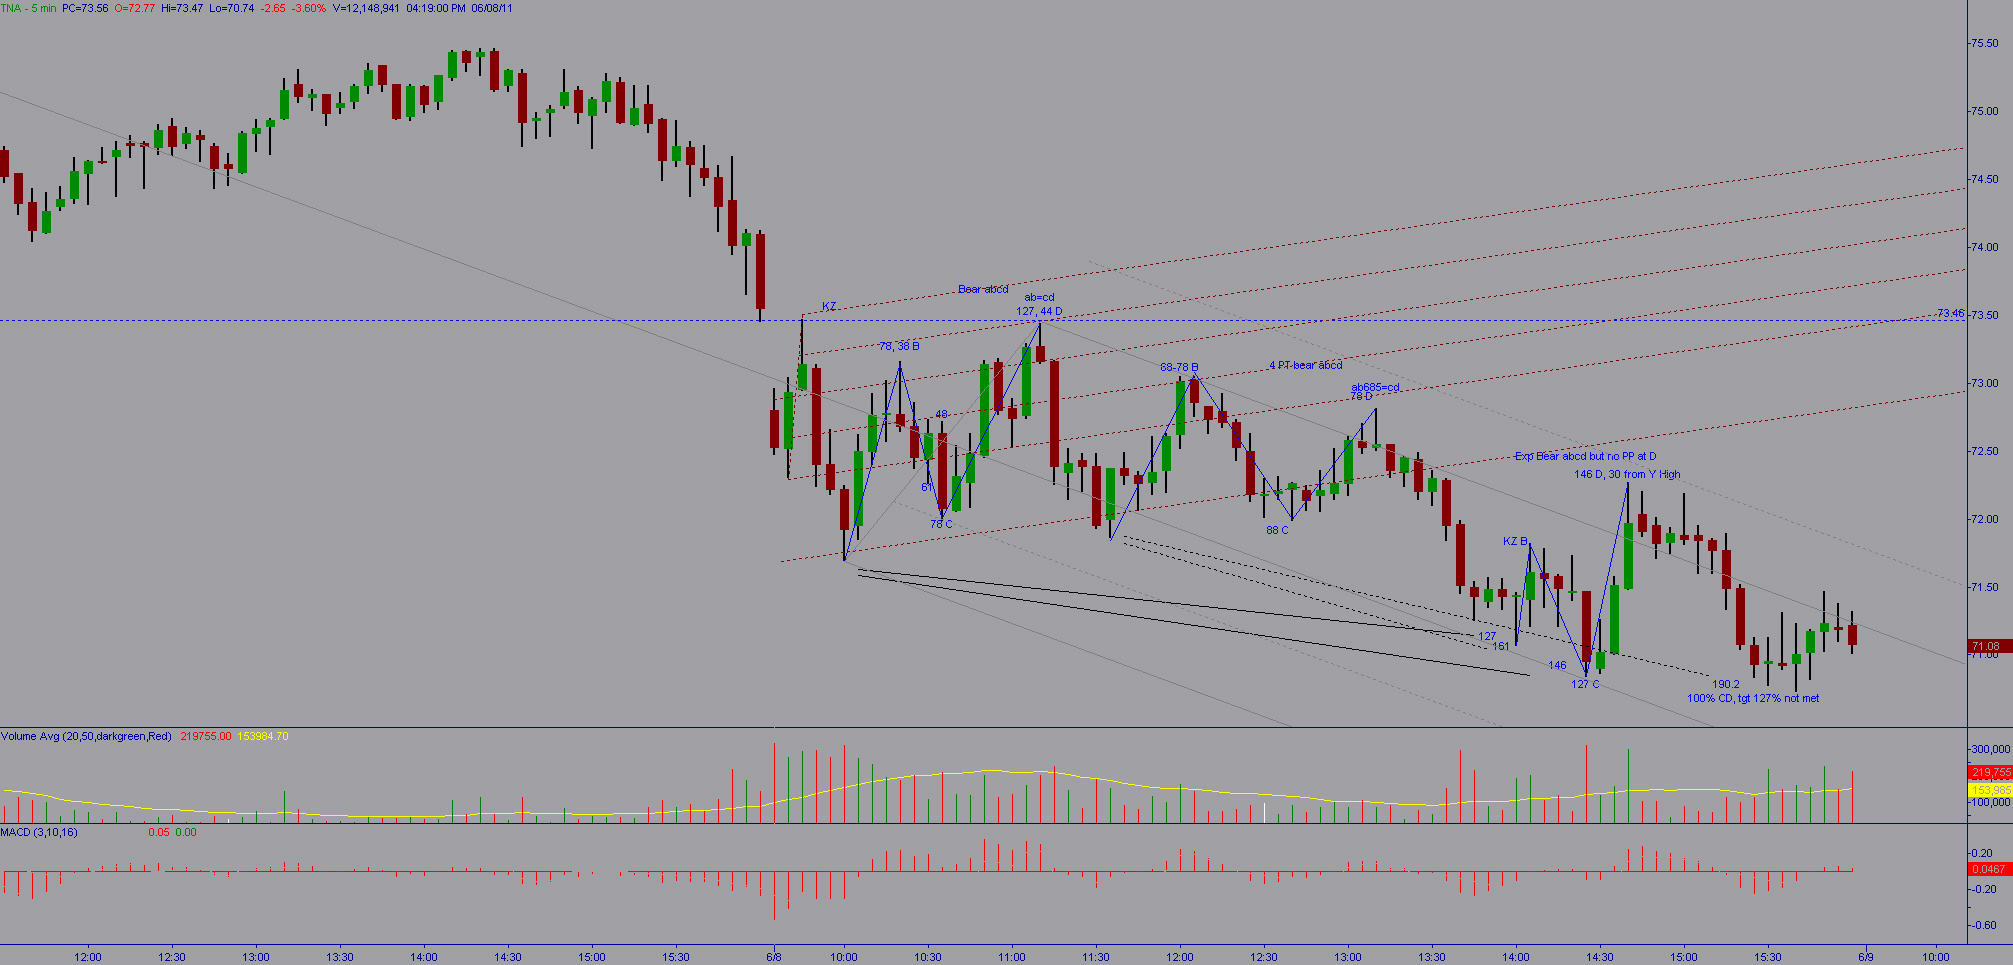
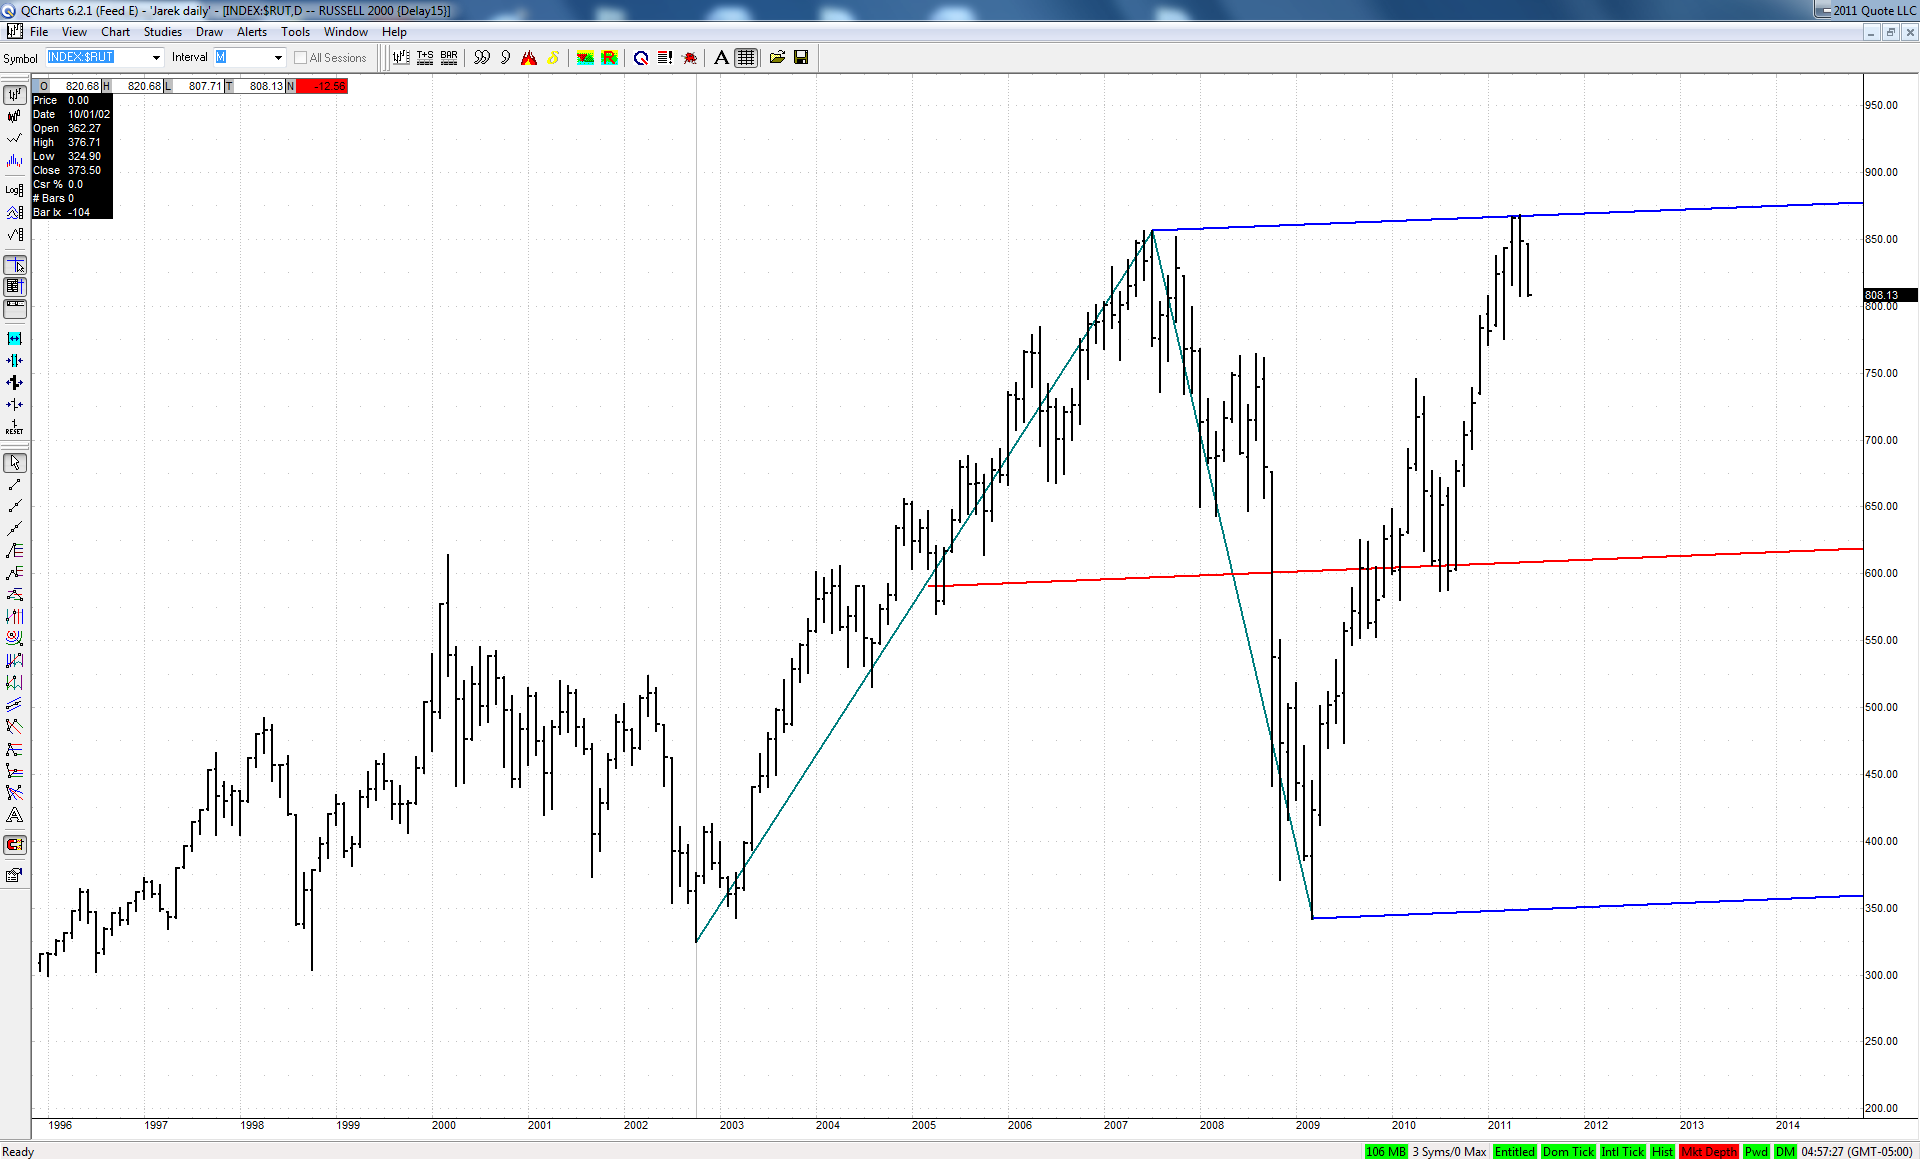
In the heat of battle, I was seeing both bull abcd's and bear abcd's.
At day's end, it seems obvious that I should lean only one way.
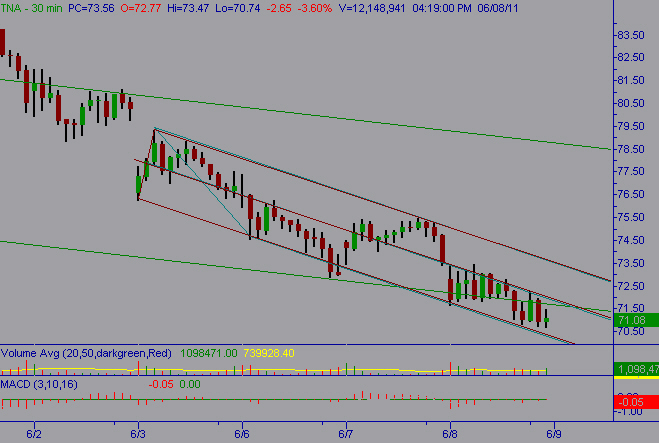
I'm still too quick to see the countertrend trade. HTF charts had some support for a turn up so I had some justification but I really don't need any to be contrary.
The last bear abcd doesn't look like it reached target but the rise is still in the KZ so I won't call it a failure just yet.
TNA 5 min (3X small cap bull)
RO
roofer
Rep: 3,689
Posts: 3,574
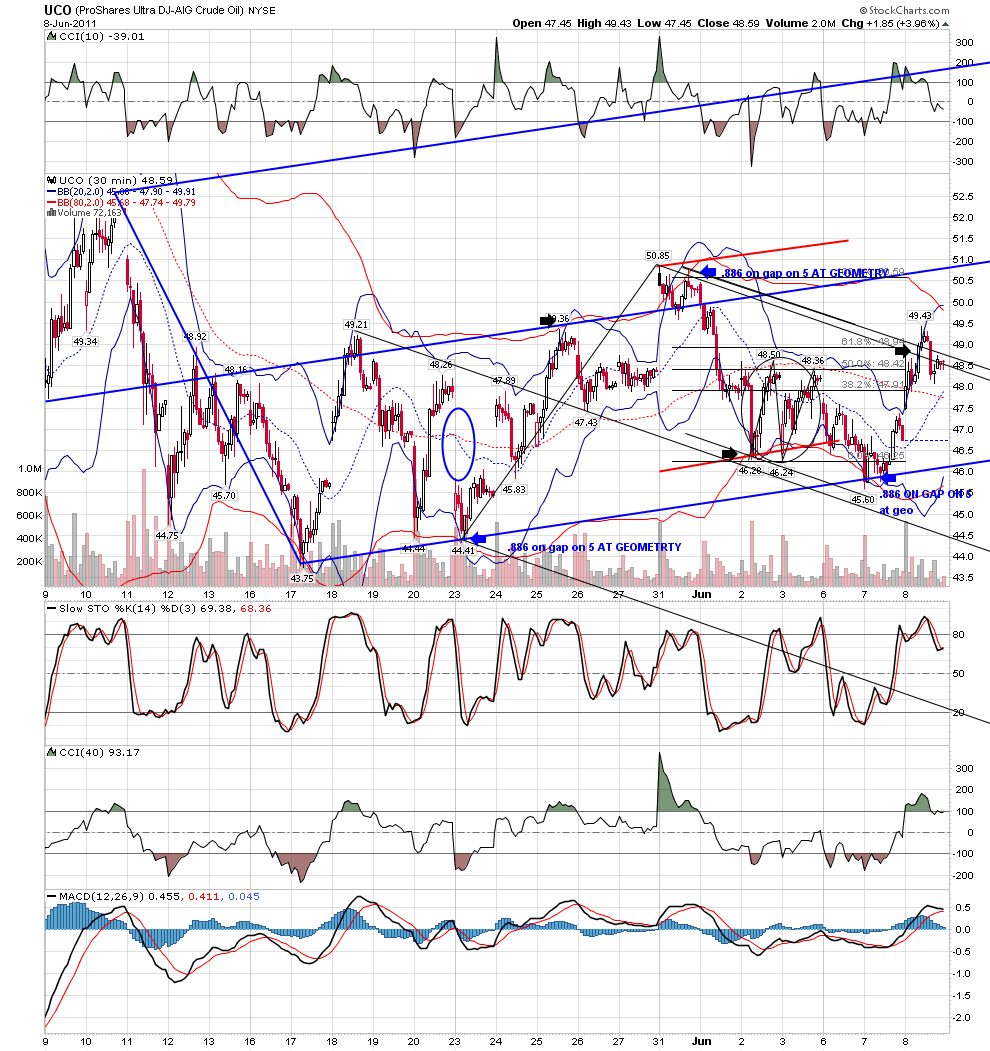
ches.. though jim and i have different approaches.... i think that we would agree that having a target is part of the trade in terms of how much is your initial risk...each of my last 3 trades in UCO was triggered by.886 on gap on 5 at geometry... WITH A LINE TARGET ALREADY IN PLACE TO JUDGE MY RISK.... at least for me, that is important...over and over, i want to trade predefined setup at geometry with a target to measure initial risk.
TX
tx_ches
Rep: -10
Posts: 514
Thanks, roofer. I had noticed that on your charts. It is my goal to be able to do that too. But I can't do it yet because I haven't collected the thousands of examples that you have to know what lines will work. The only one I feel a little confident of is your red line/green set. I do like your 1:4 calculation to set your risk when going for the median line target.
Originally posted by roofer
ches.. though jim and i have different approaches.... i think that we would agree that having a target is part of the trade in terms of how much is your initial risk...each of my last 3 trades in UCO was triggered by.886 on gap on 5 at geometry... WITH A LINE TARGET ALREADY IN PLACE TO JUDGE MY RISK.... at least for me, that is important...over and over, i want to trade predefined setup at geometry with a target to measure initial risk.