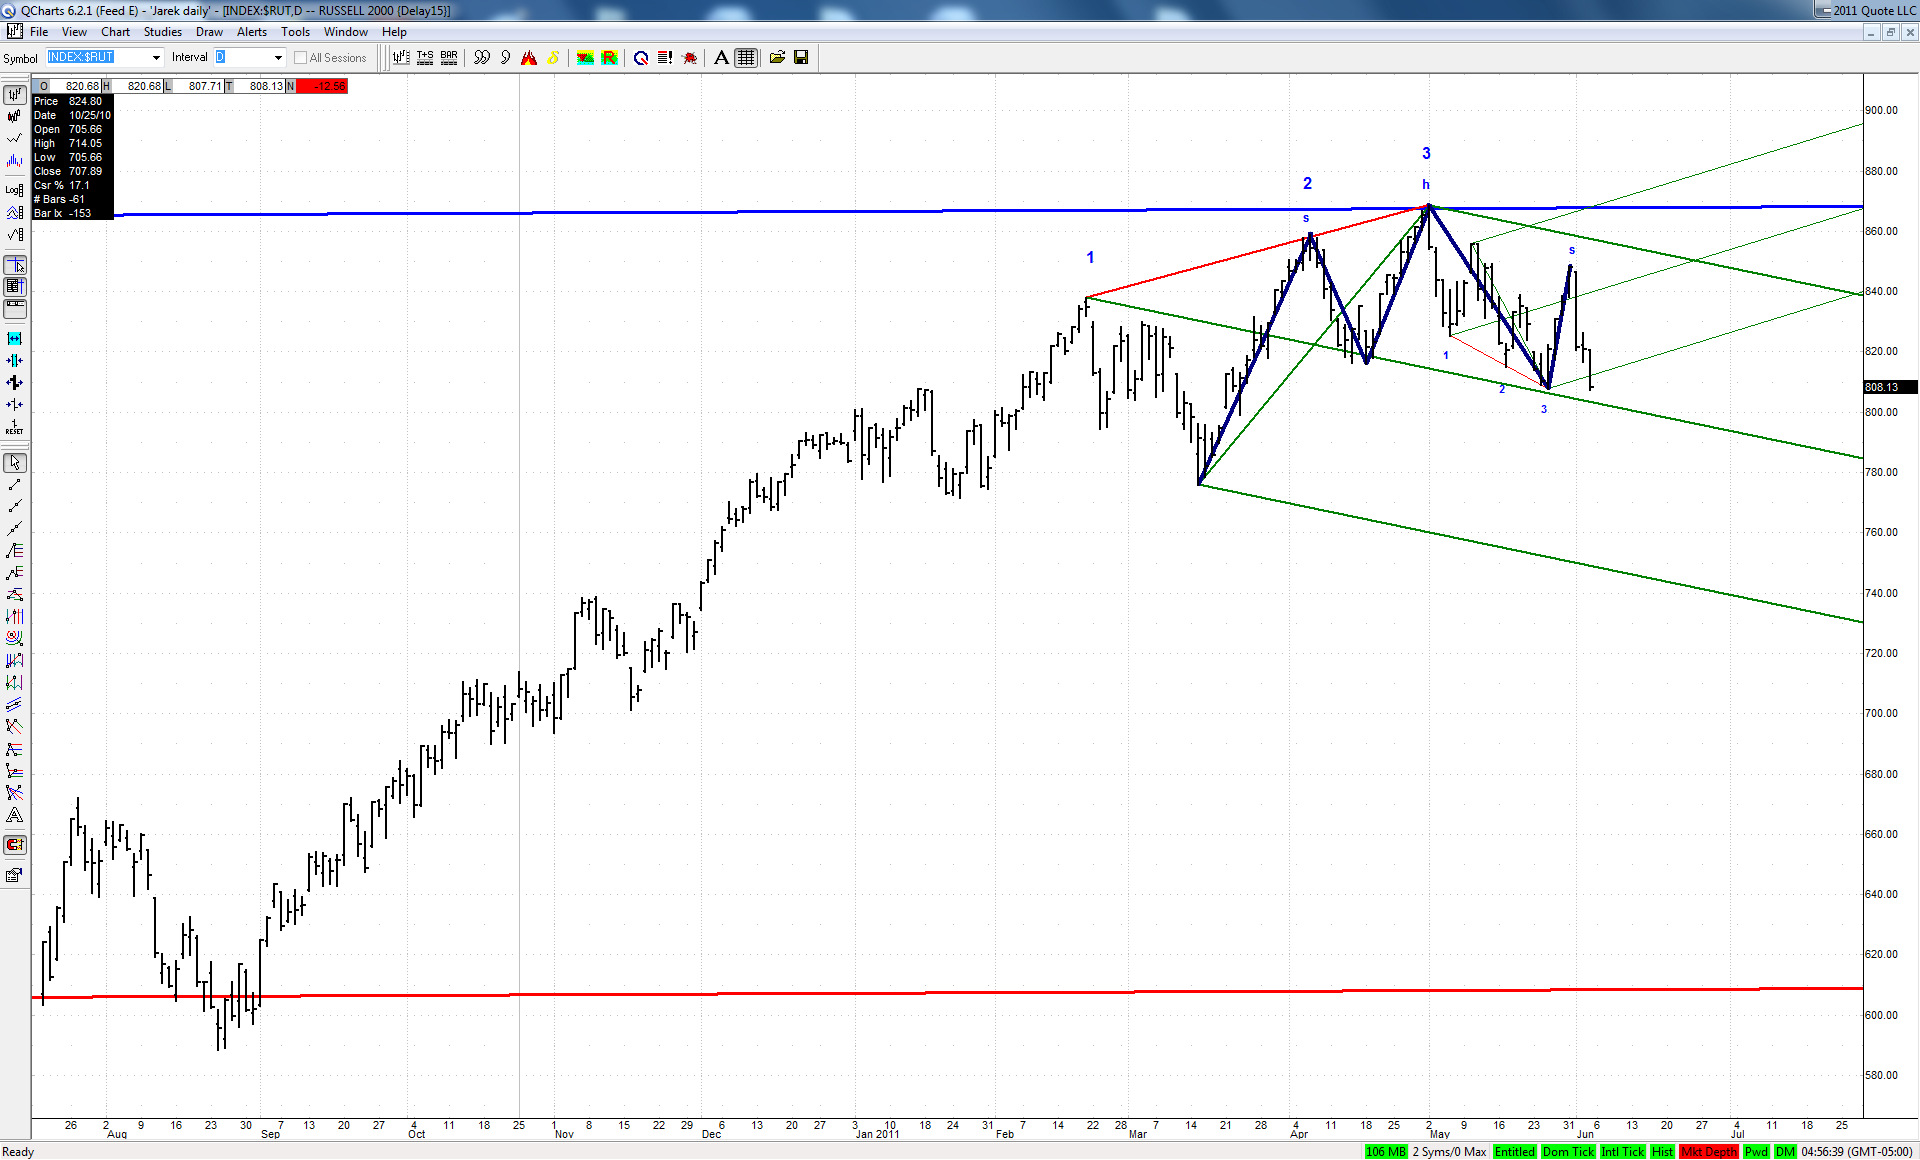
Jim suggested to take a look at daily charts of some secondary indexes and here is my current $RUT chart:
The green ML of a set based on big bearish 3D happens to be also a neckline of a classic head and shoulders. If bulls would not be able to defend this line next week, then a move to the lower ML should follow. This would also be a perfect fulfillment of a successful H&S pattern.
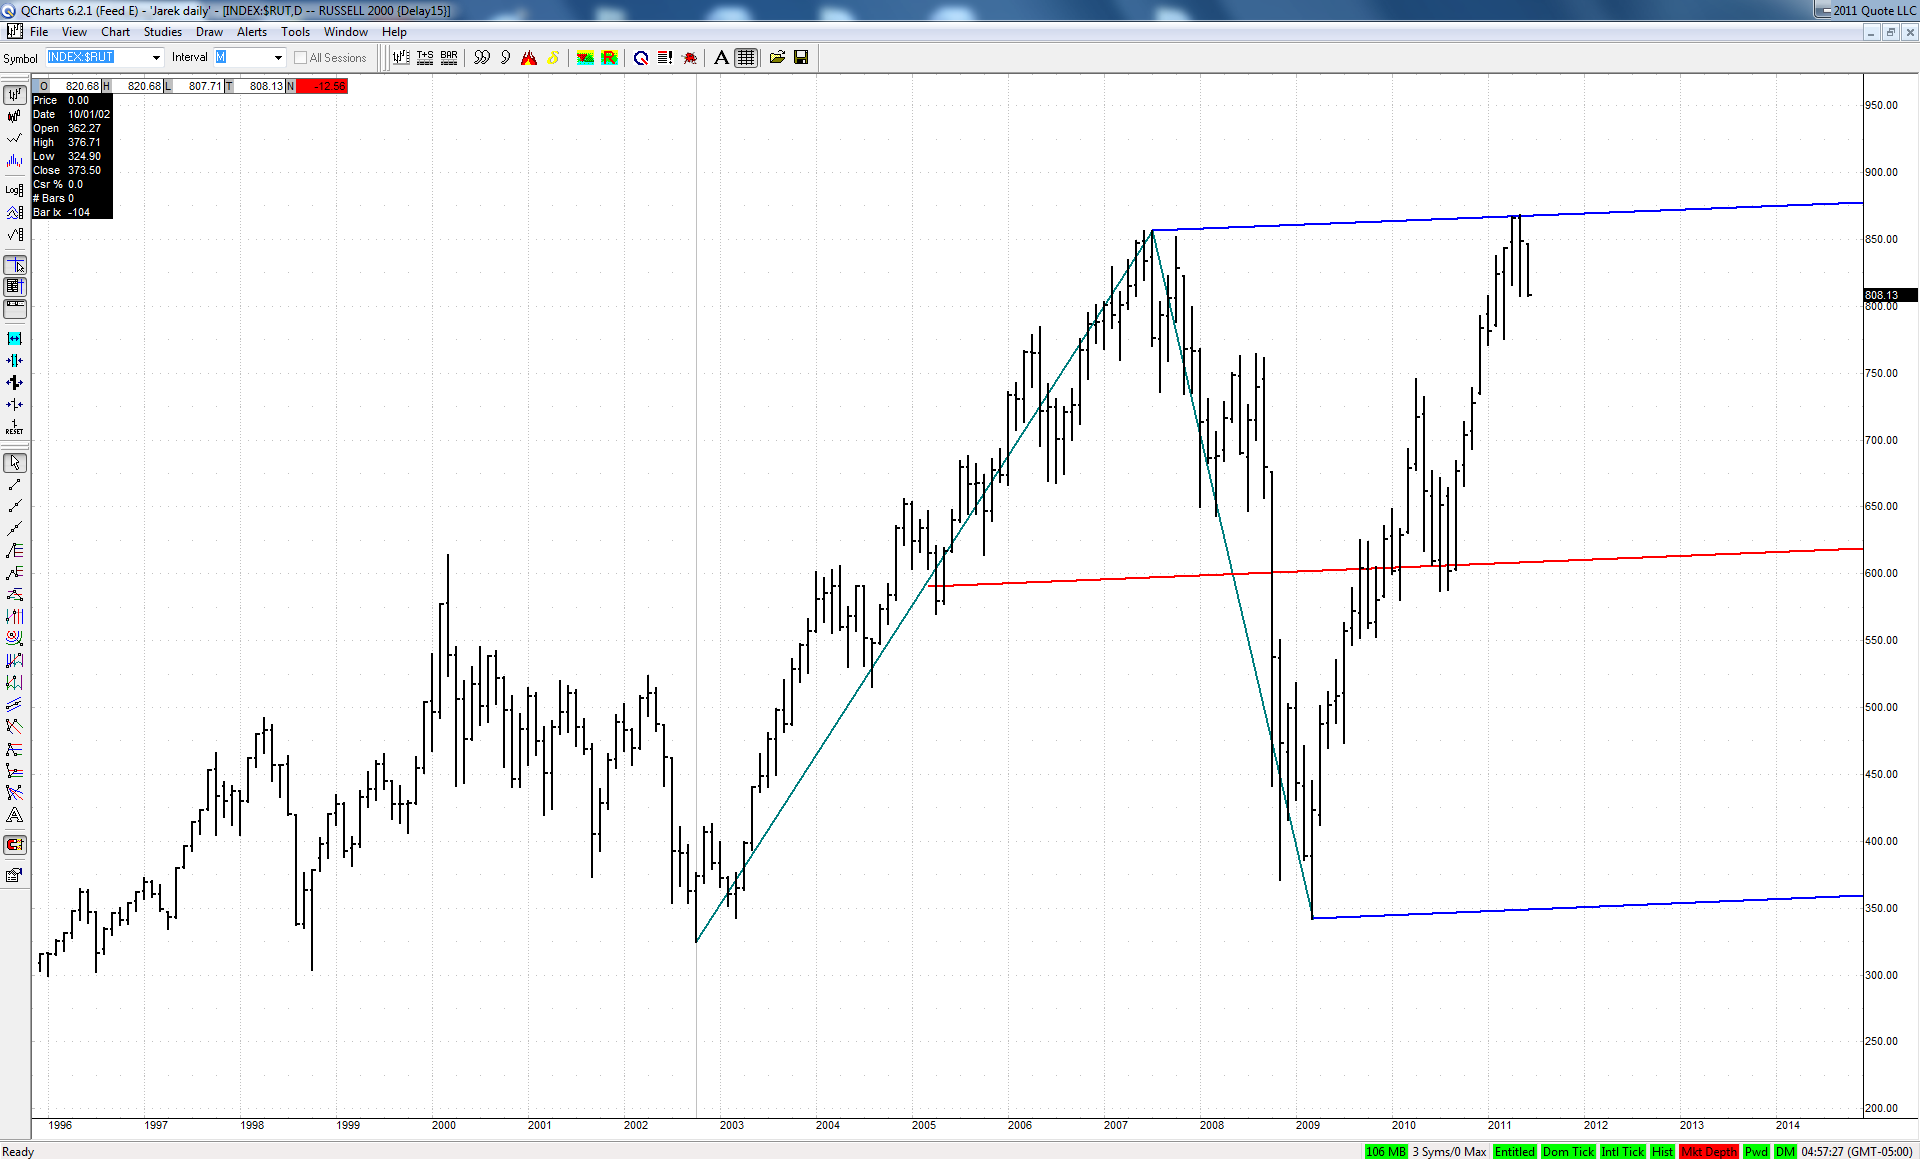
It is all the more interesting as this big bearish 3D fell dead on at the upper ML of a quite important set:
TX
tx_ches
Rep: -10
Posts: 514
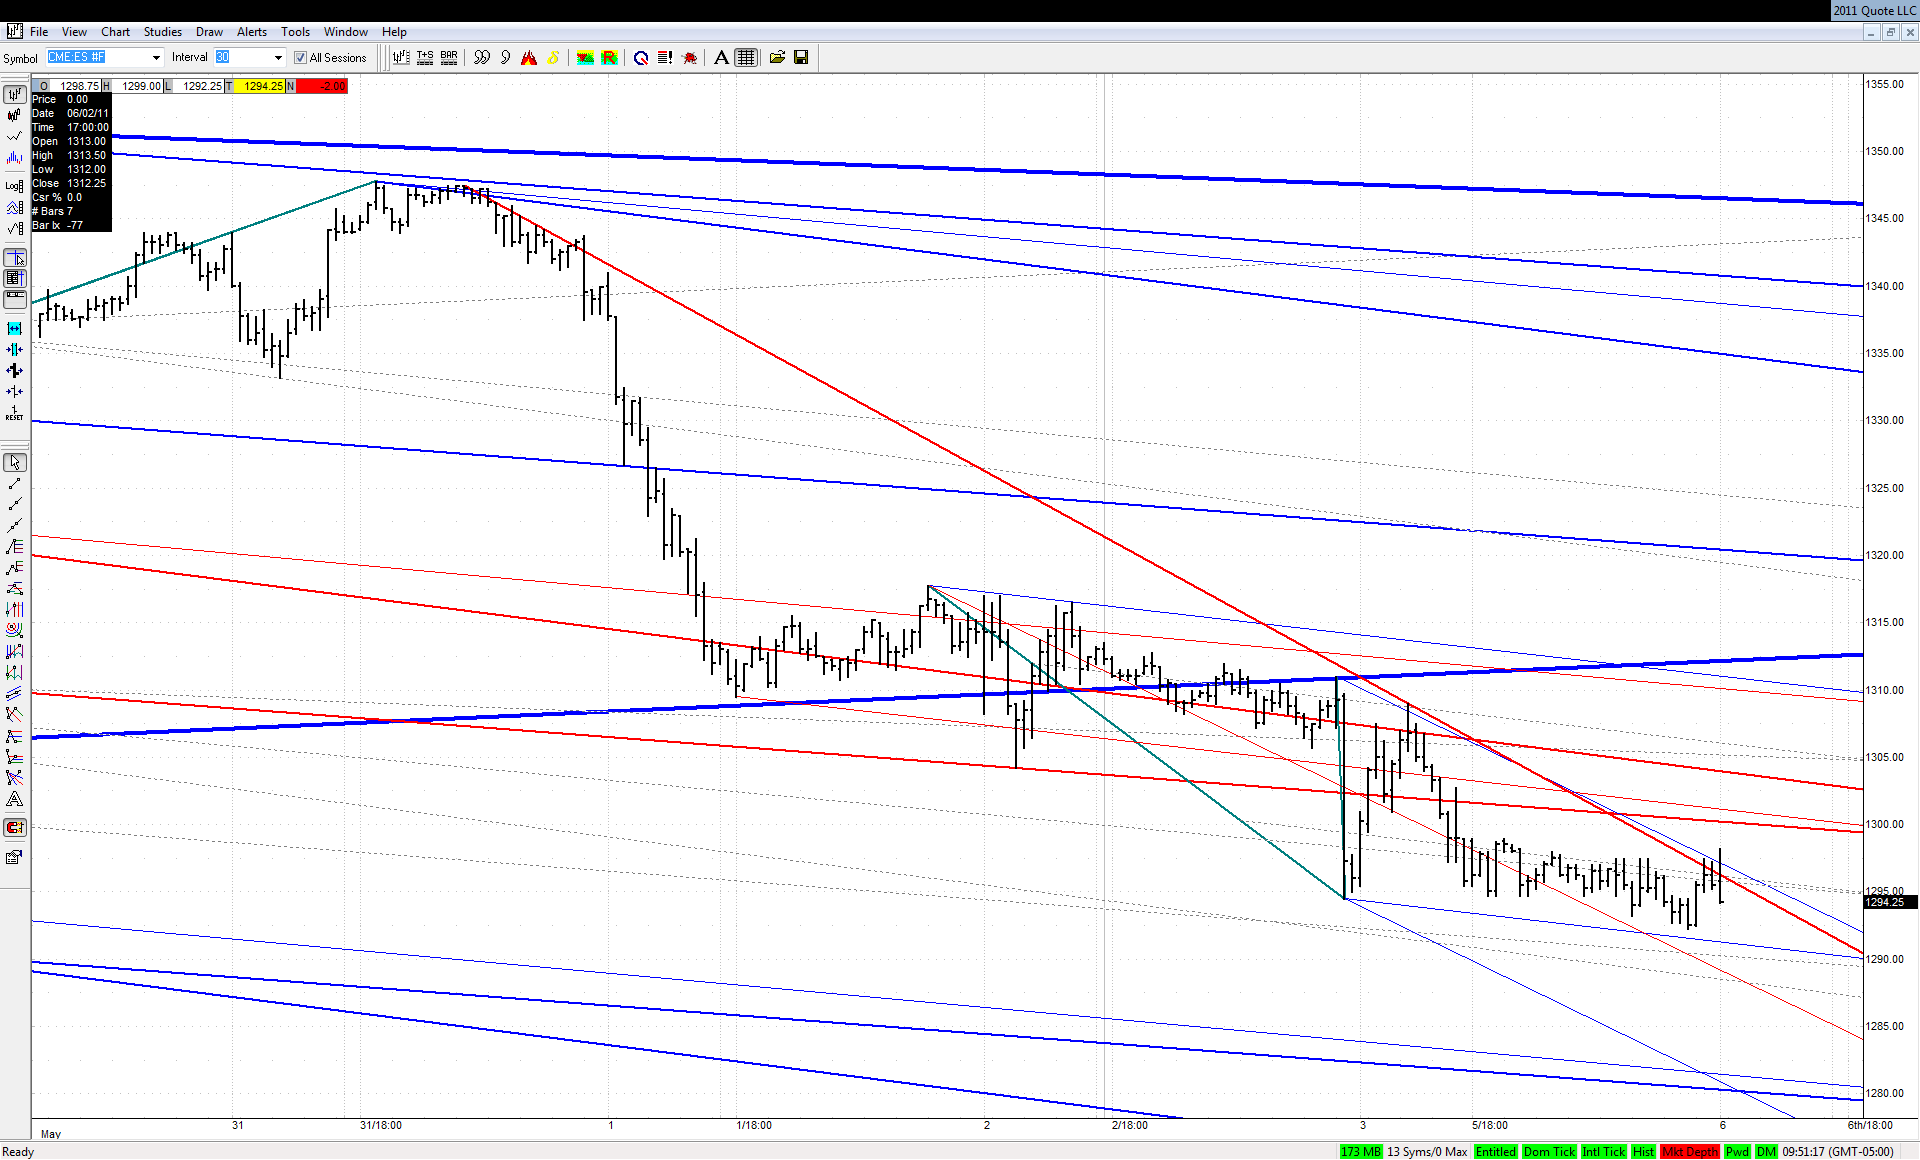
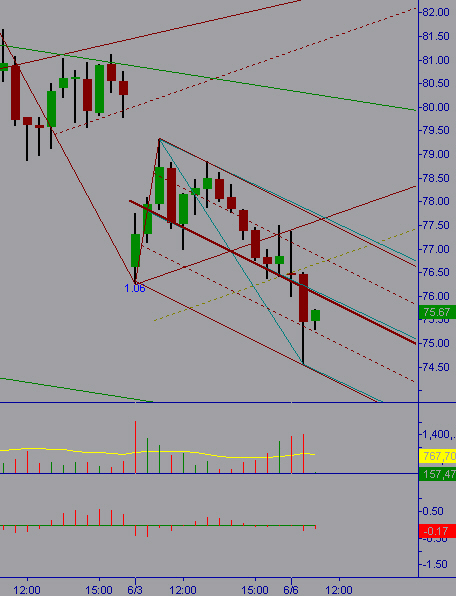
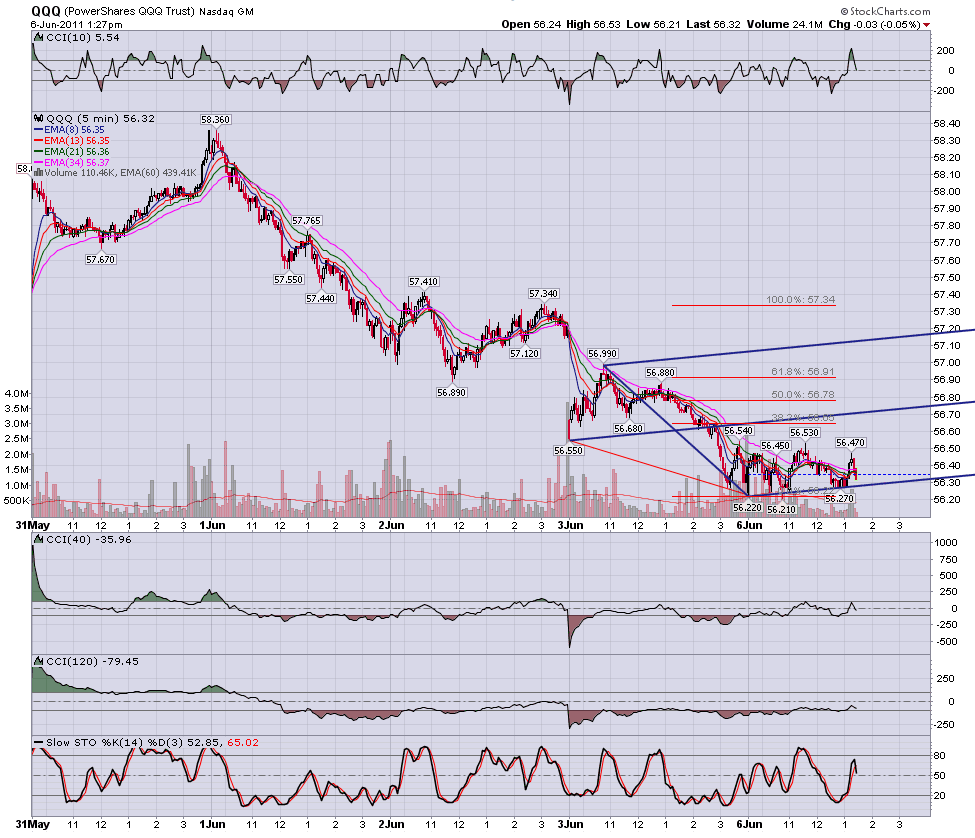
TNA 30 minute.
Did TNA have to go up on Friday to set up the geometry in the market?
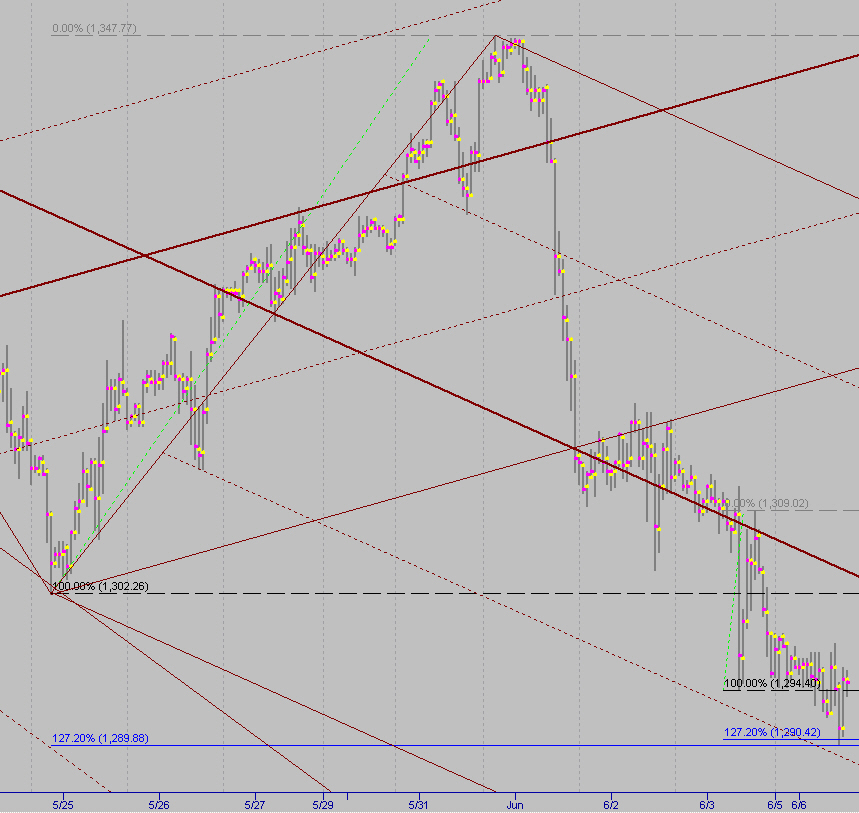
2 overlapping sets: gap set on gap on Friday (brown set) and Friday H-L to today low Schiff bluegreen set.
Today reversed at 88% of Friday's last little swing on 5 minute(not shown).
Currently has retraced to KZ of today's high to low swing.