MyPivots
Sign In
JA
jarek
Rep: 94
Posts: 3,474
Jim suggested to take a look at daily charts of some secondary indexes and here is my current $RUT chart:

Click image for original size
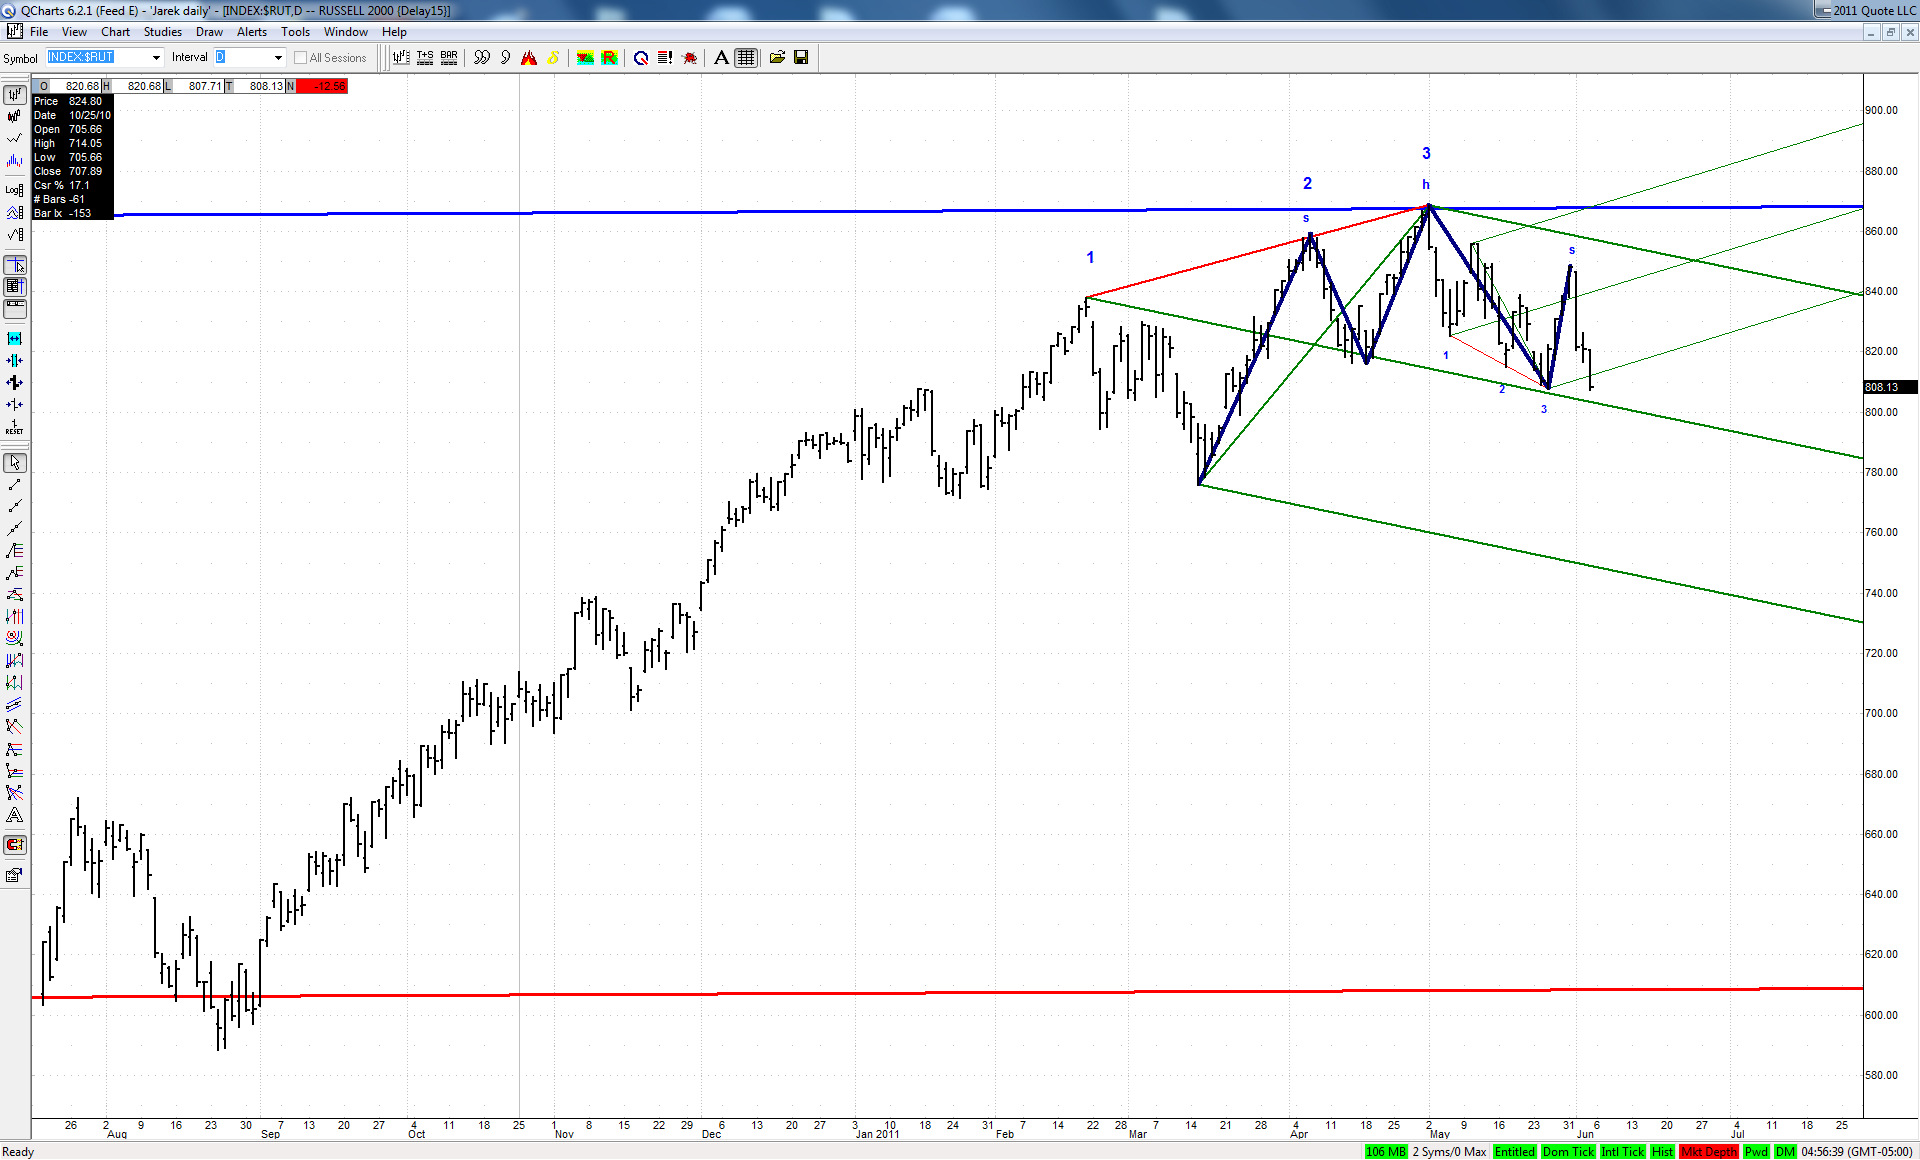

The green ML of a set based on big bearish 3D happens to be also a neckline of a classic head and shoulders. If bulls would not be able to defend this line next week, then a move to the lower ML should follow. This would also be a perfect fulfillment of a successful H&S pattern.
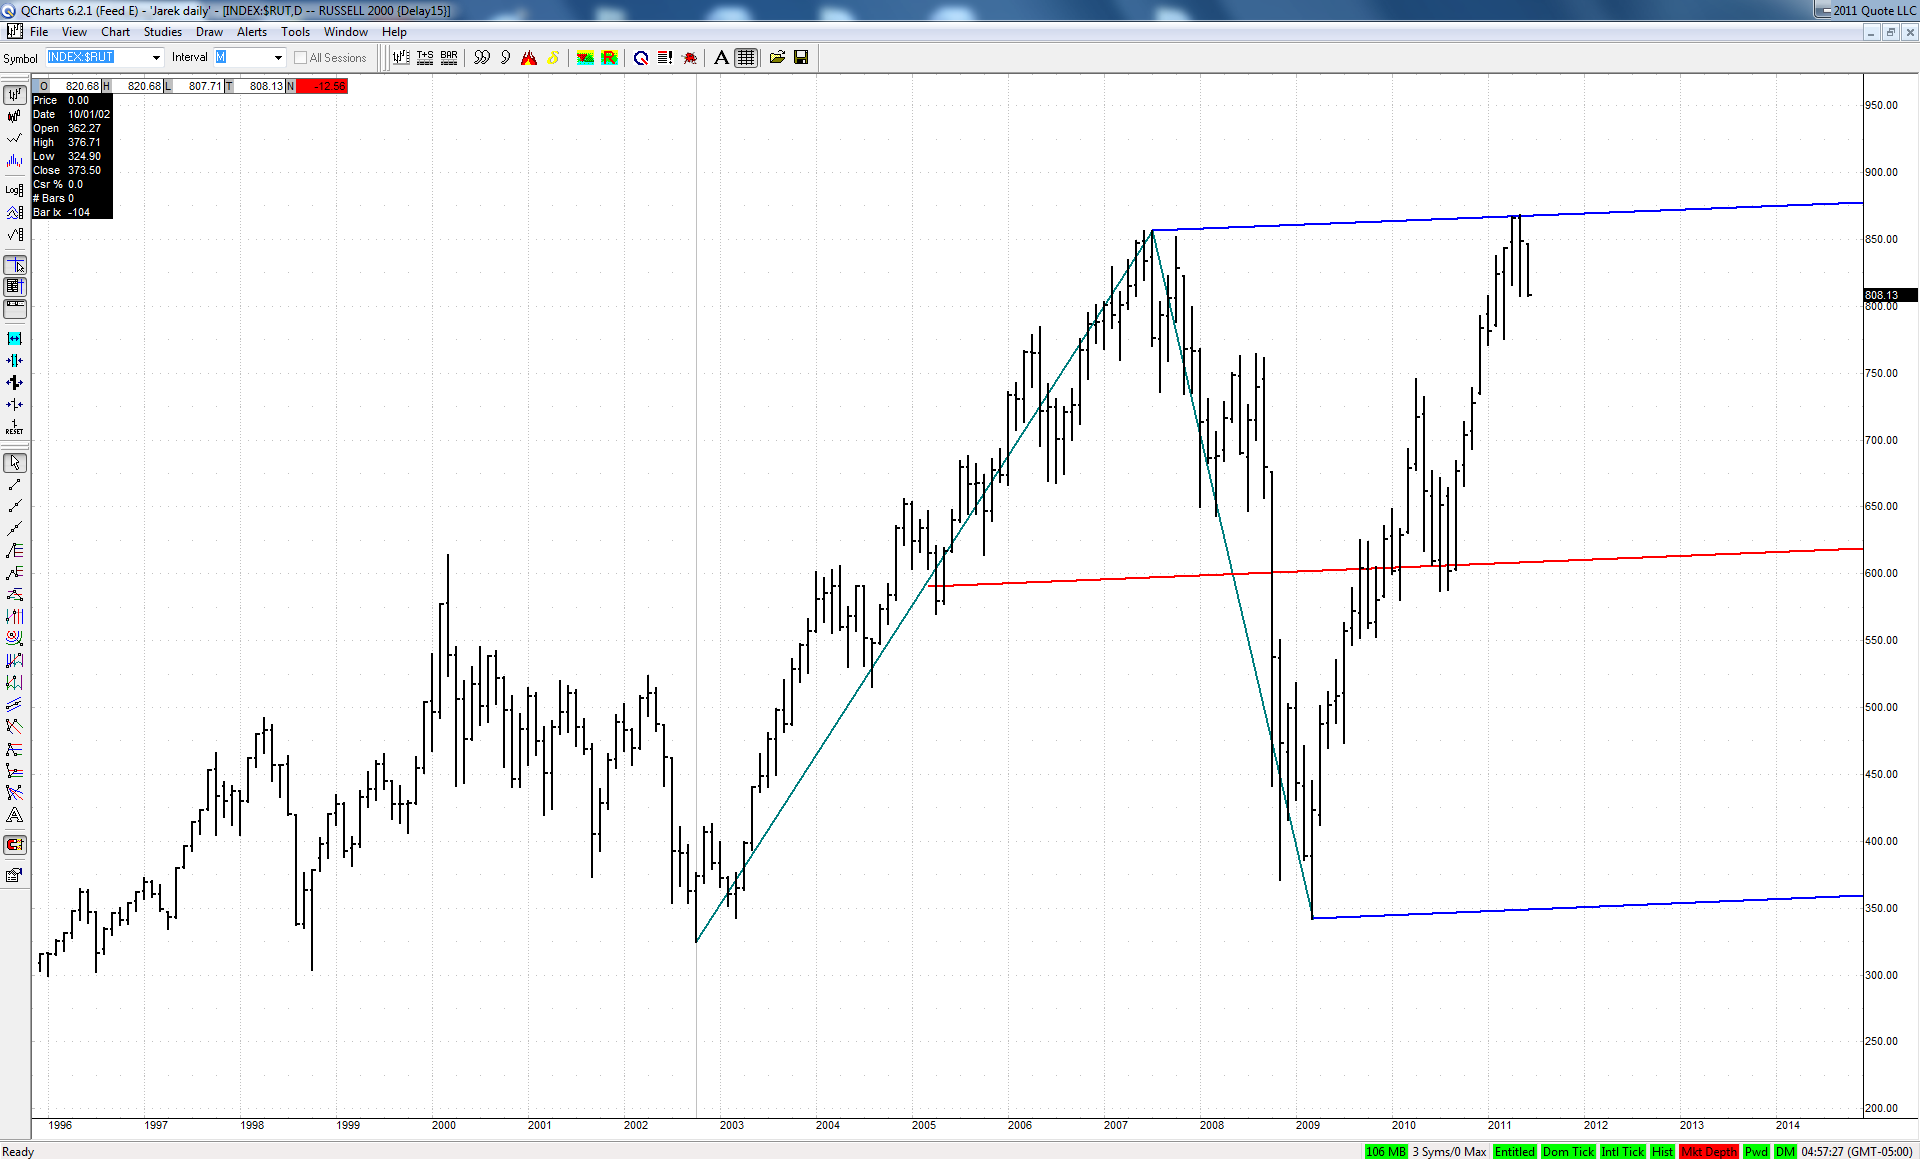
It is all the more interesting as this big bearish 3D fell dead on at the upper ML of a quite important set:

Click image for original size
IS
iso
Rep: 0
Posts: 81
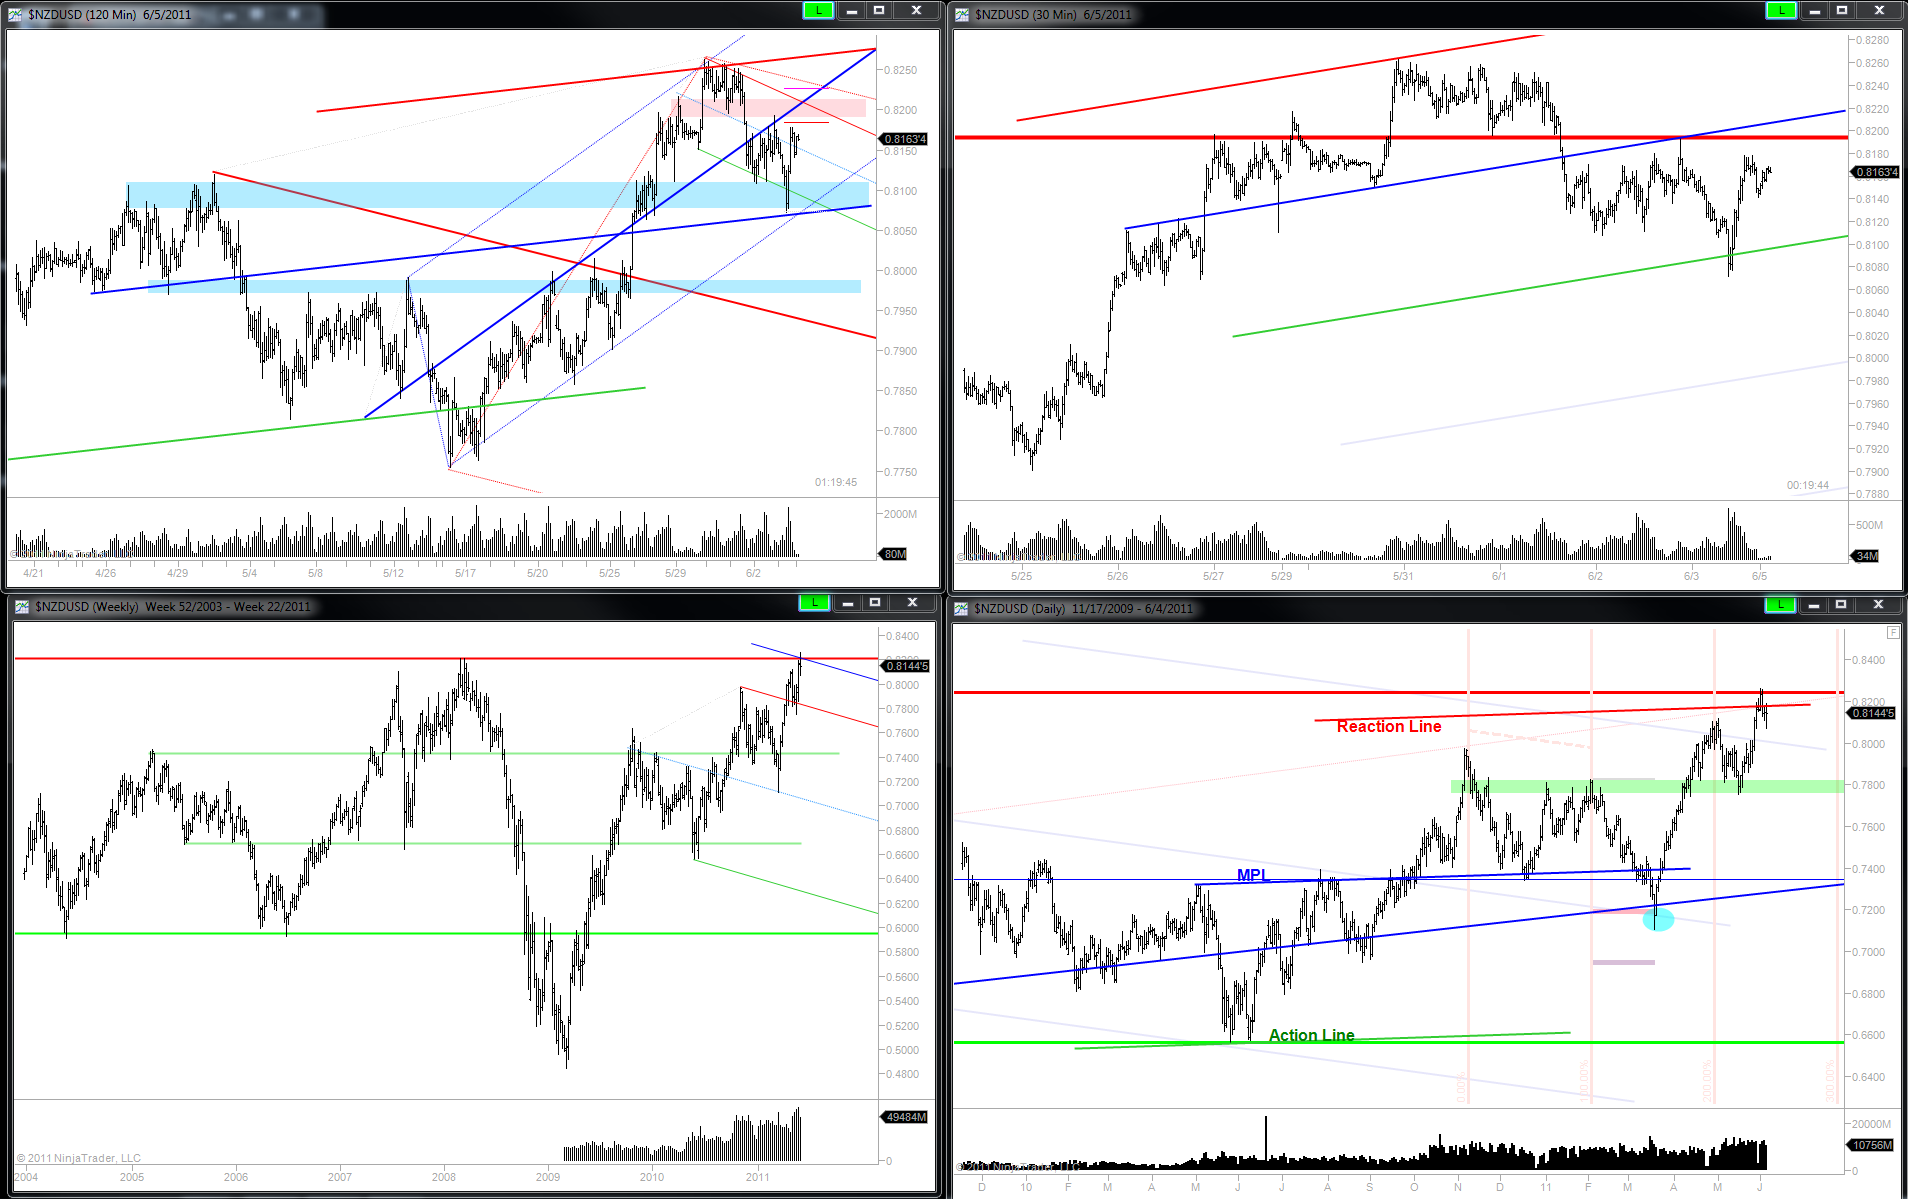
NZDUSD work .....
Click image for original size
RA
rat89
Rep: 0
Posts: 7,015
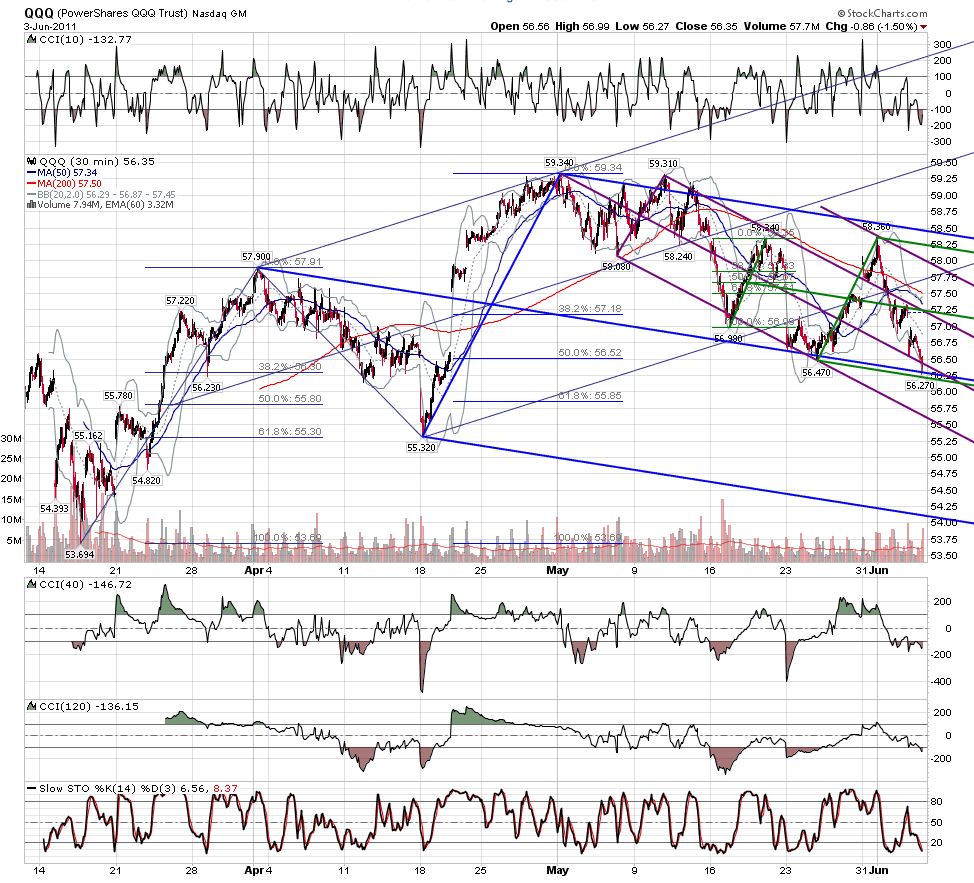
meanwhile, the q's parked right at the 1.128 of the last swing up at what looks to be an important spot.

Click image for original size


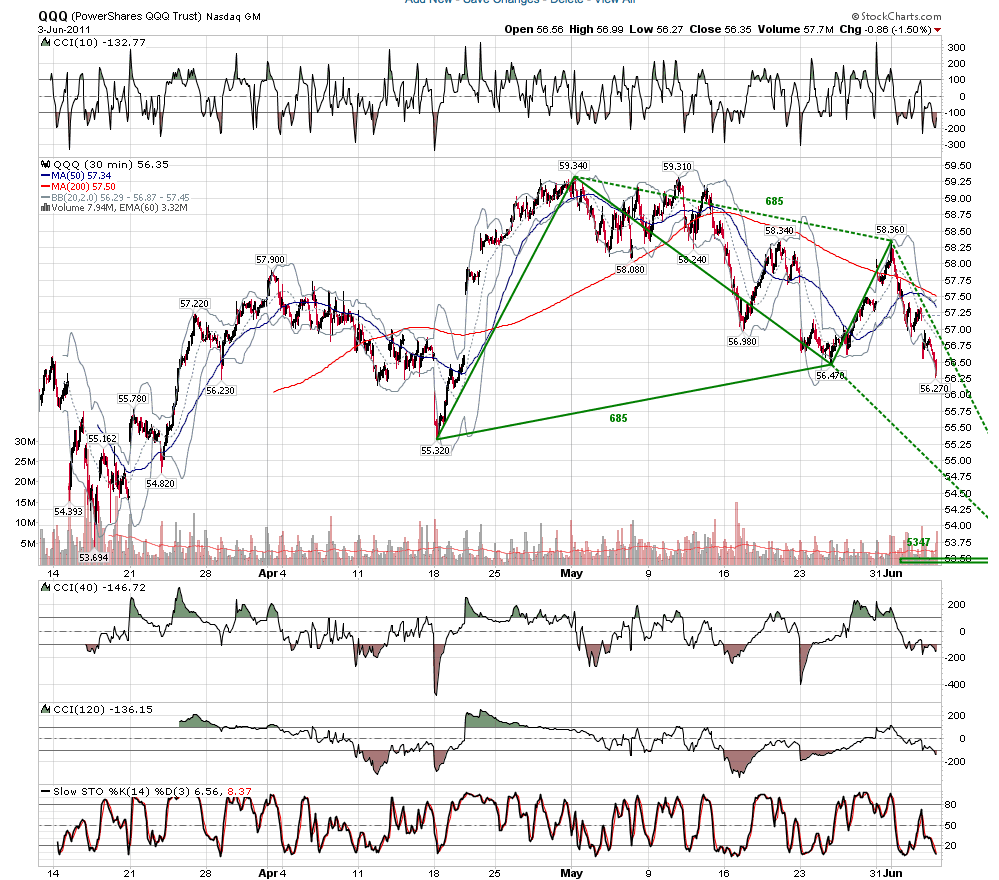
however.....a bounce that fails and takes it through that median line could deliver the 5 point that is setting up with a d at 5347....seems too neat, doesn't it?


Click image for original size
IS
iso
Rep: 0
Posts: 81
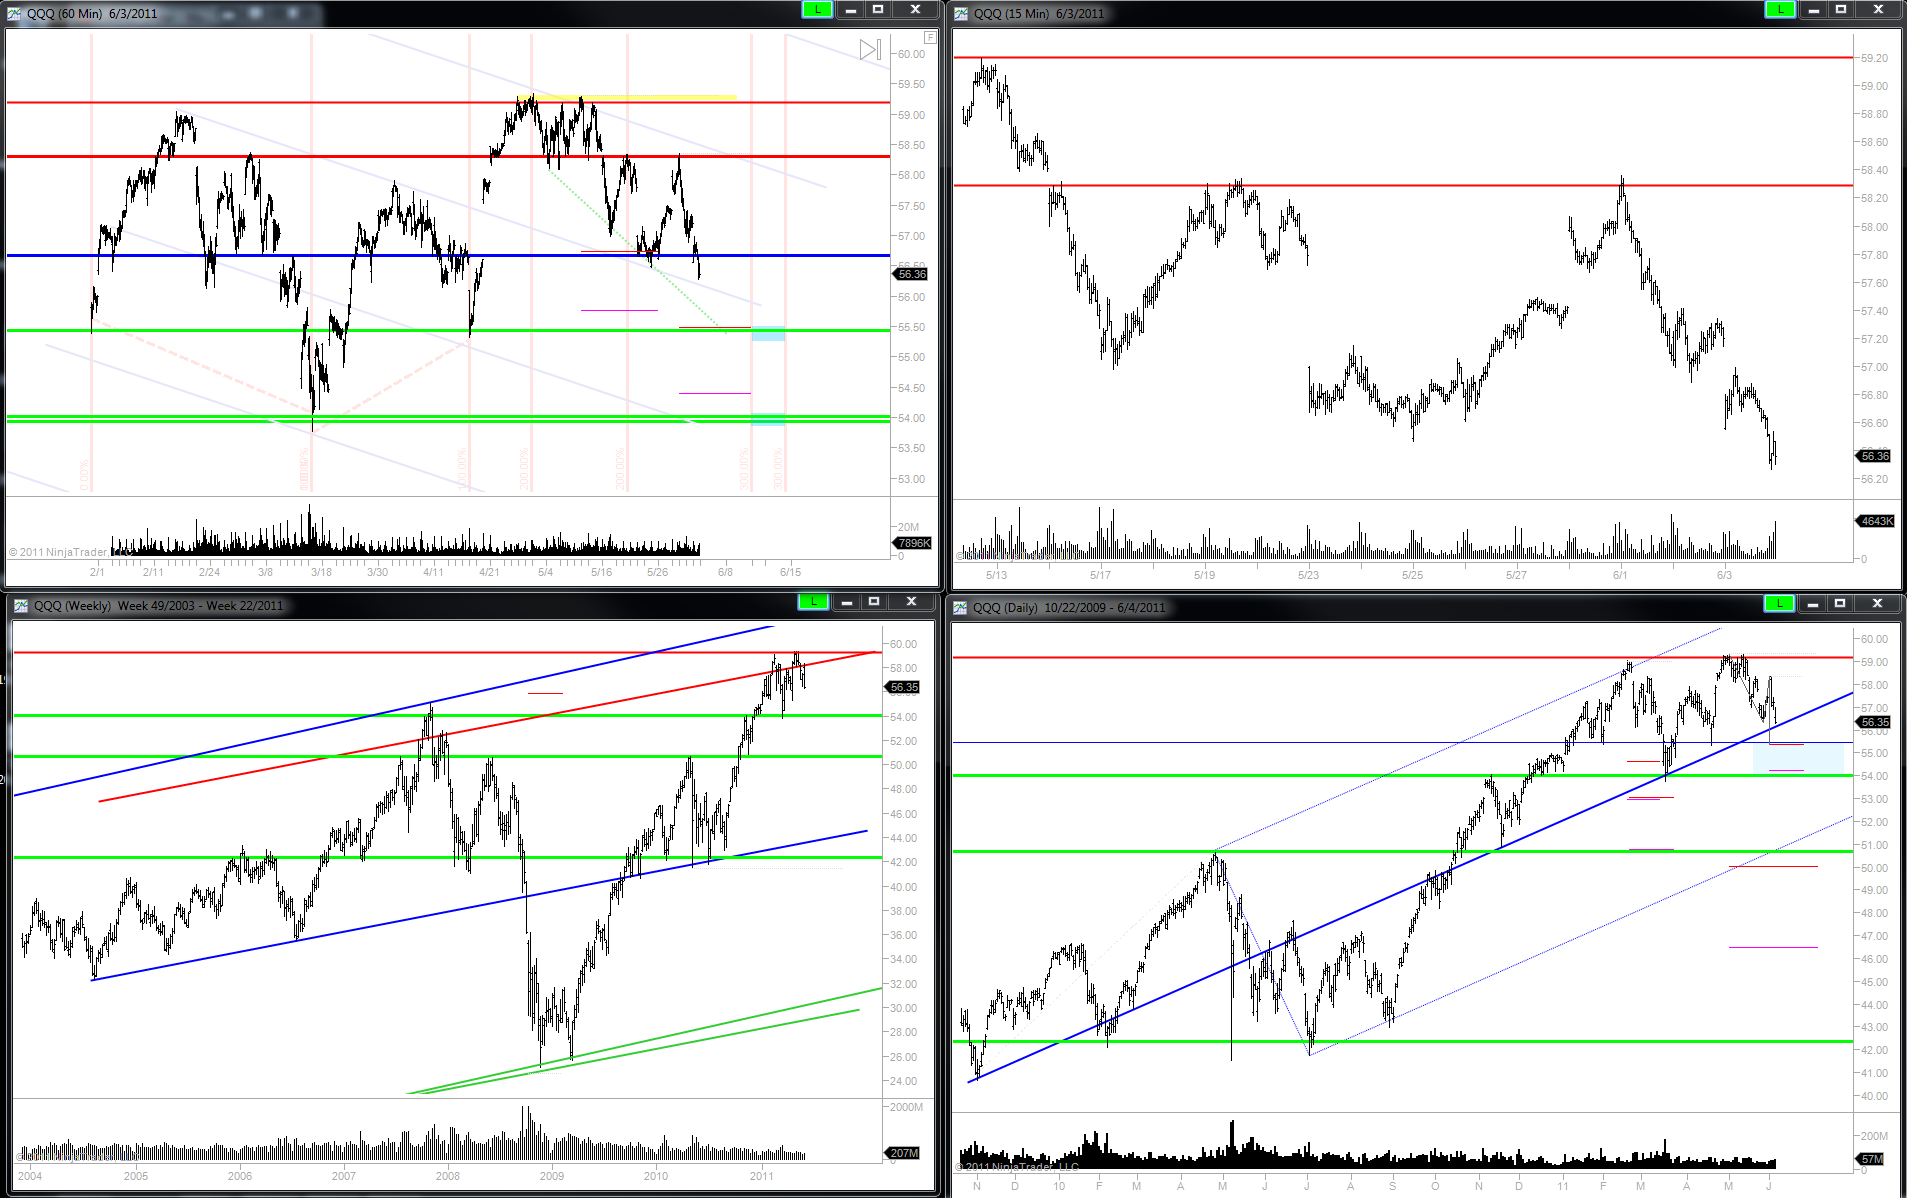
I'm watching 55.50 then 54 on the QQQ with timing near the 15th

Click image for original size
IS
iso
Rep: 0
Posts: 81
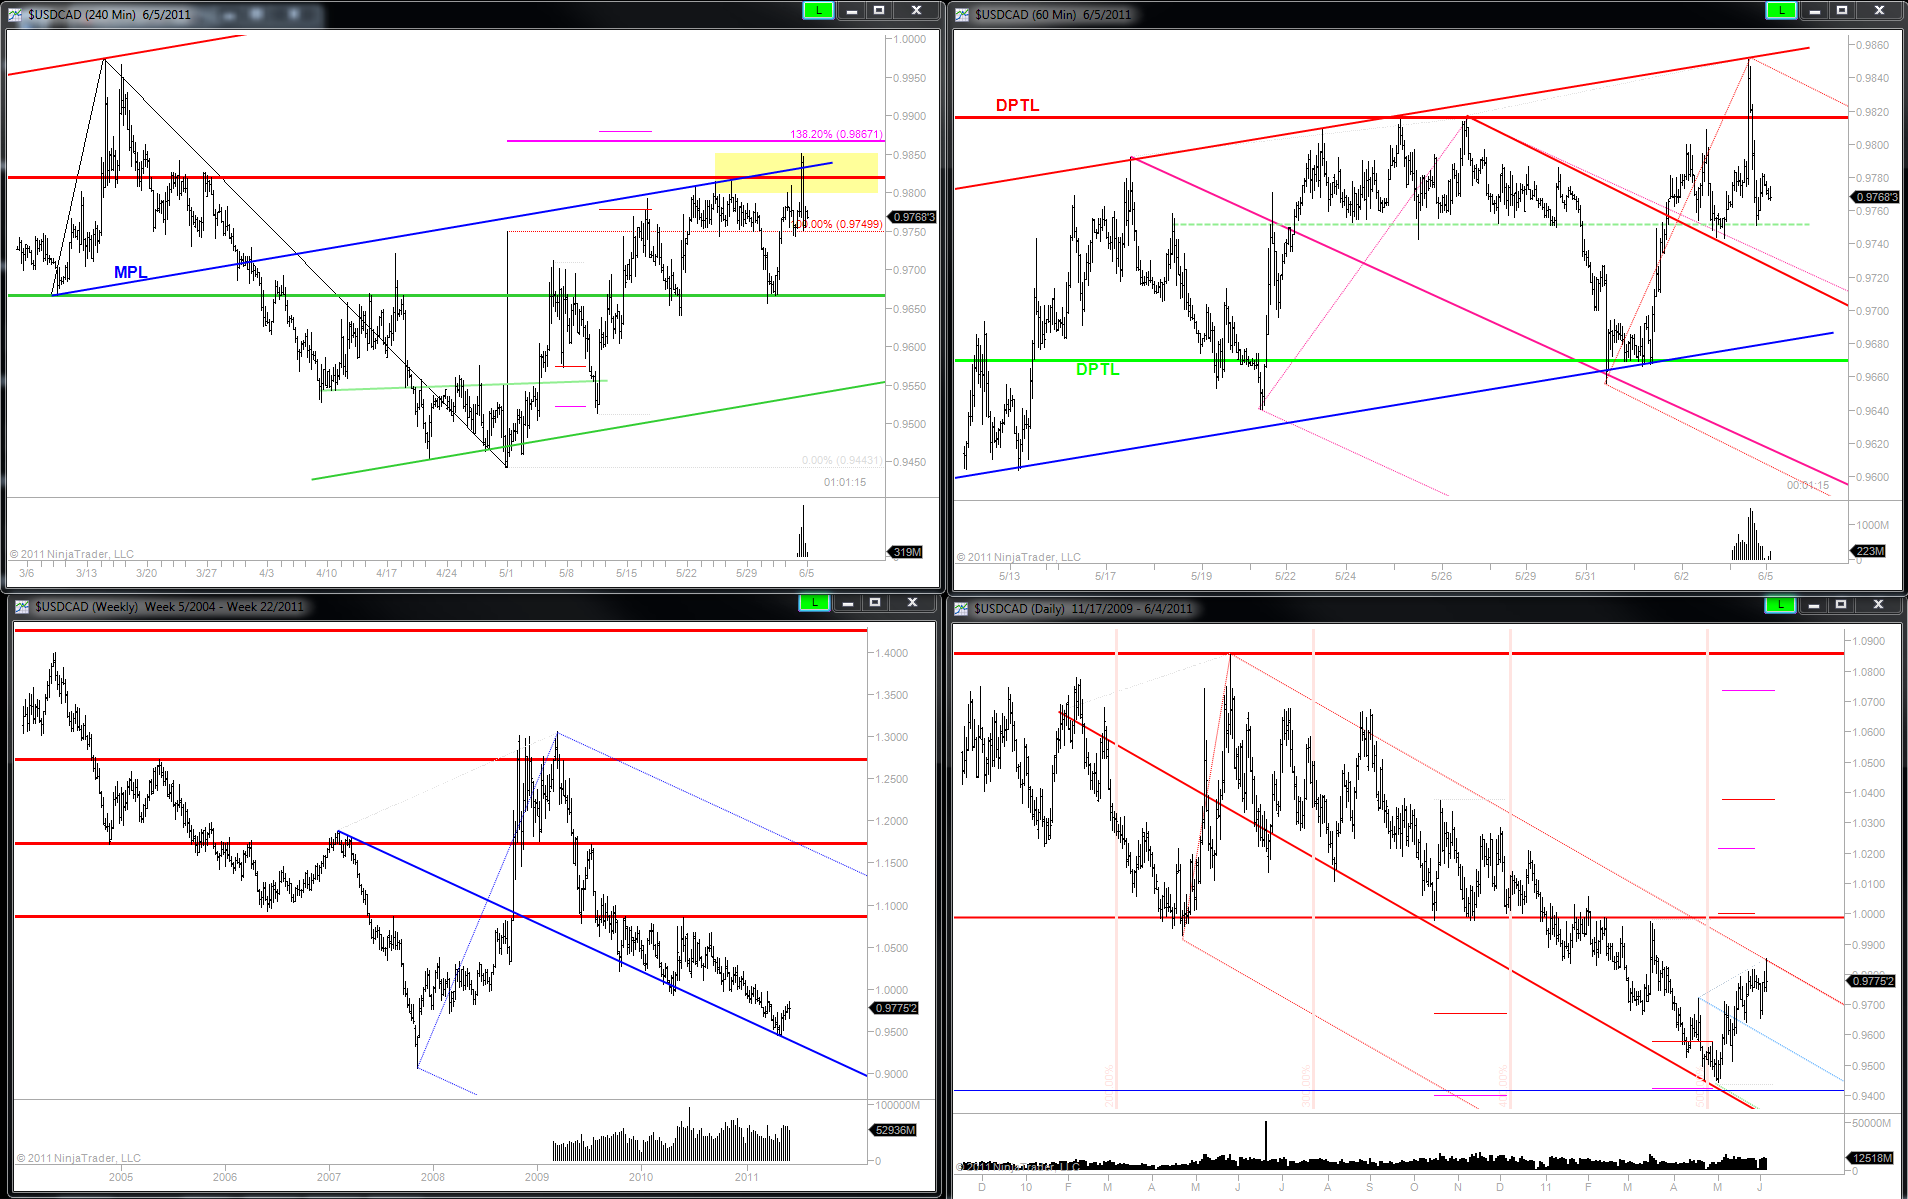
USDCAD ....

Click image for original size
JI
jimkane
Rep: 3,058
Posts: 33,089
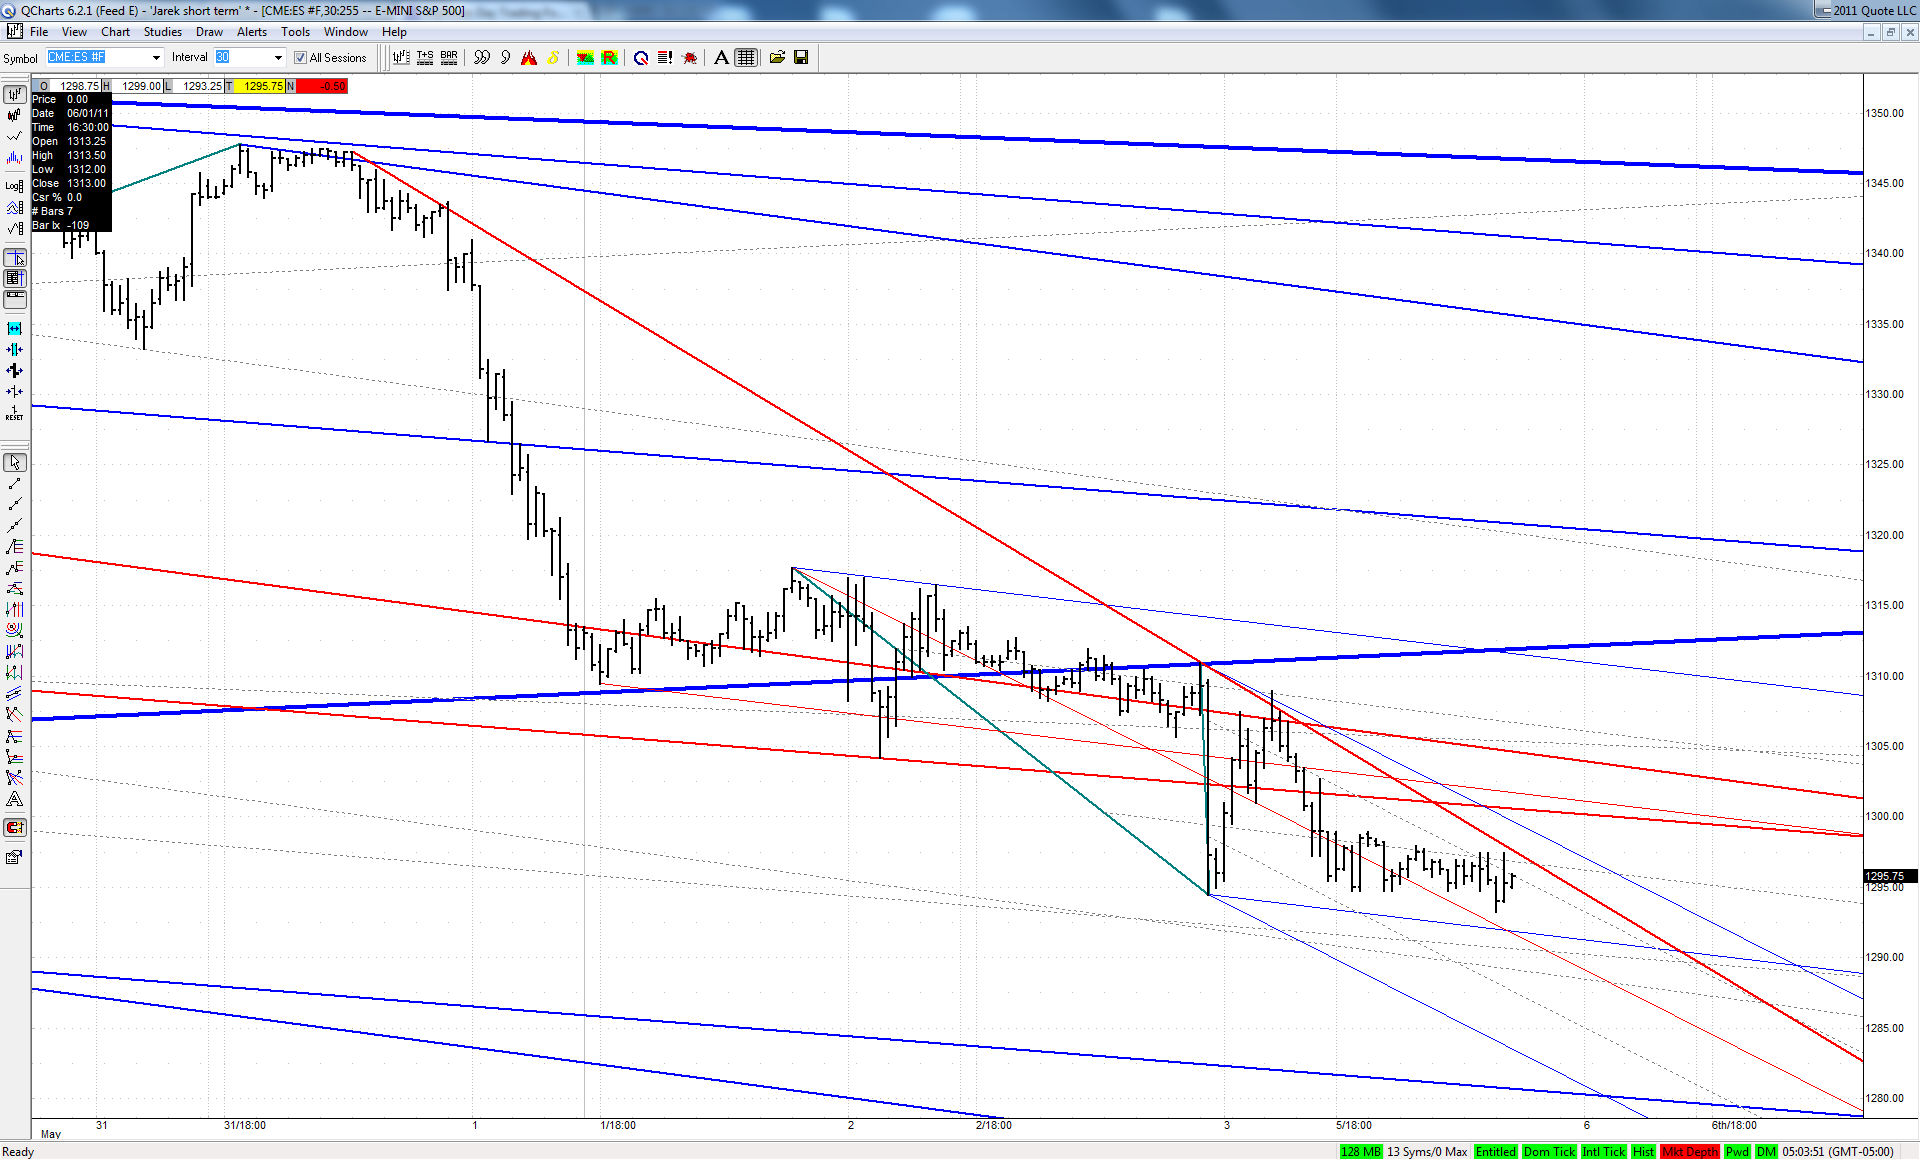
The levels I am watching on the ES are:

~1290-92 plus or minus

1277-83

1246-47

The lower area is particularly intriguing. I think the middle level is the highest probability for a move and then a bounce, based on looking at extensive charts over the weekend, and seeing almost everything set up for one small leg down into a key area. If they all did that the ES would likely go to the middle area. Then we see.

There is also a very, very key line (with convergence), lining up with a very key .300, at 1262-65, so I will also see how it acts there (if it gets there). I probably should have just put that one in with the above levels, but I broke it out because I just don't have the type of additional Fib confluence there I'd really like to see. It's still quite a area to watch, though.

Keep in mind, too, the 'talk' is up right from here, now, with no additional drop. It might be. It is in an obvious area right here, with an obvious TL, SL, and in the 1.128/1.272 area of that big blast up. It could launch from here. We'll see.
JA
jarek
Rep: 94
Posts: 3,474
By no means it may look encouraging for bulls at this point:

Click image for original size
JA
jarek
Rep: 94
Posts: 3,474
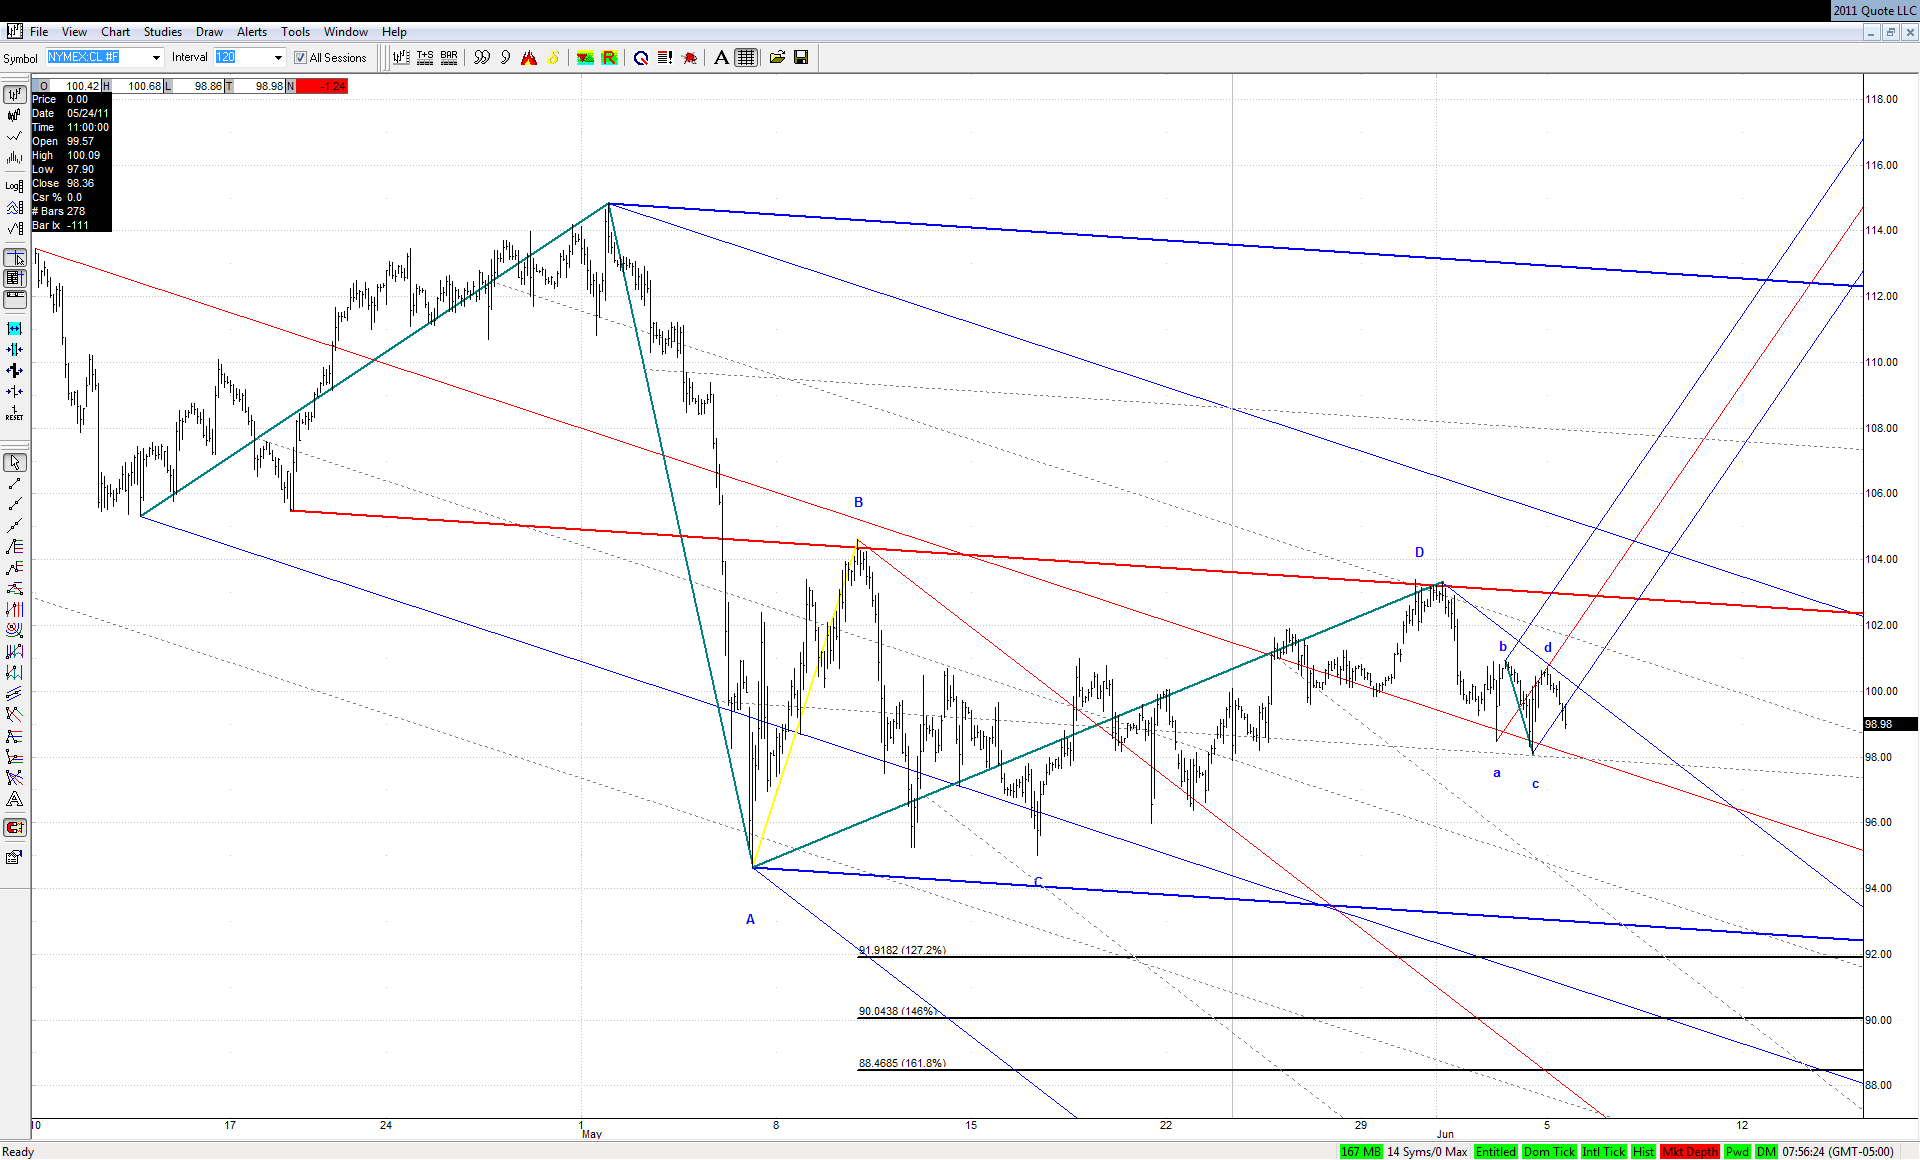
Could this small bearish ABCD in Crude have been a W2 of the move off our bigger bearish 4PT?

Click image for original size
JA
jarek
Rep: 94
Posts: 3,474
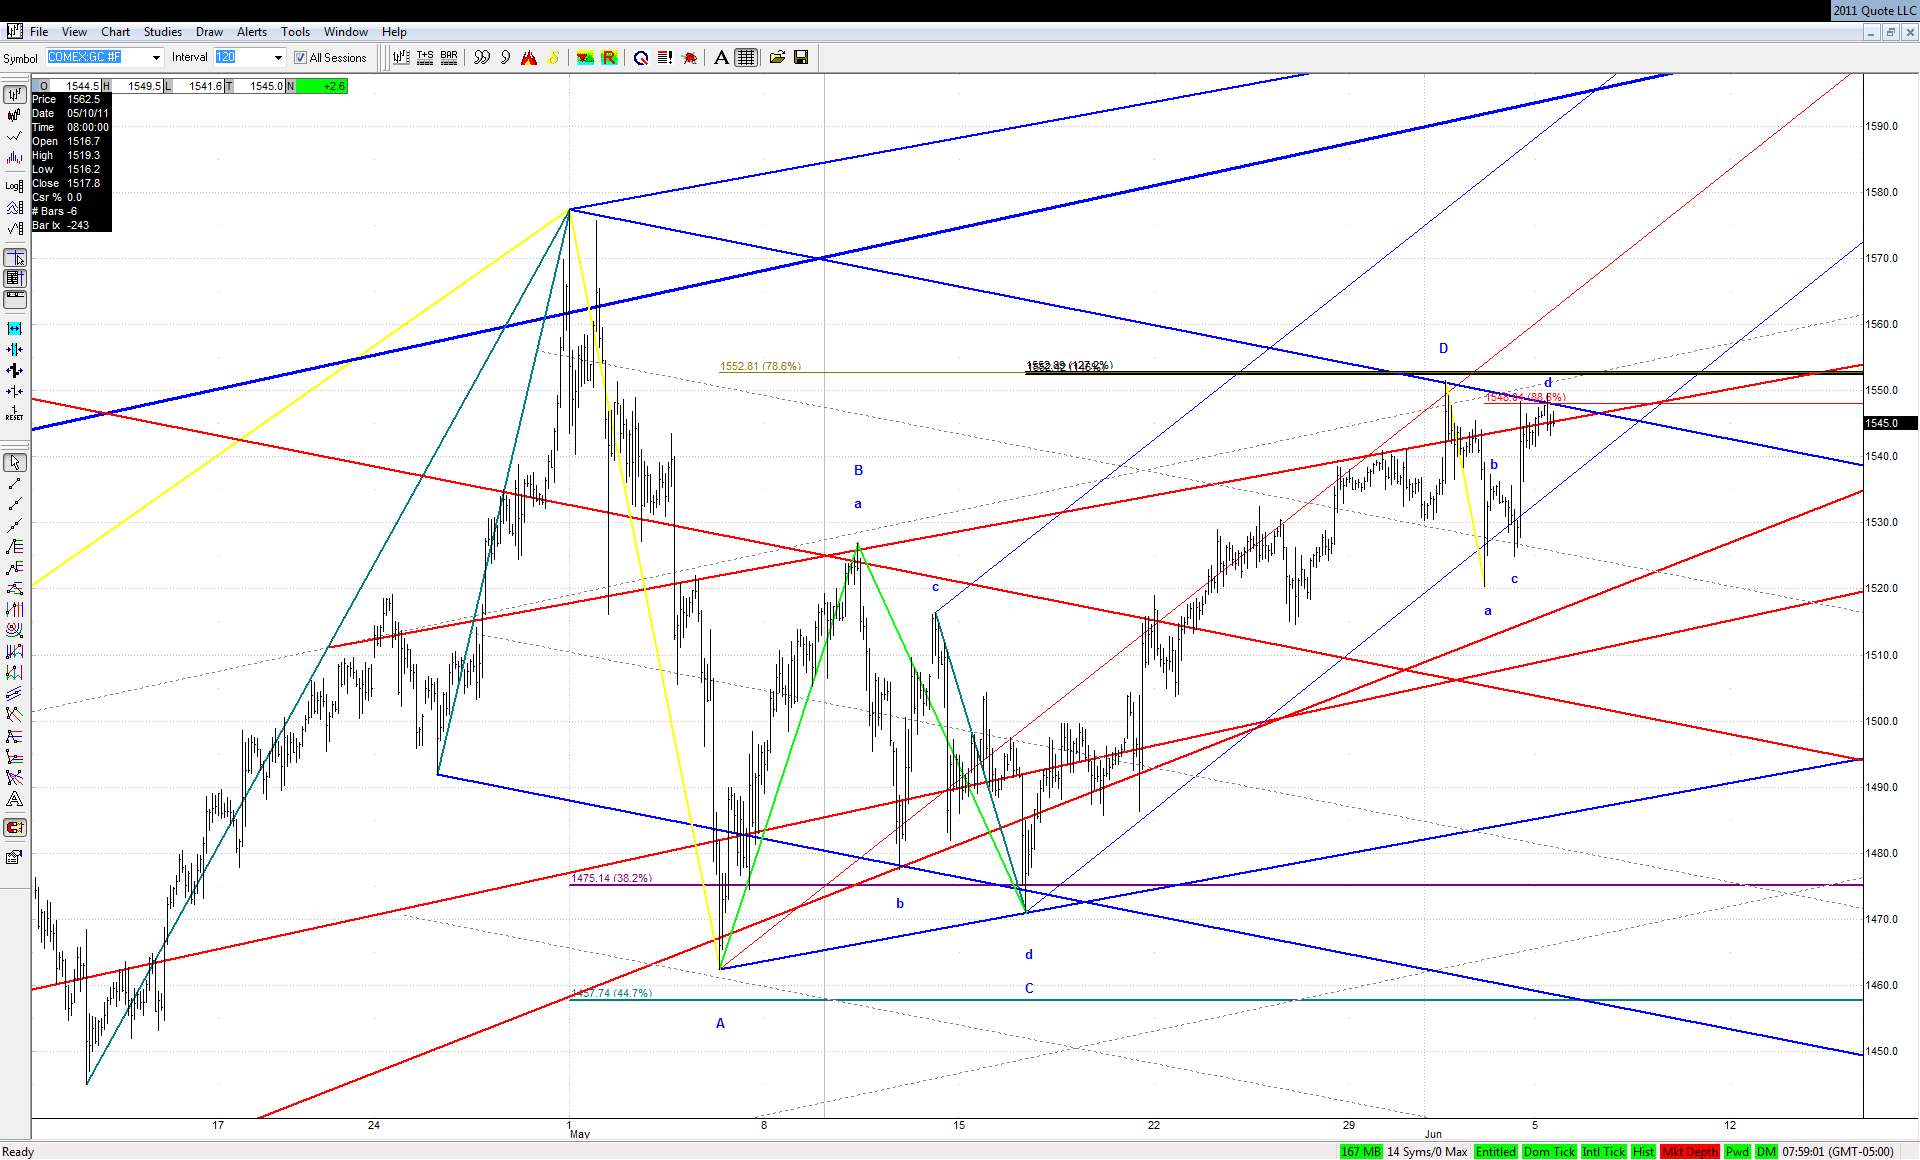
My area in Gold is close from being broken to the upside:

Click image for original size
JA
jarek
Rep: 94
Posts: 3,474
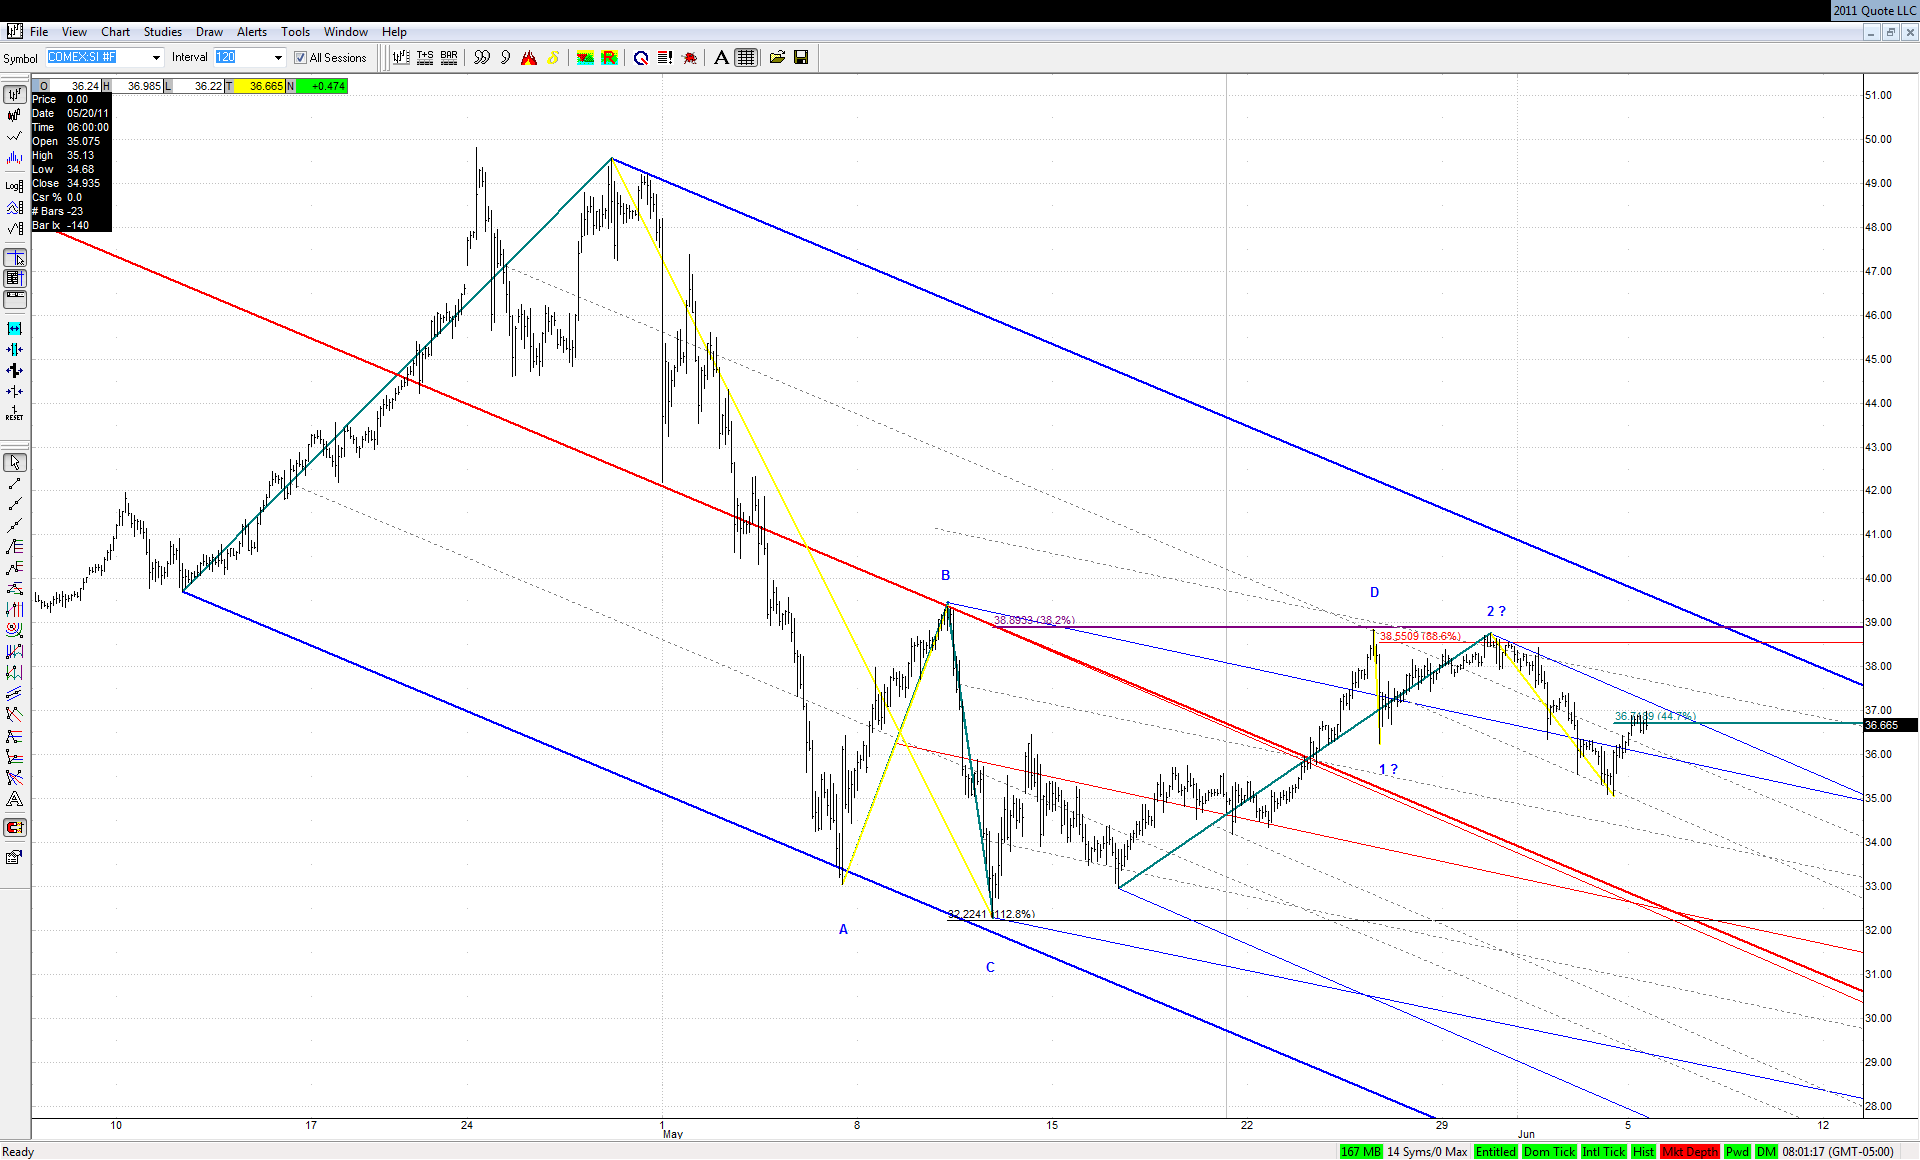
In Silver the W3 down concept is also close from being denied:

Click image for original size
TX
tx_ches
Rep: -10
Posts: 514
iso, what does DPTL stand for on your chart?
Great charts. Thanks.
Originally posted by iso

USDCAD ....
RA
rat89
Rep: 0
Posts: 7,015
it might have to, and we'll find out soon


Originally posted by tx_ches

I could certainly see it going lower though.