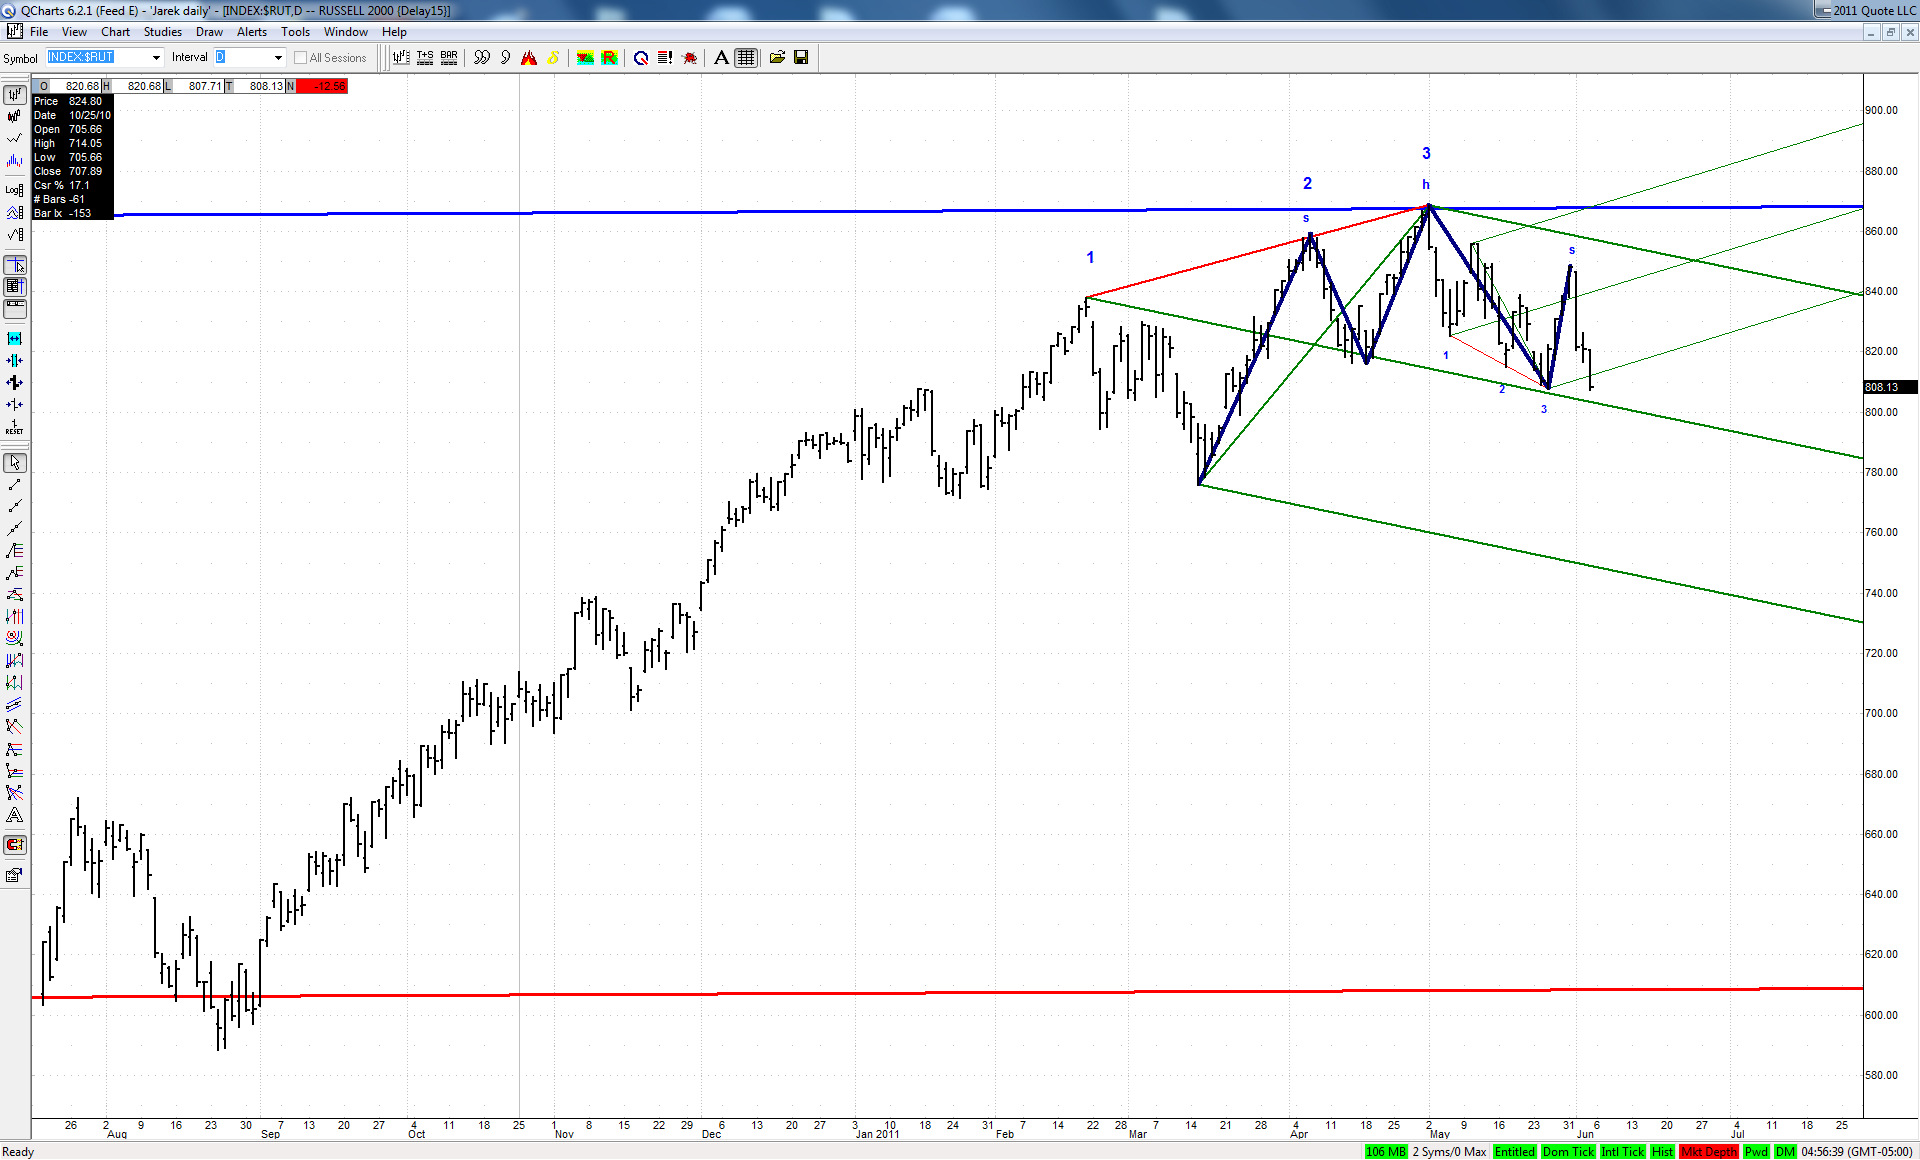
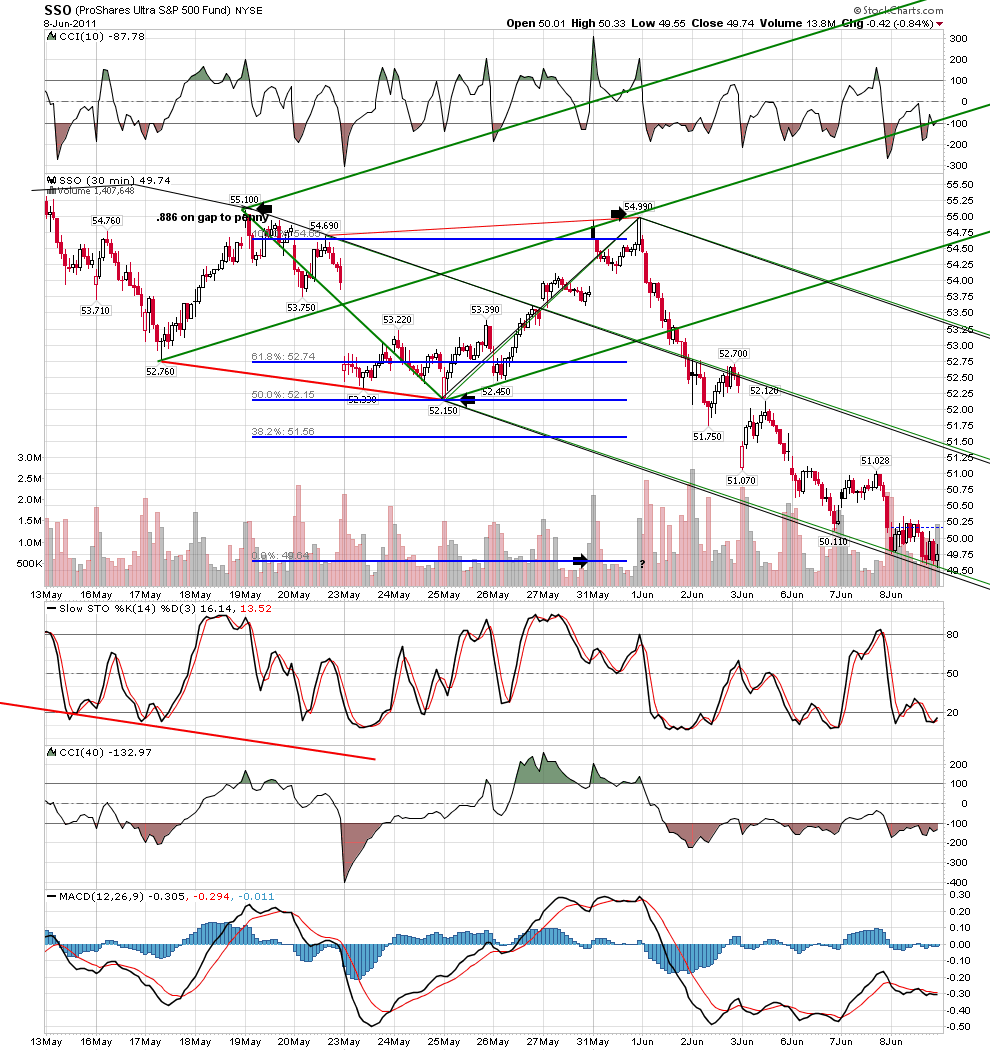
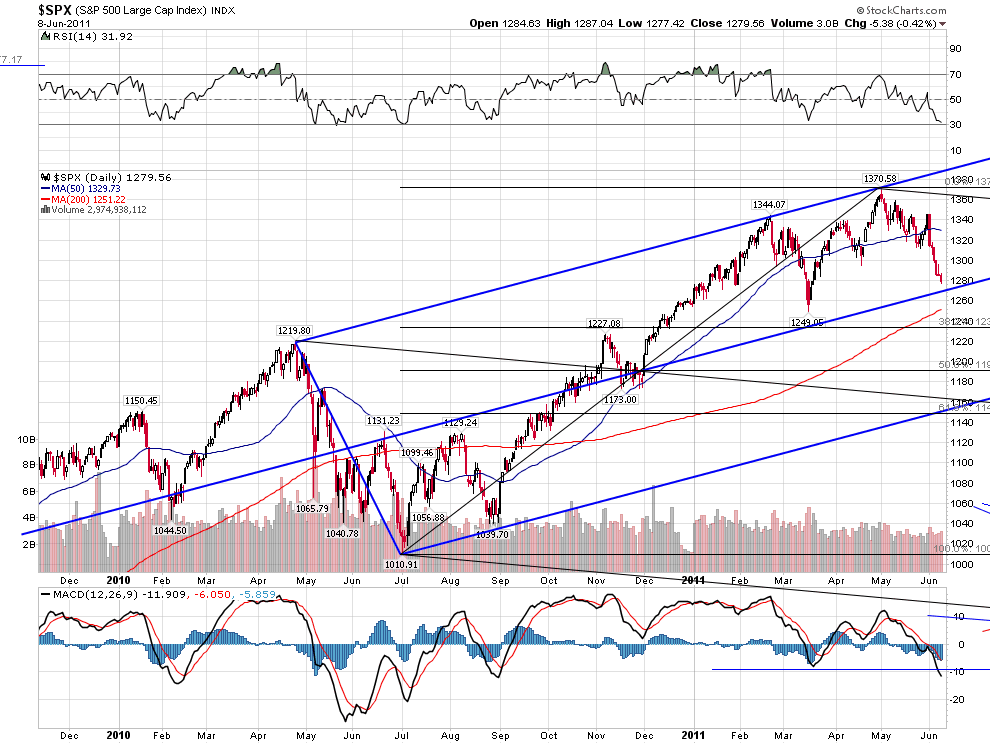
Jim suggested to take a look at daily charts of some secondary indexes and here is my current $RUT chart:
The green ML of a set based on big bearish 3D happens to be also a neckline of a classic head and shoulders. If bulls would not be able to defend this line next week, then a move to the lower ML should follow. This would also be a perfect fulfillment of a successful H&S pattern.
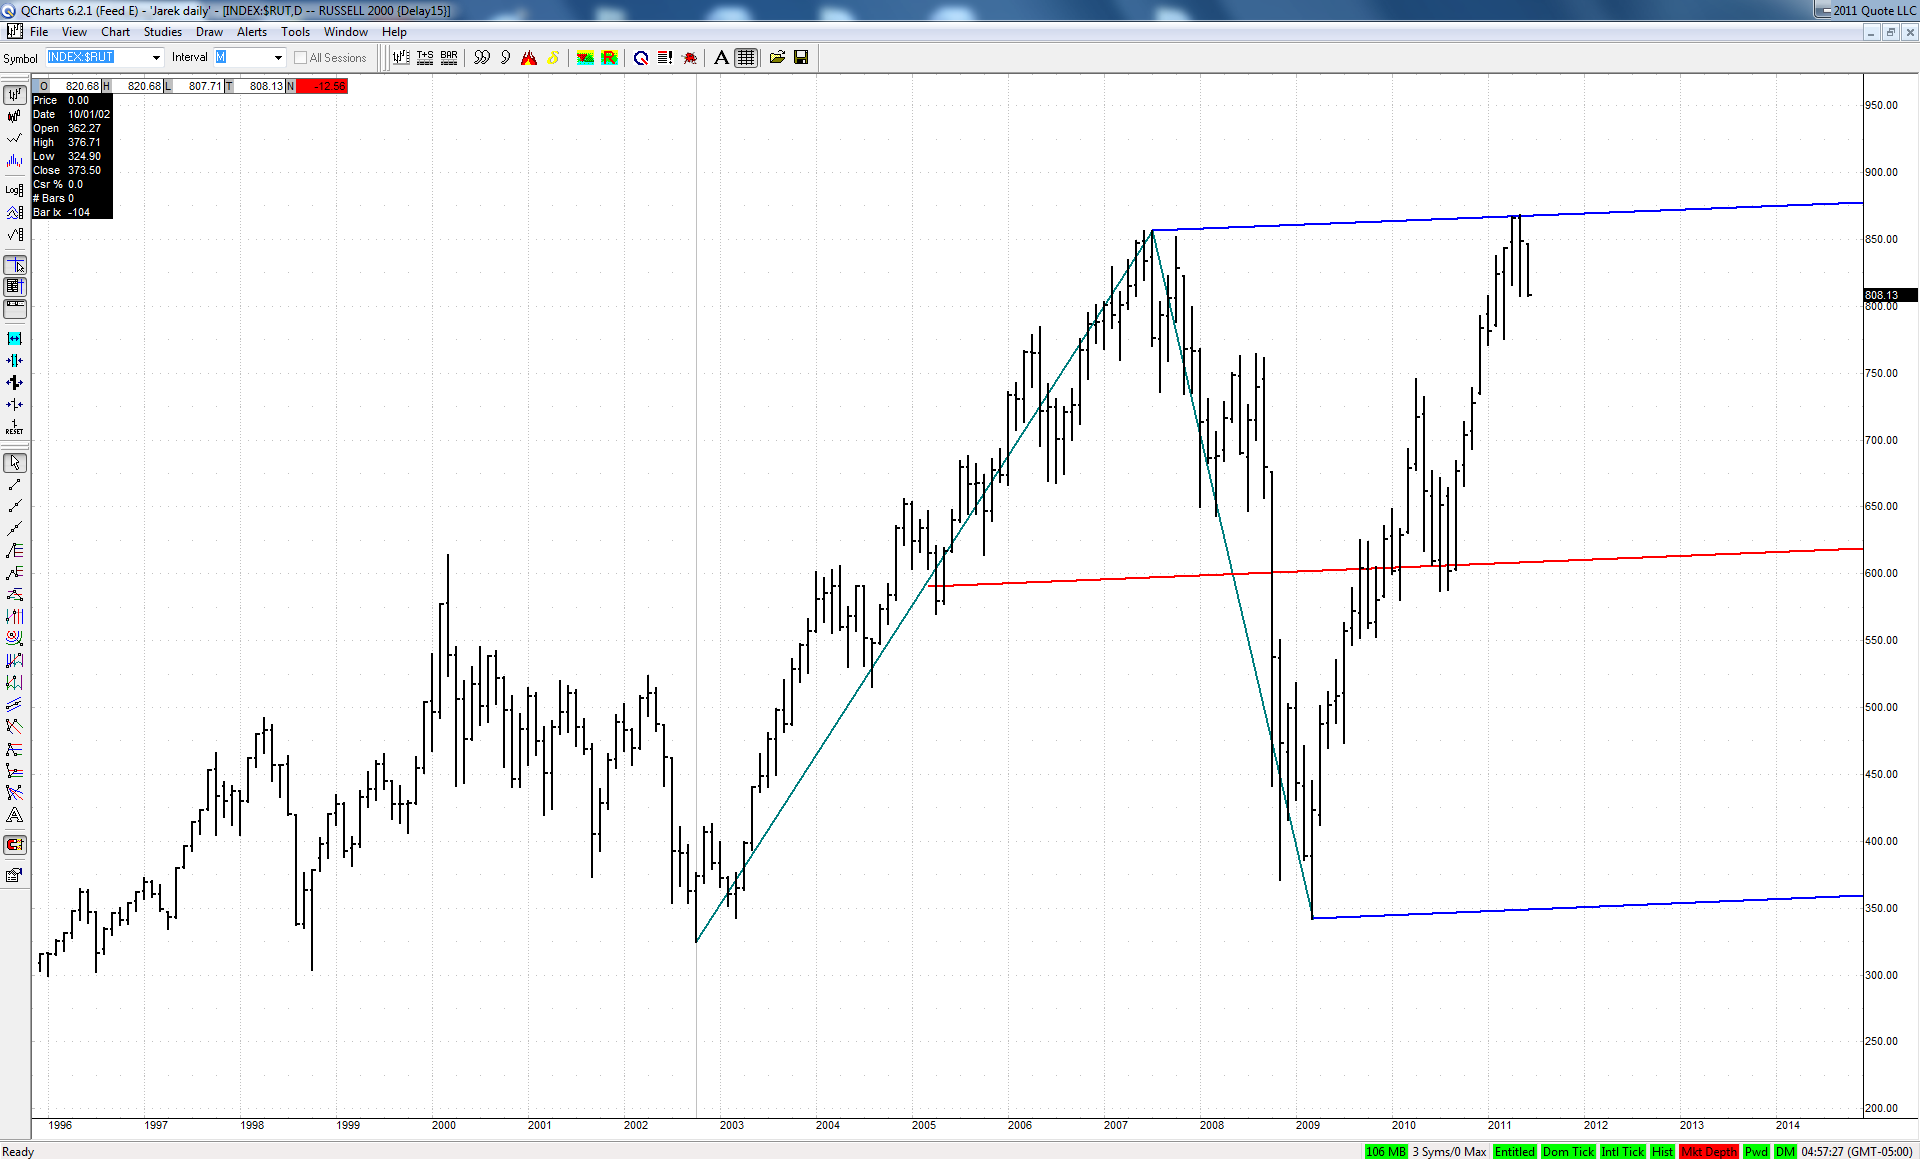
It is all the more interesting as this big bearish 3D fell dead on at the upper ML of a quite important set:
JI
jimkane
Rep: 3,058
Posts: 33,089
And sometimes the idea is right and the timing is off. They hit the LOD to the tick, and didn't shoot for the stops, and up it goes. Now, maybe this bounce is to set it up to crush it. Or maybe we see that 86 and 88 and change areas in the GLOBEX. But no matter, they keep trying to send this up, no matter how weakly and how impotent they seem to be. Like I said, I know what they want. Perhaps they just can't have it. But they want it.
JI
jimkane
Rep: 3,058
Posts: 33,089
Wow, the stop run in the after-cash perhaps? The sellers are relentless. The wants of the bulls are just fading every day. I love it, but it is so surprising. I guess the Fed plan of letting the market fall to scare people into QE3 and to have them beg for it, all in time for the Jackson Hole speech, which looked like it wasn't going to unfold, seems right on track again.
JI
jimkane
Rep: 3,058
Posts: 33,089
Note, too, that all sentiment indicators I saw were pegged to critical lows only seen right before big bounces or market reversals. They can get more extreme, but they are pegged right now. Note, though, that mutual fund cash is at an all-time low, which you see at market tops. This is the most extreme it has ever been. So intermediate-term indicators say a bounce is due, but one key higher timeframe indicator screams a market top is in or nearby. Just some interesting data points.
JI
jimkane
Rep: 3,058
Posts: 33,089
And they gets the stops on the GLOBEX open. Let's see if there's any follow through. Initially, it does little. I'd have thought there would be tons of stops down there.
JI
jimkane
Rep: 3,058
Posts: 33,089
Remember, tomorrow is rollover day for the ES, the front month is now Sept.
JI
jimkane
Rep: 3,058
Posts: 33,089
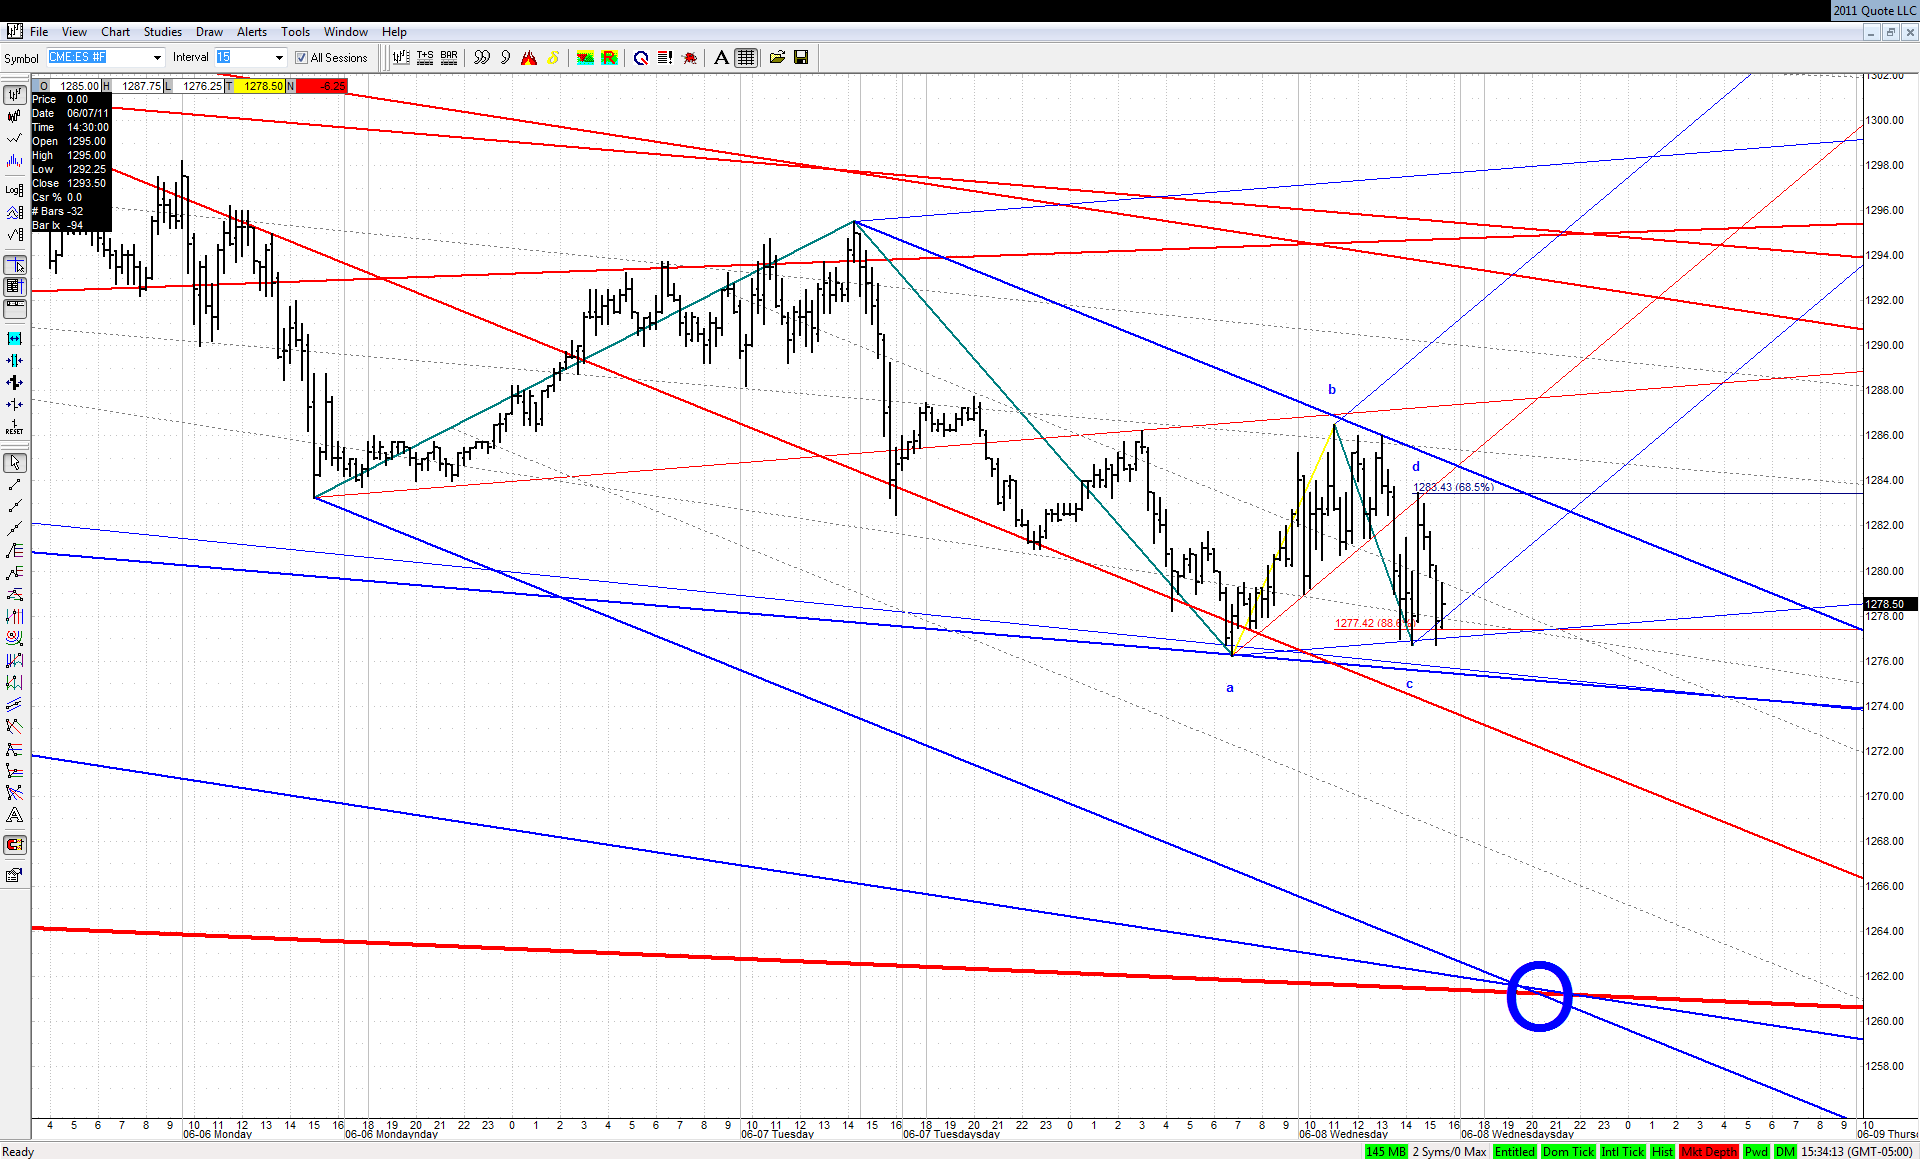
It hit 75.25 and is bouncing. Is this it? Or another bounce they'll sell? And with rollover, and the Sept contract being 5.50 lower, that skews the continuous contract chart quite a bit. So, how to handle that? There isn't a good answer. I'll still chart the June contract on the higher timeframe for awhile.
Originally posted by jimkane
If they drop it, I'm watching 73.50-75, and 71.50, give or take.
RO
roofer
Rep: 3,689
Posts: 3,574
this is one of those times that what is going on takes all a traders energy and i am too tired to talk... the tools did their job and i exited the rest of index swing trades...today....but what concerns me is this...so many traders whose work i respect are looking for a turn here... or soon... yet when i look at hundreds of charts in longer time frames... the vast majority are hanging by a thread on the geometry with much lower targets sitting there to be hit...if they all let go simultaneously... it would be seen as a crash....at THIS MOMENT... contrary to my usual style, i feel no urgency to trade at the extremes...