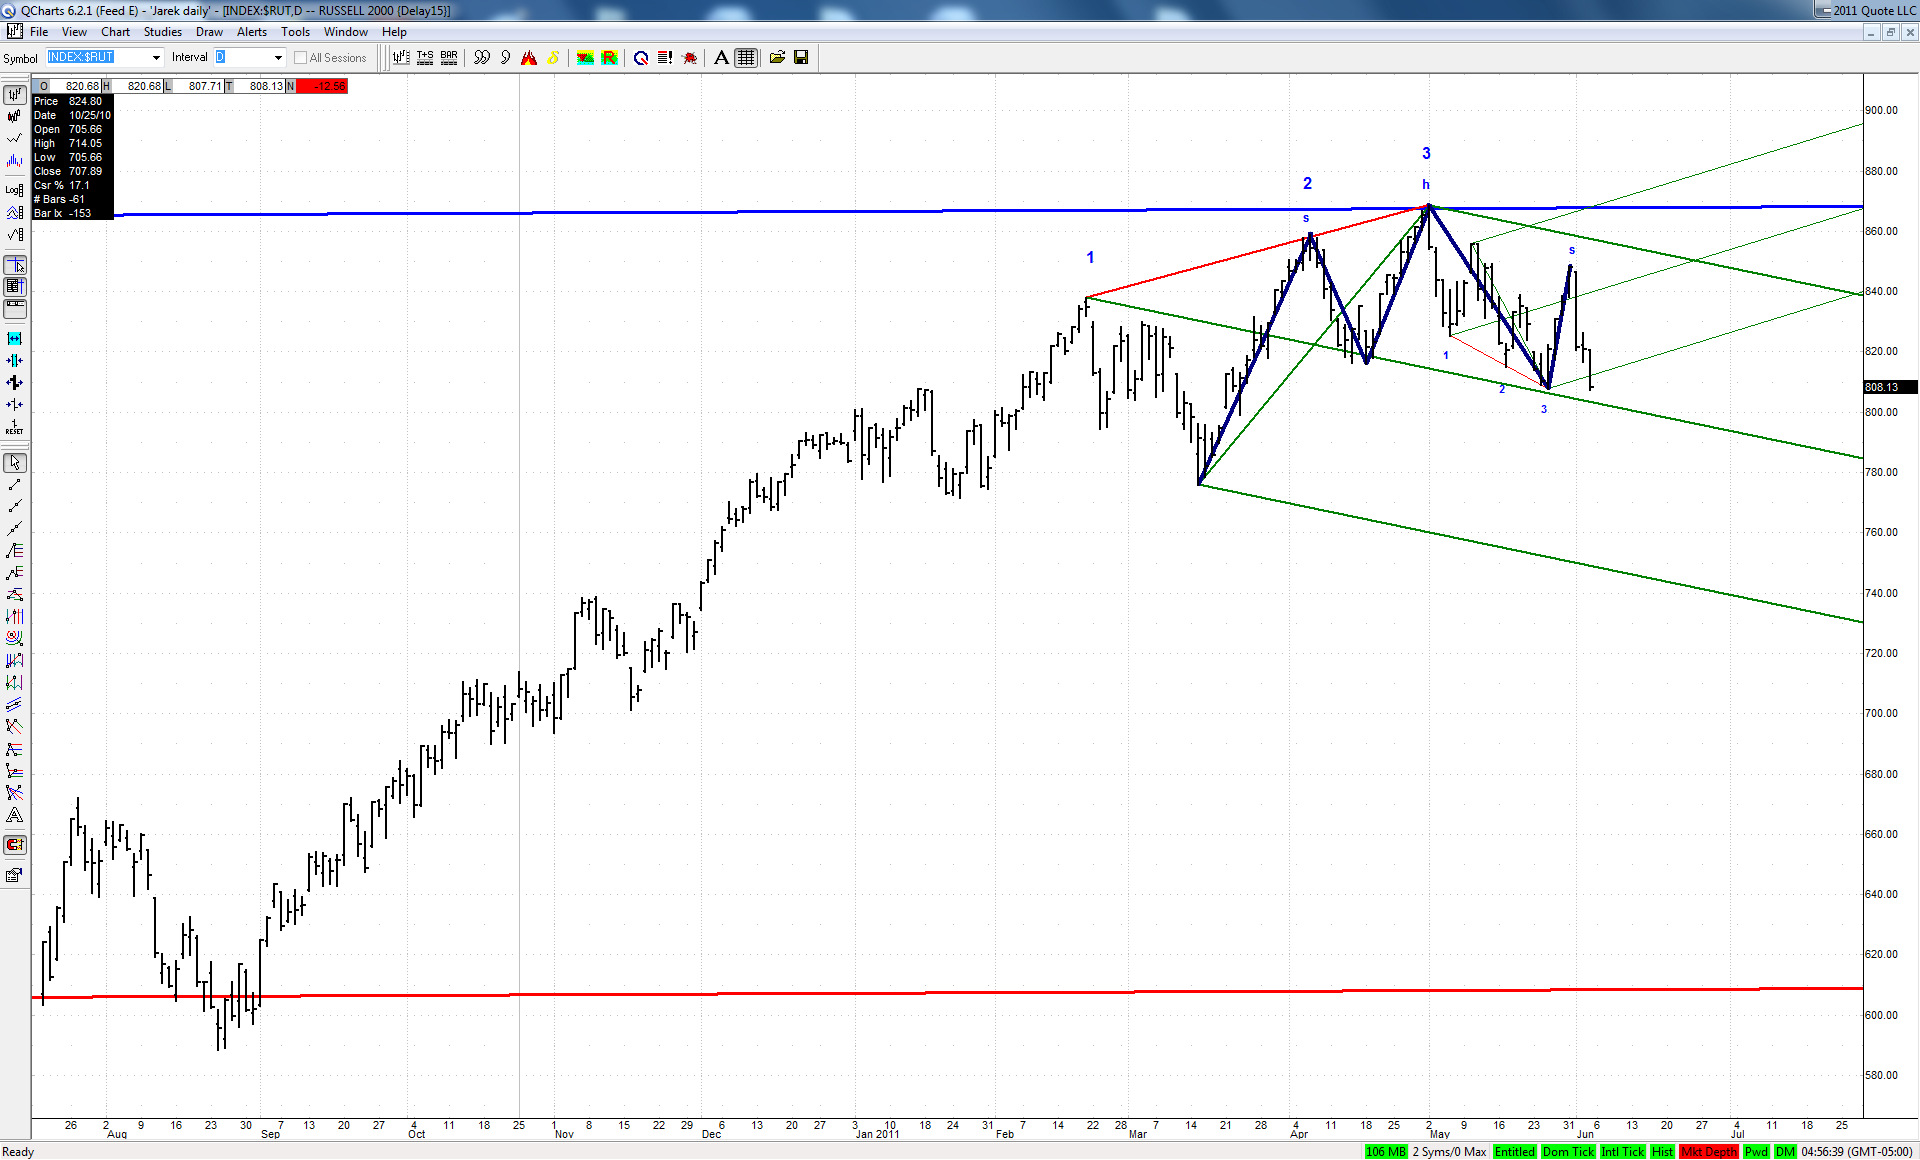
Jim suggested to take a look at daily charts of some secondary indexes and here is my current $RUT chart:
The green ML of a set based on big bearish 3D happens to be also a neckline of a classic head and shoulders. If bulls would not be able to defend this line next week, then a move to the lower ML should follow. This would also be a perfect fulfillment of a successful H&S pattern.
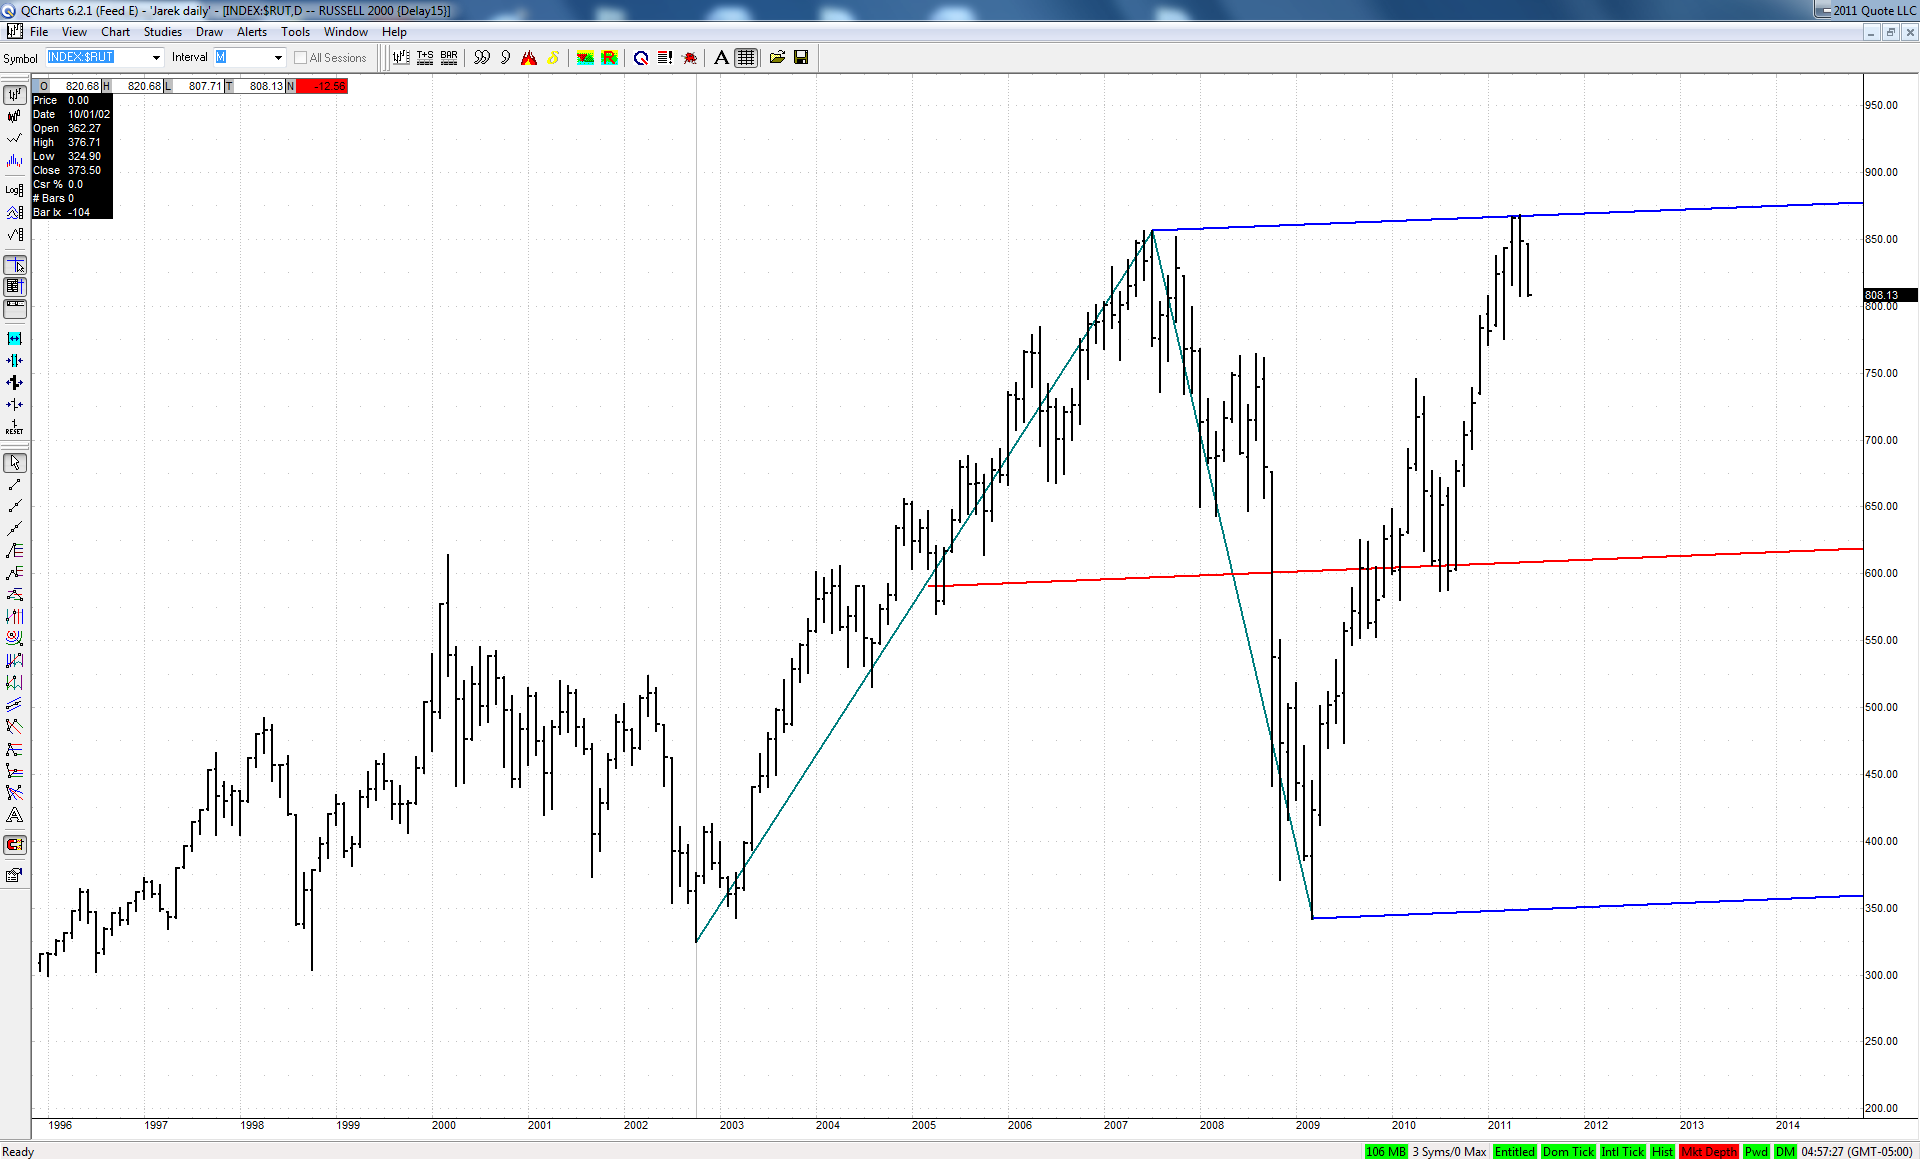
It is all the more interesting as this big bearish 3D fell dead on at the upper ML of a quite important set:
JI
jimkane
Rep: 3,058
Posts: 33,089
This looks ready to sell hard. Now I wonder, will it, or are they trying to game me? Sure looks like it will sell.
JI
jimkane
Rep: 3,058
Posts: 33,089
, or no???
Originally posted by jimkane
This looks ready to sell hard. Now I wonder, will it, or are they trying to game me? Sure looks like it will sell.
JI
jimkane
Rep: 3,058
Posts: 33,089
See how they game you?
Originally posted by jimkane
, or no???
Originally posted by jimkane
This looks ready to sell hard. Now I wonder, will it, or are they trying to game me? Sure looks like it will sell.
JI
jimkane
Rep: 3,058
Posts: 33,089
95 or so is a key level. I haven't done all the work yet, so I'll have to post the more precise level later. Plus, rollover is really mucking up my charts.